. 2023 Feb;614(7948):500-508.
doi: 10.1038/s41586-022-05655-4. Epub 2022 Dec 21.

Reconstruction and deconstruction of human somitogenesis in vitro

Affiliations

Reconstruction and deconstruction of human somitogenesis in vitro

Yuchuan Miao et al. Nature. 2023 Feb.

Abstract

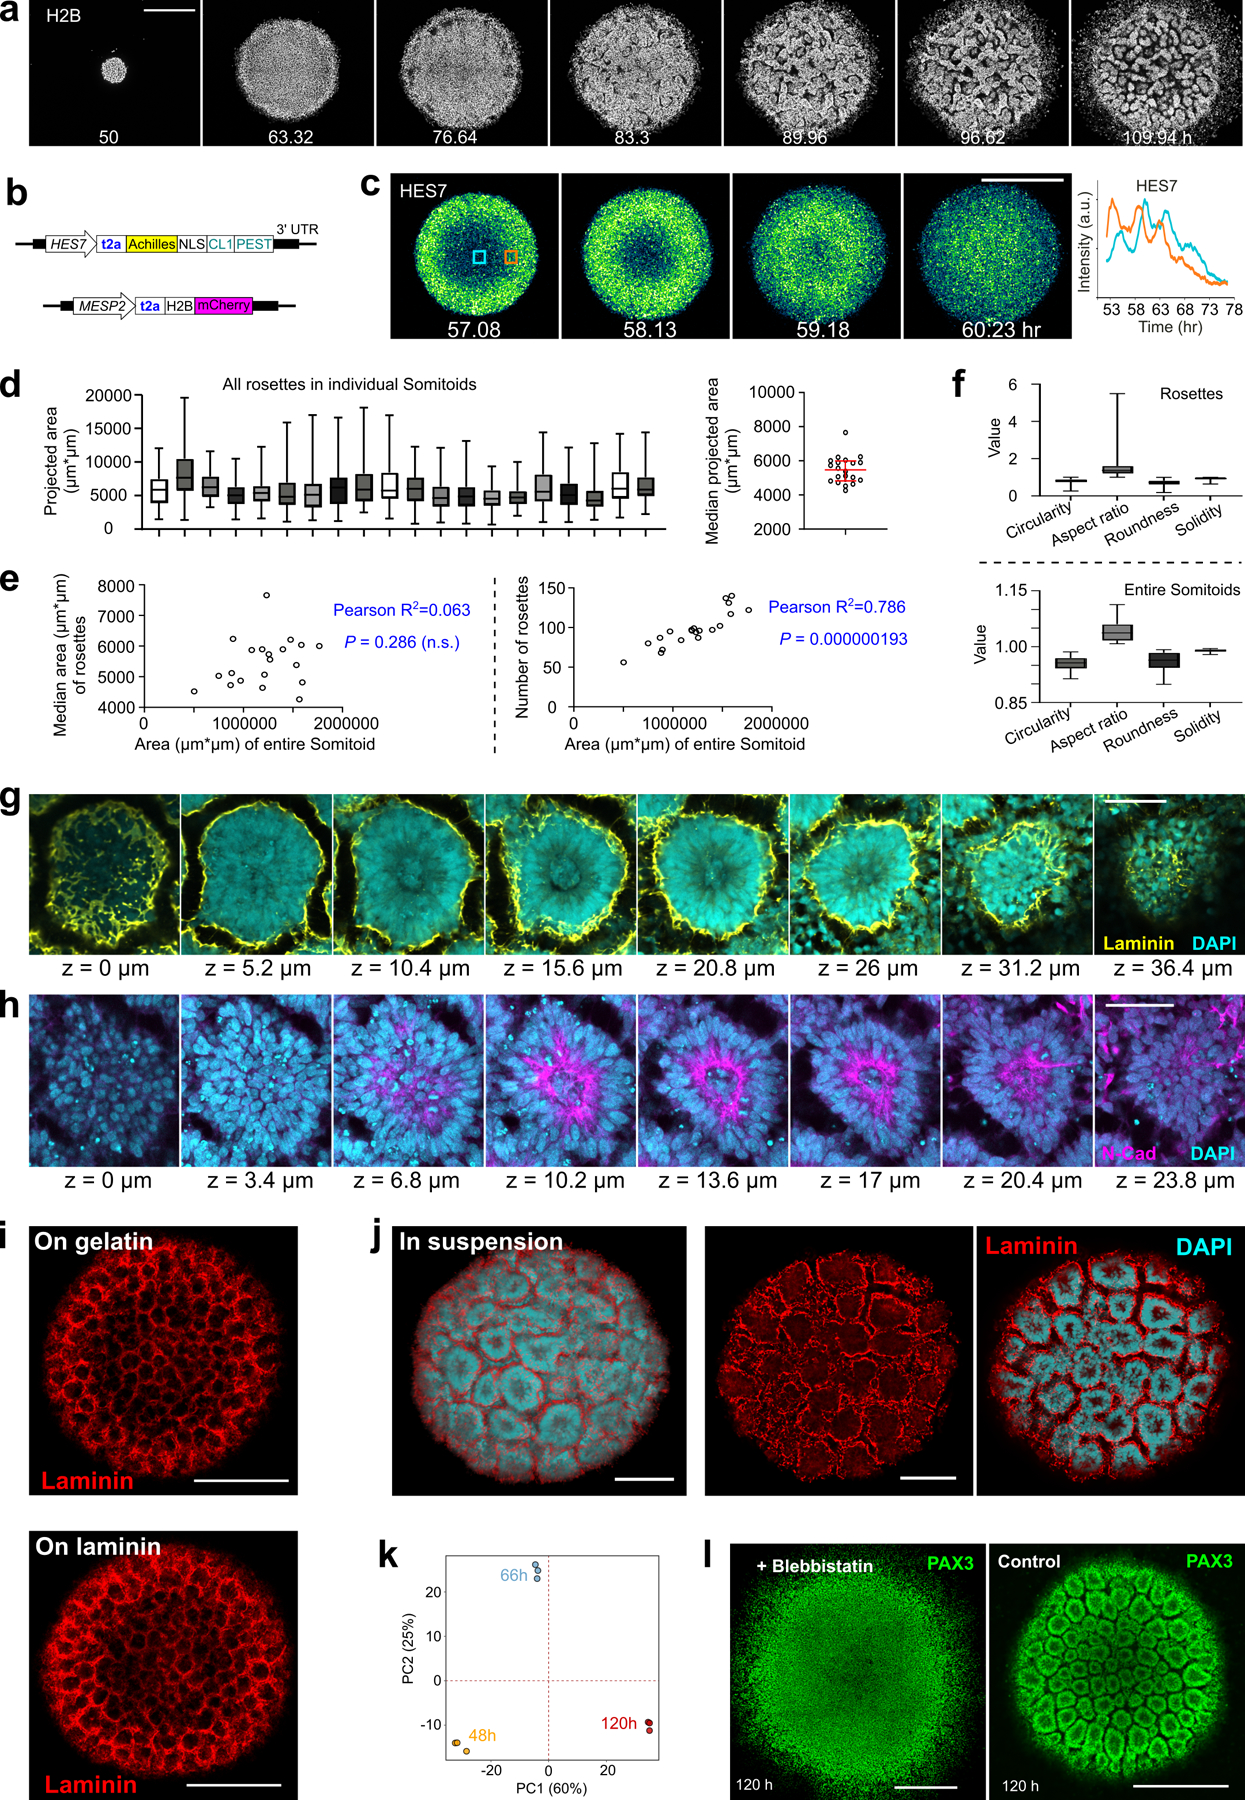
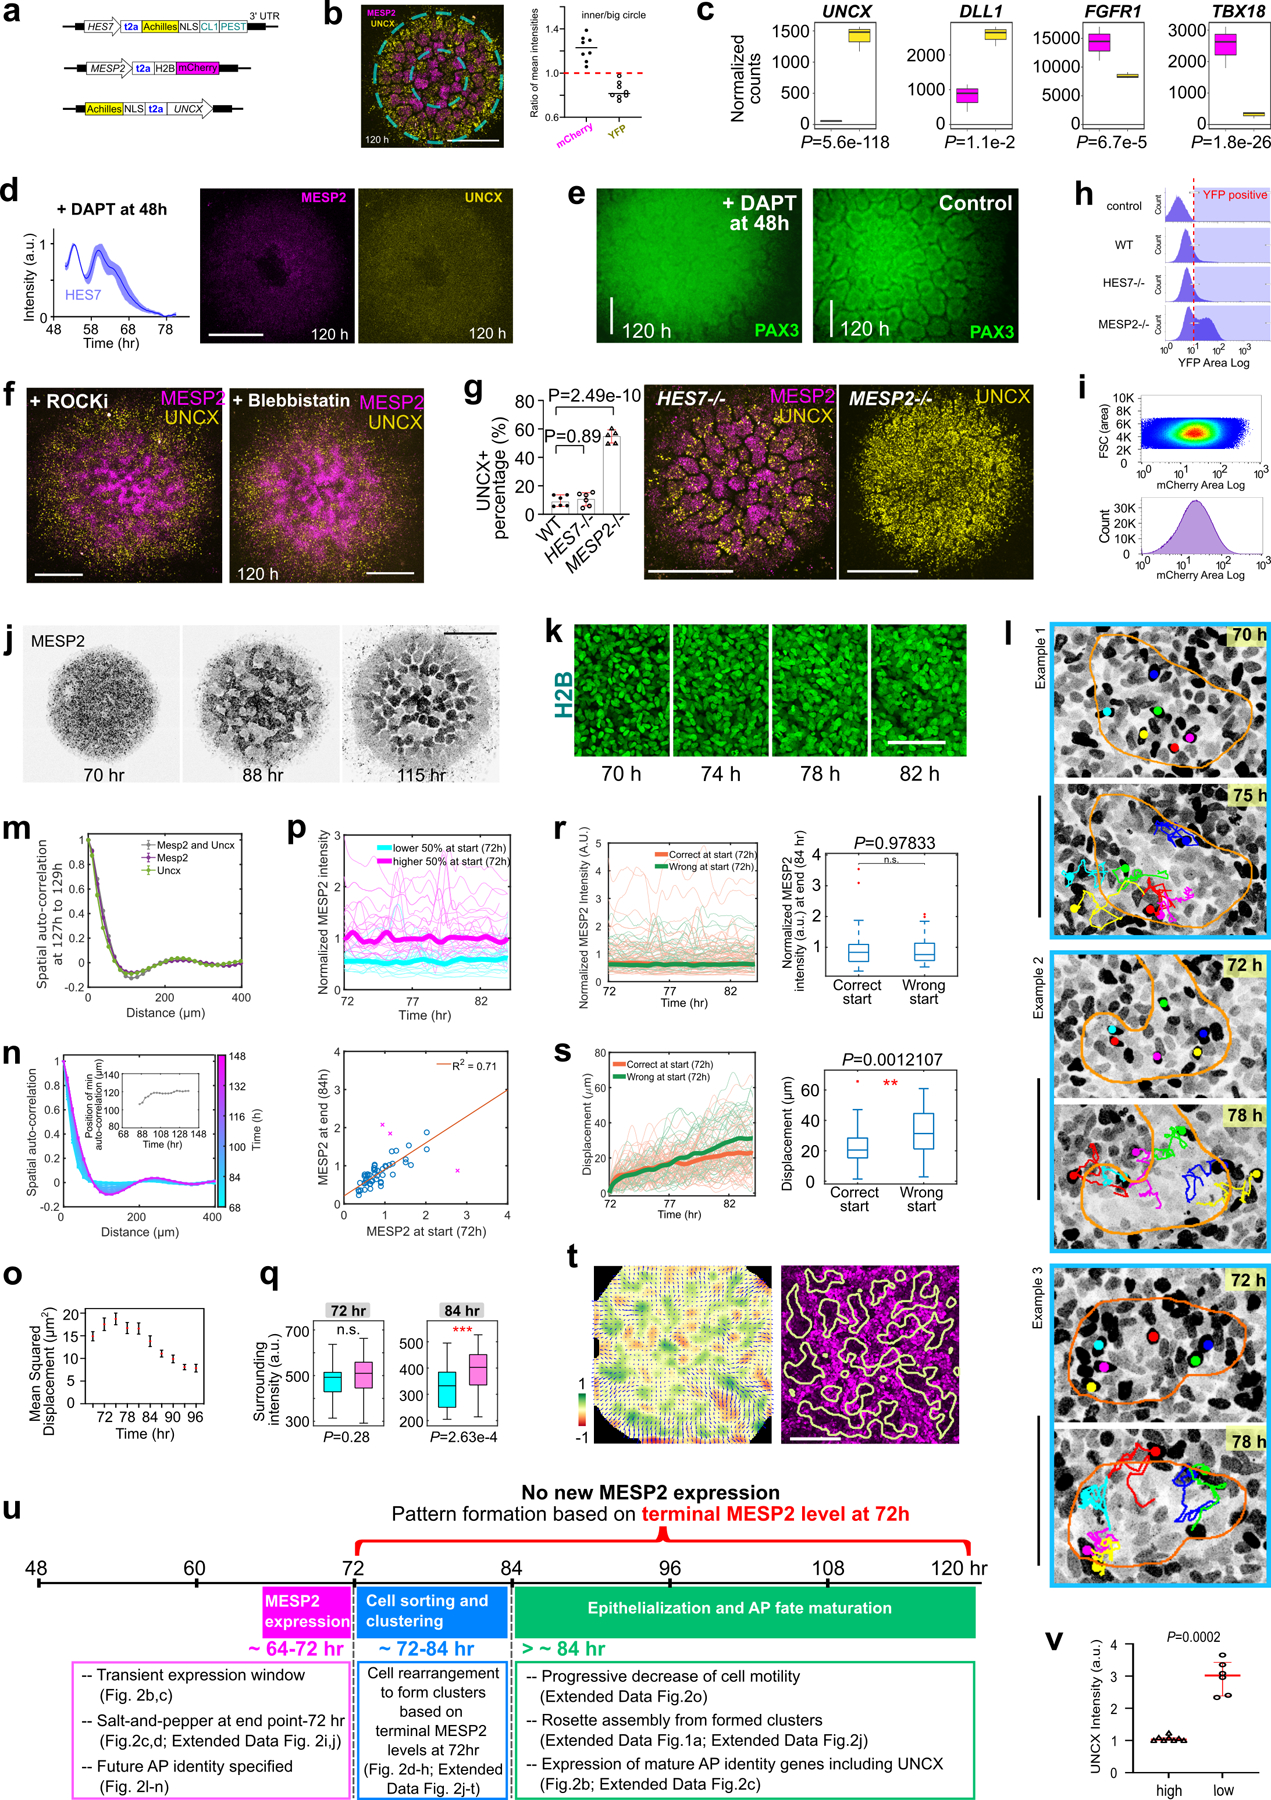
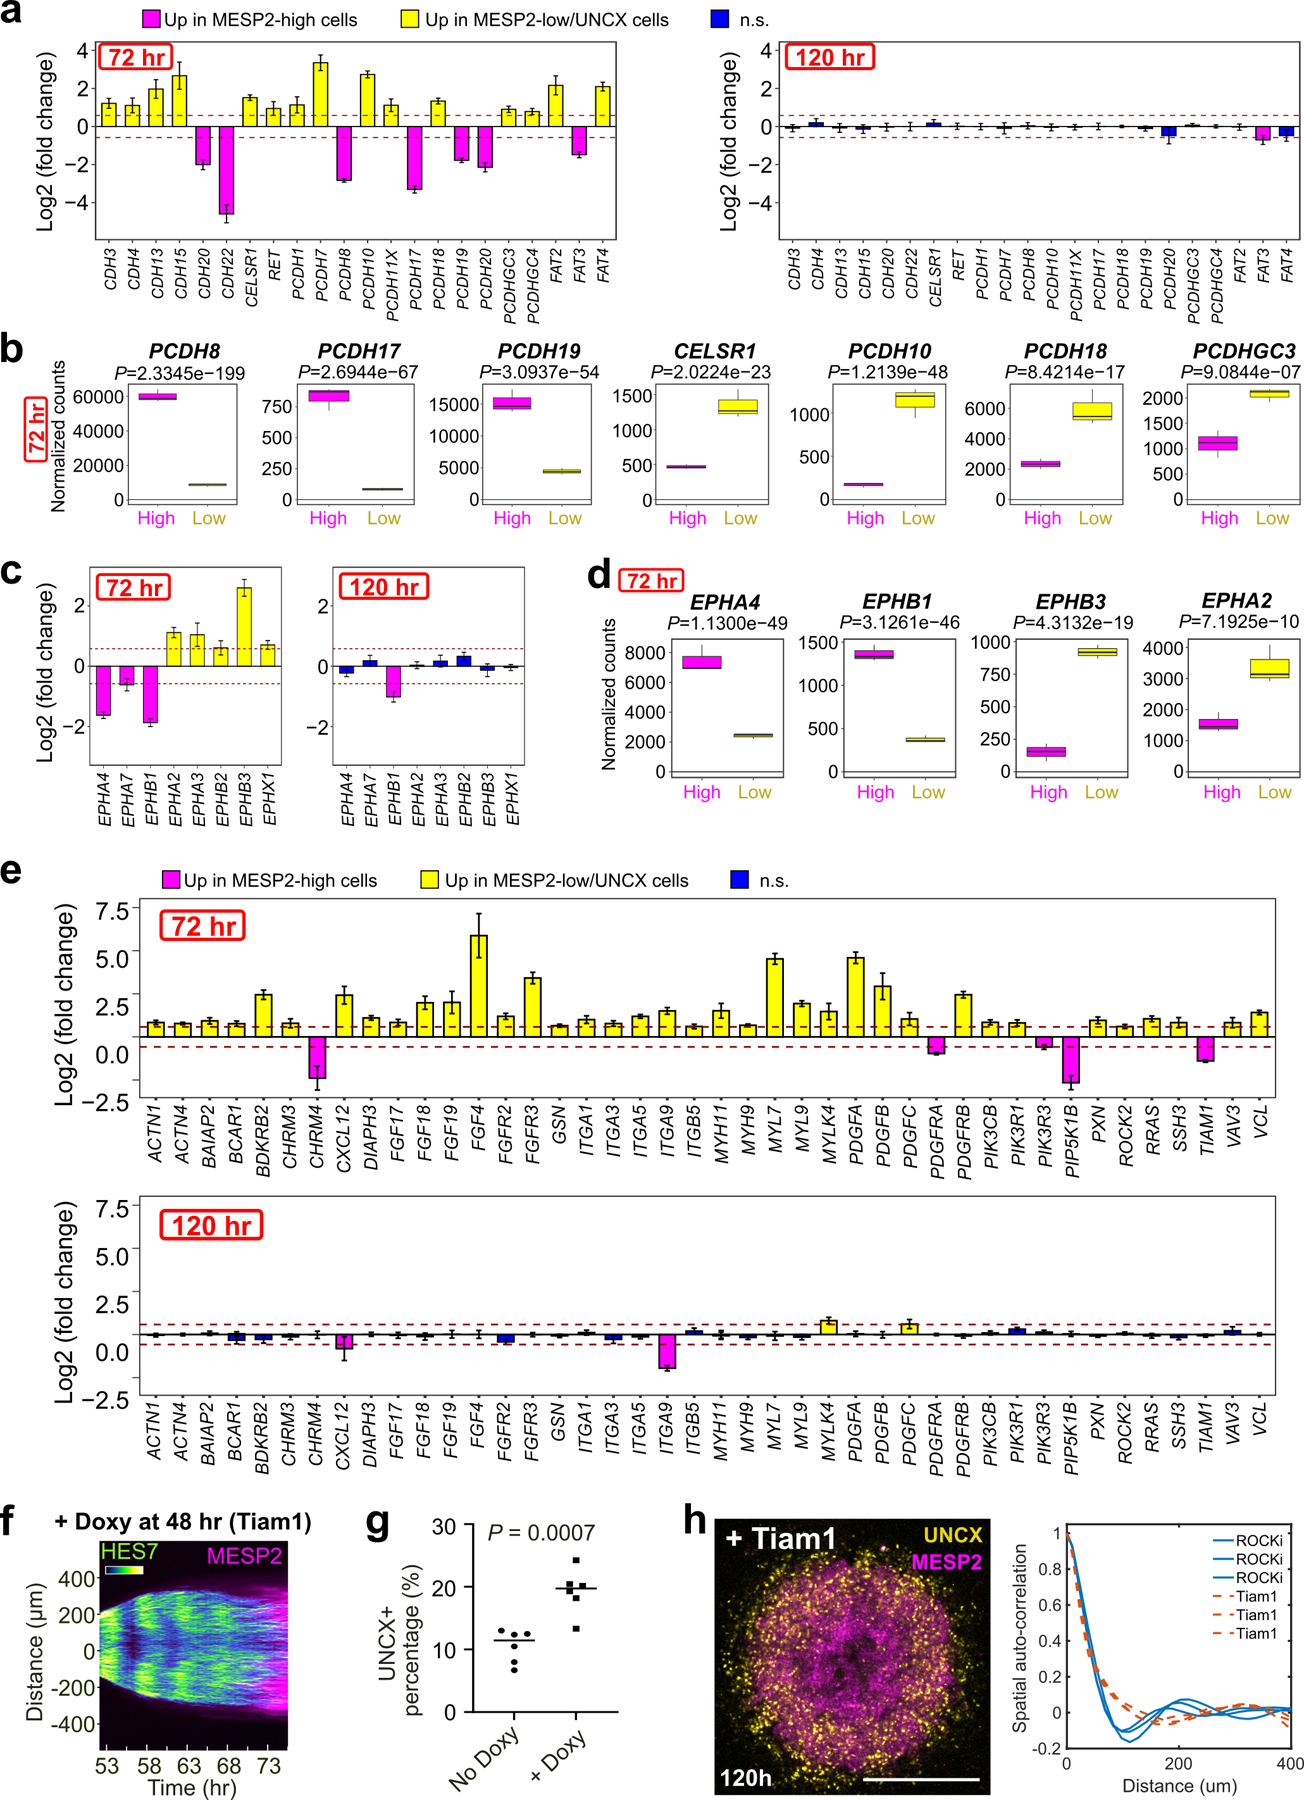
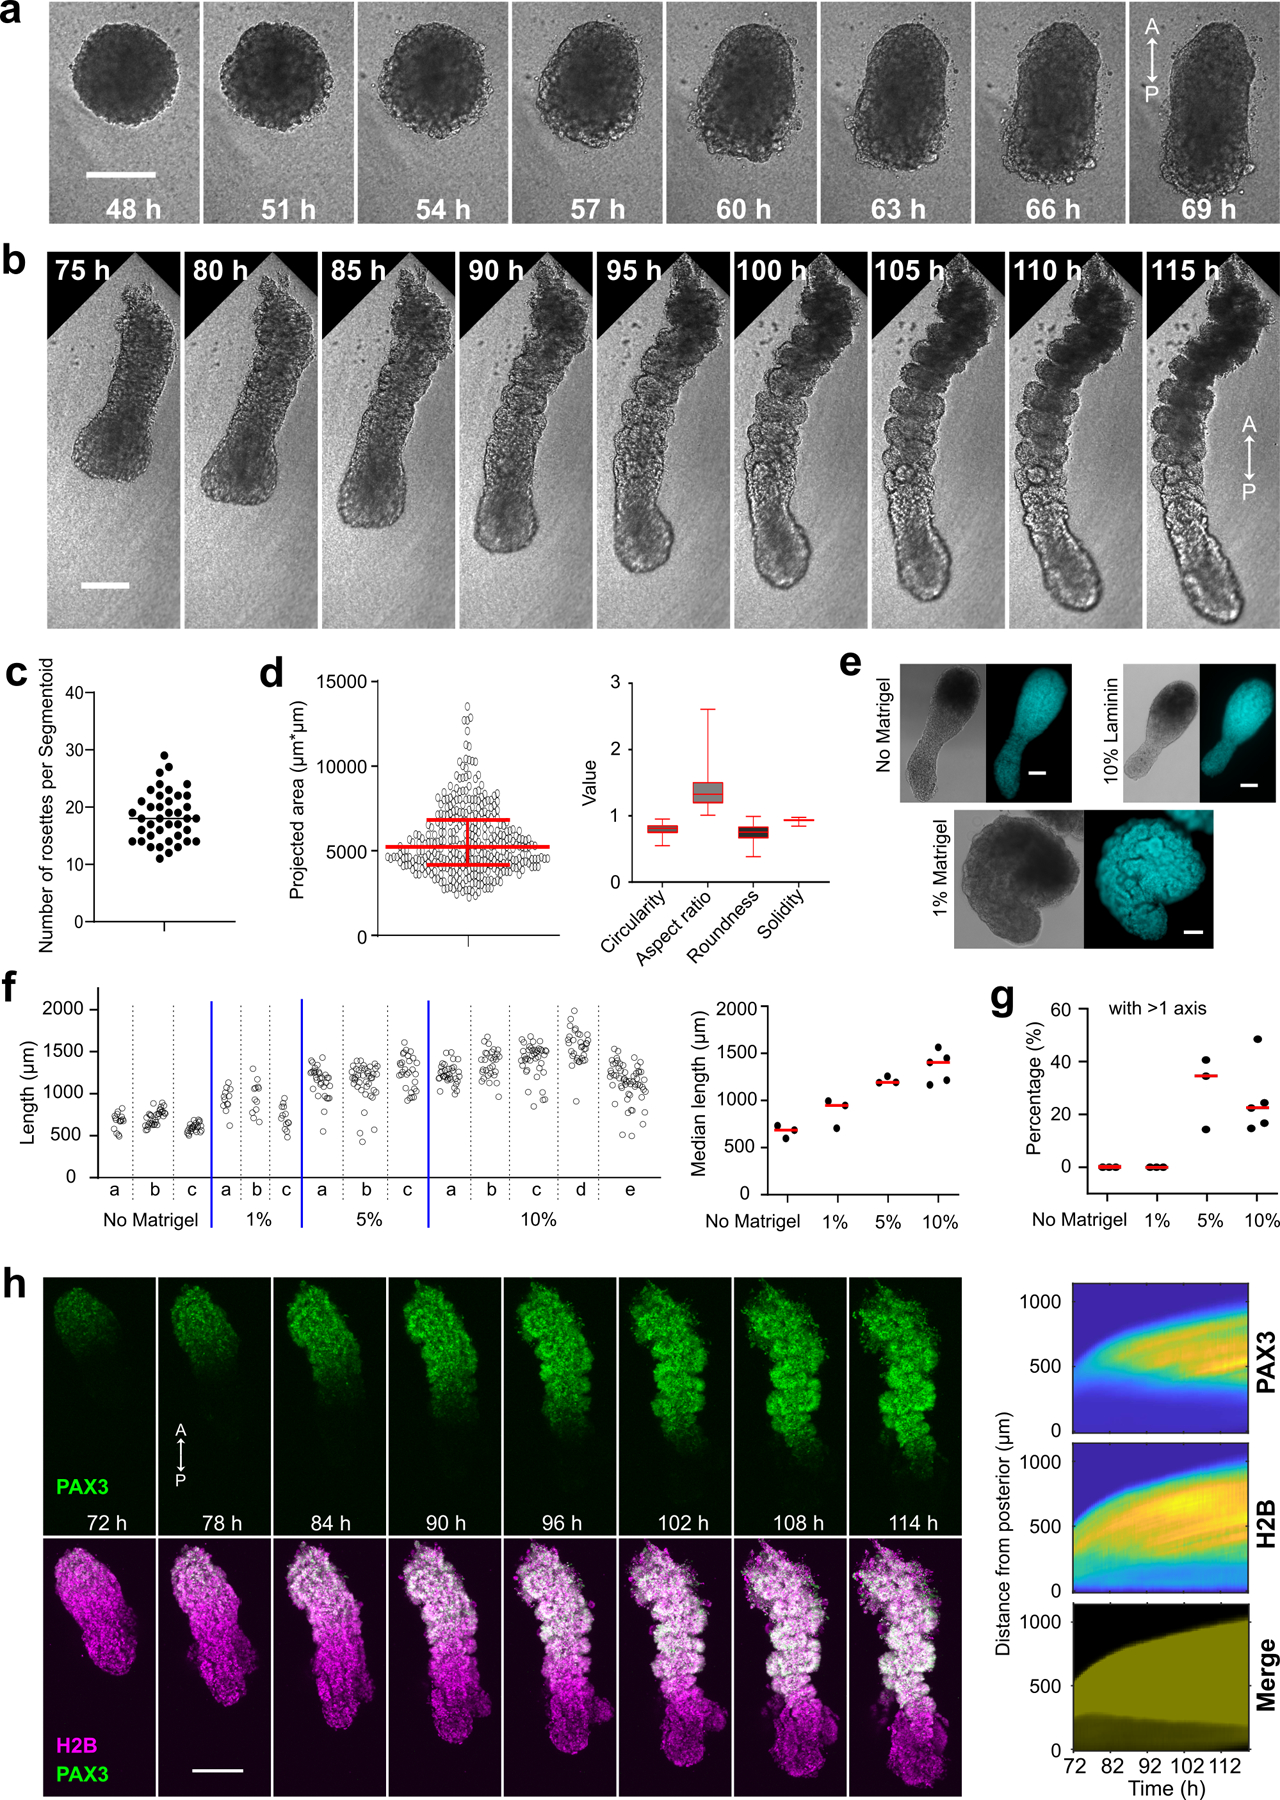
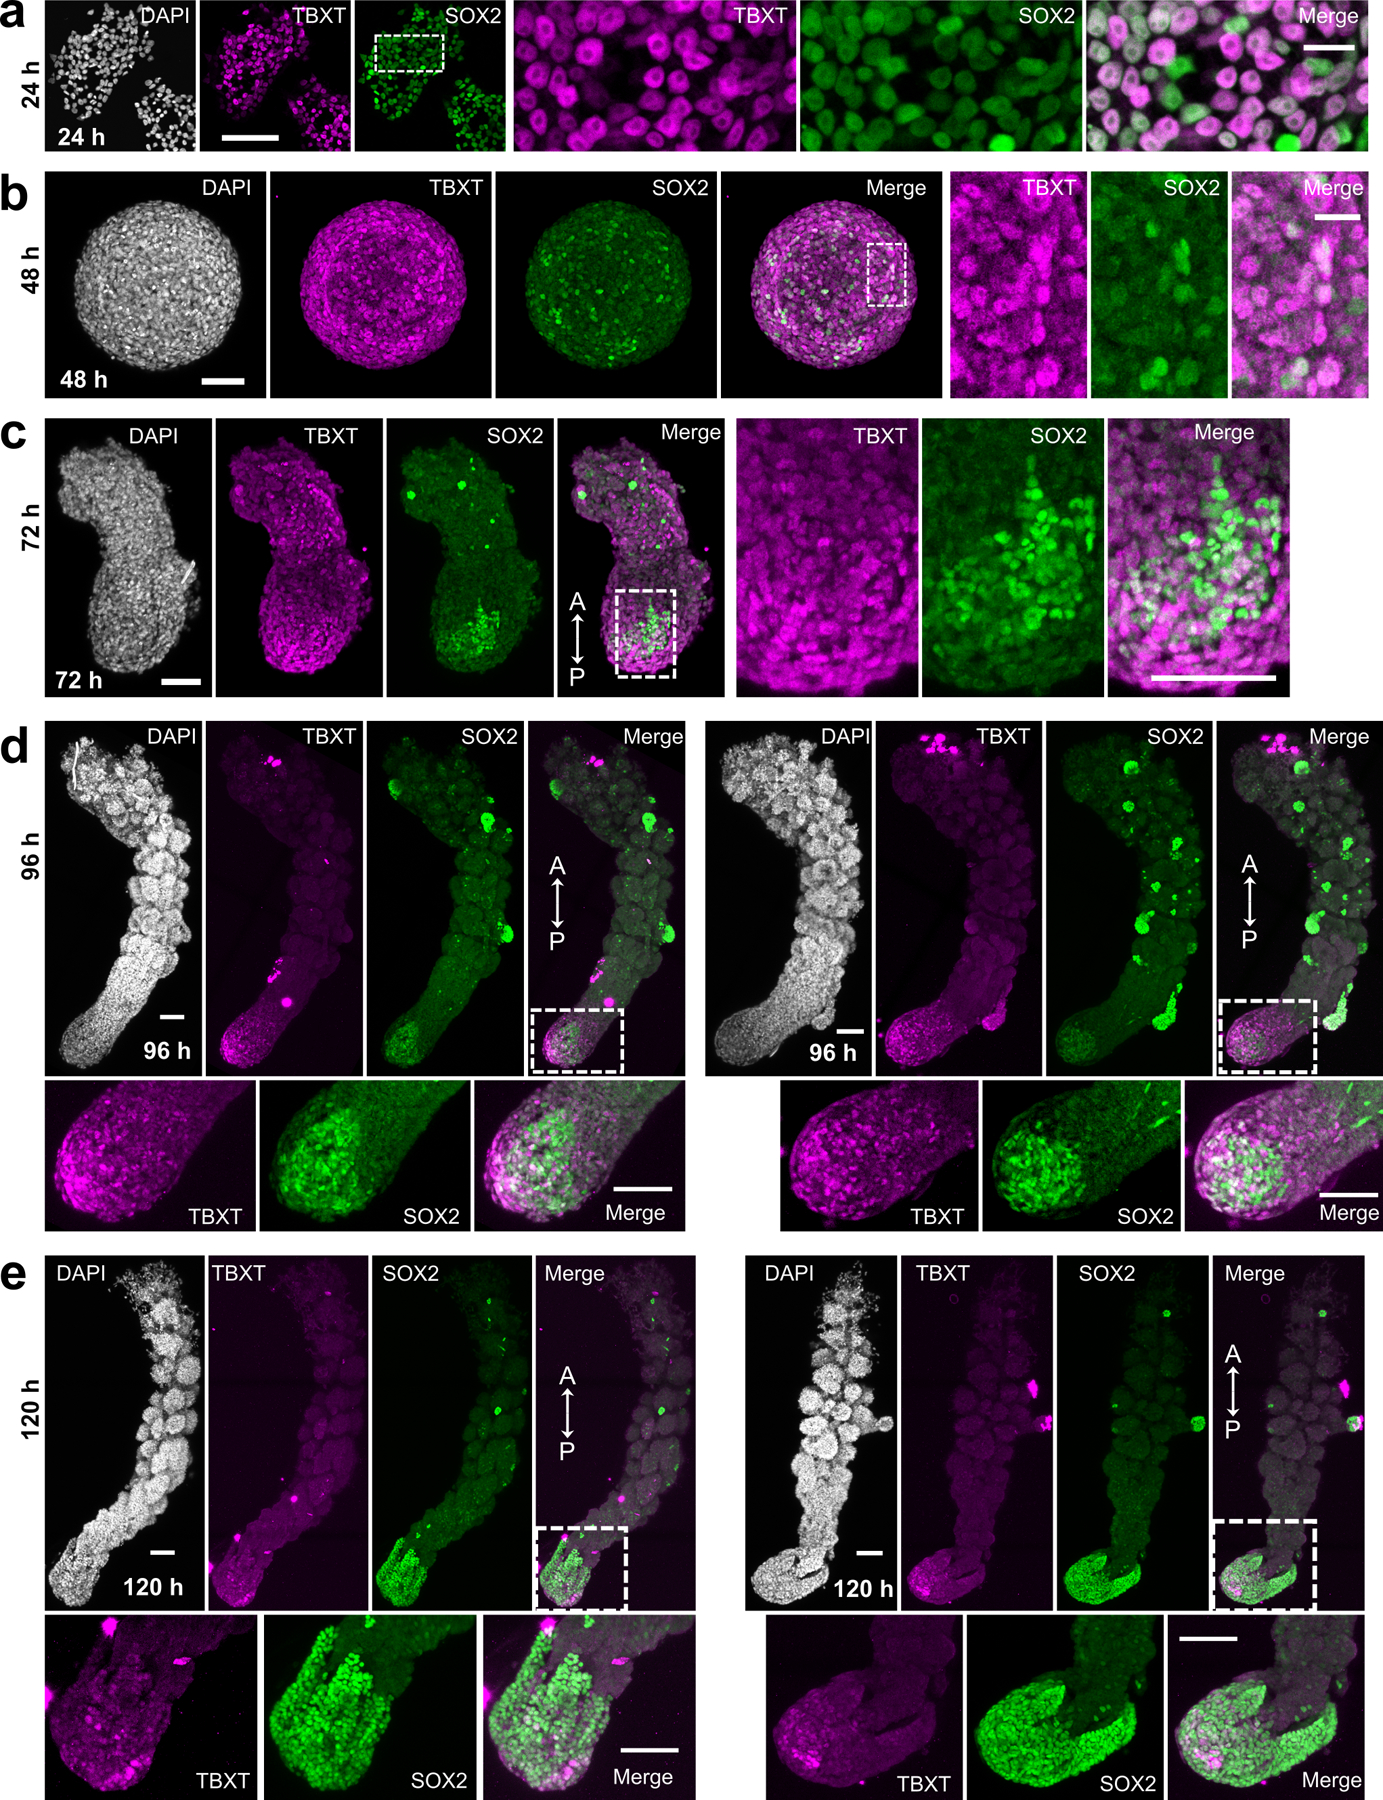
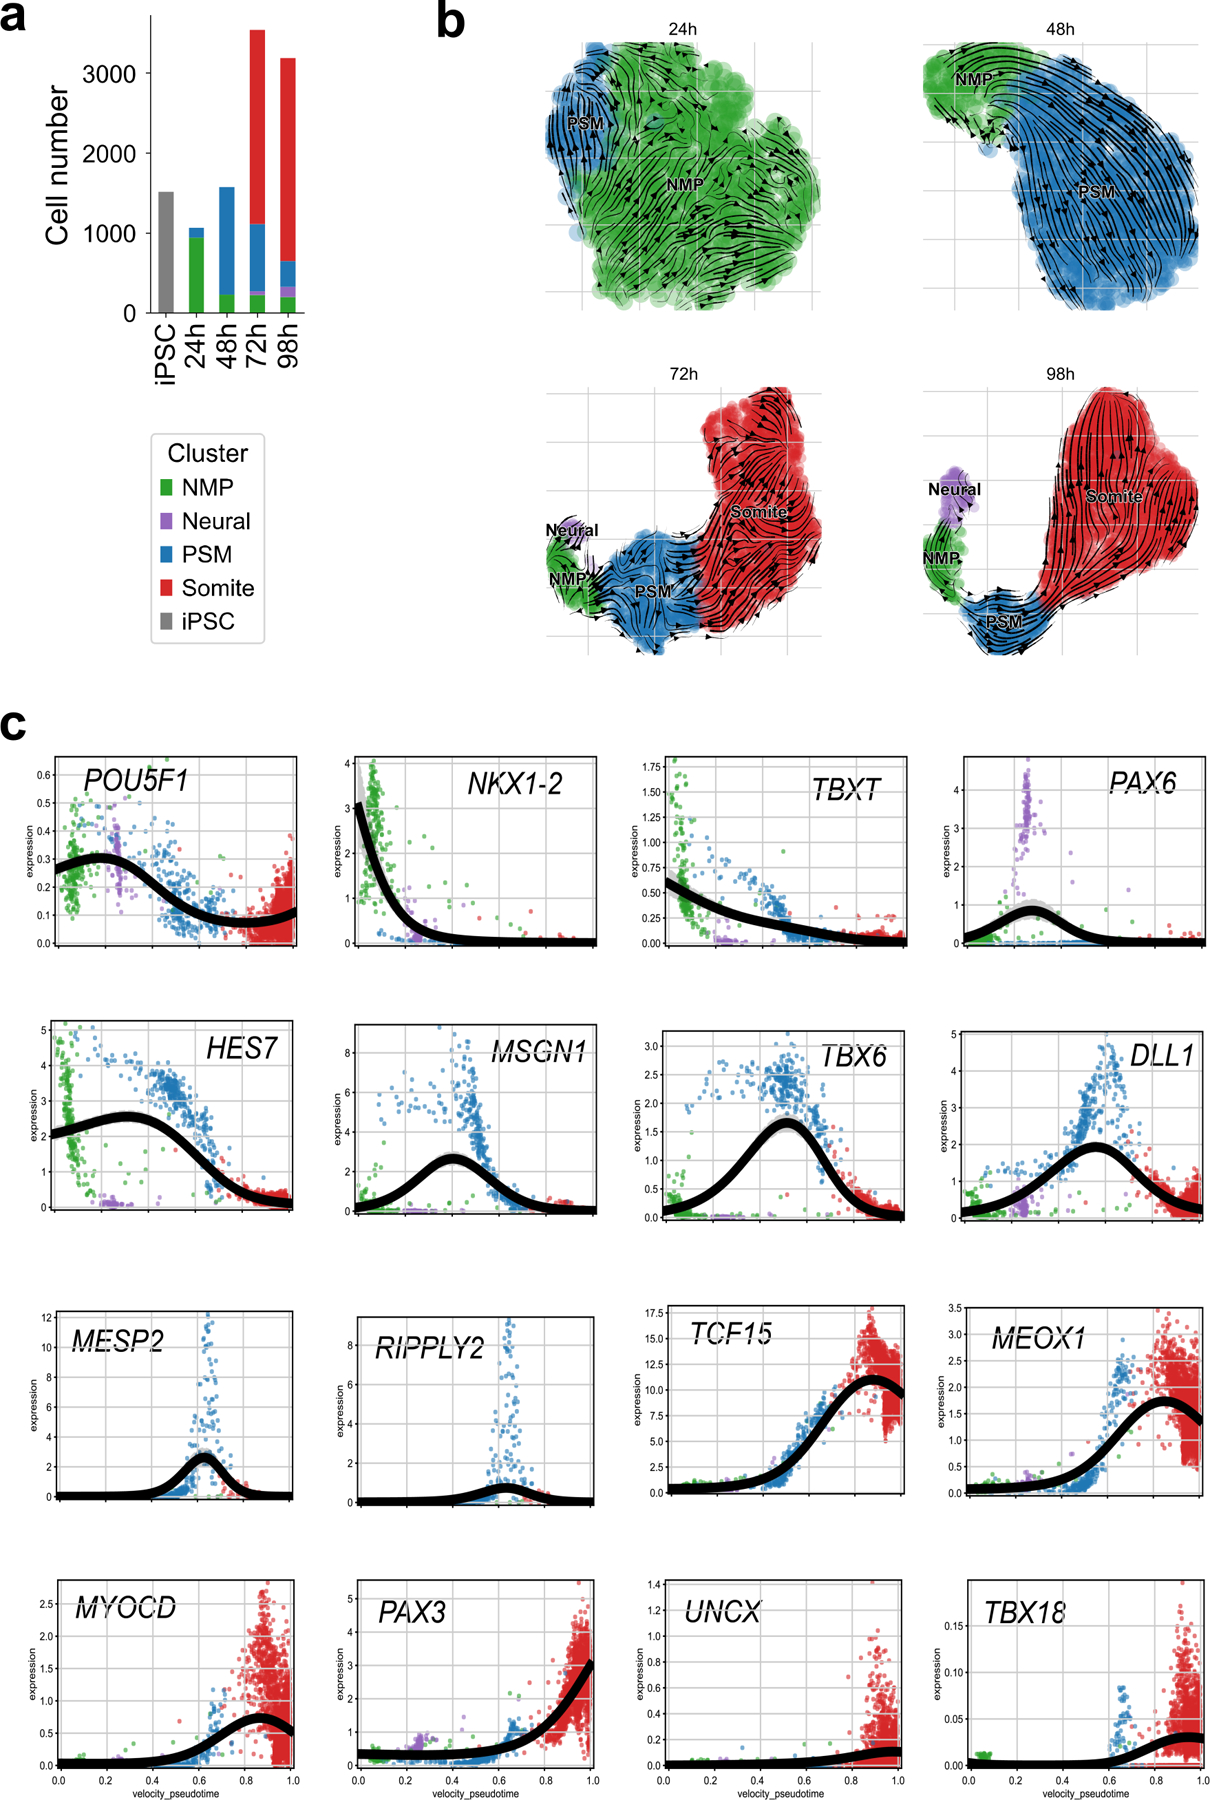
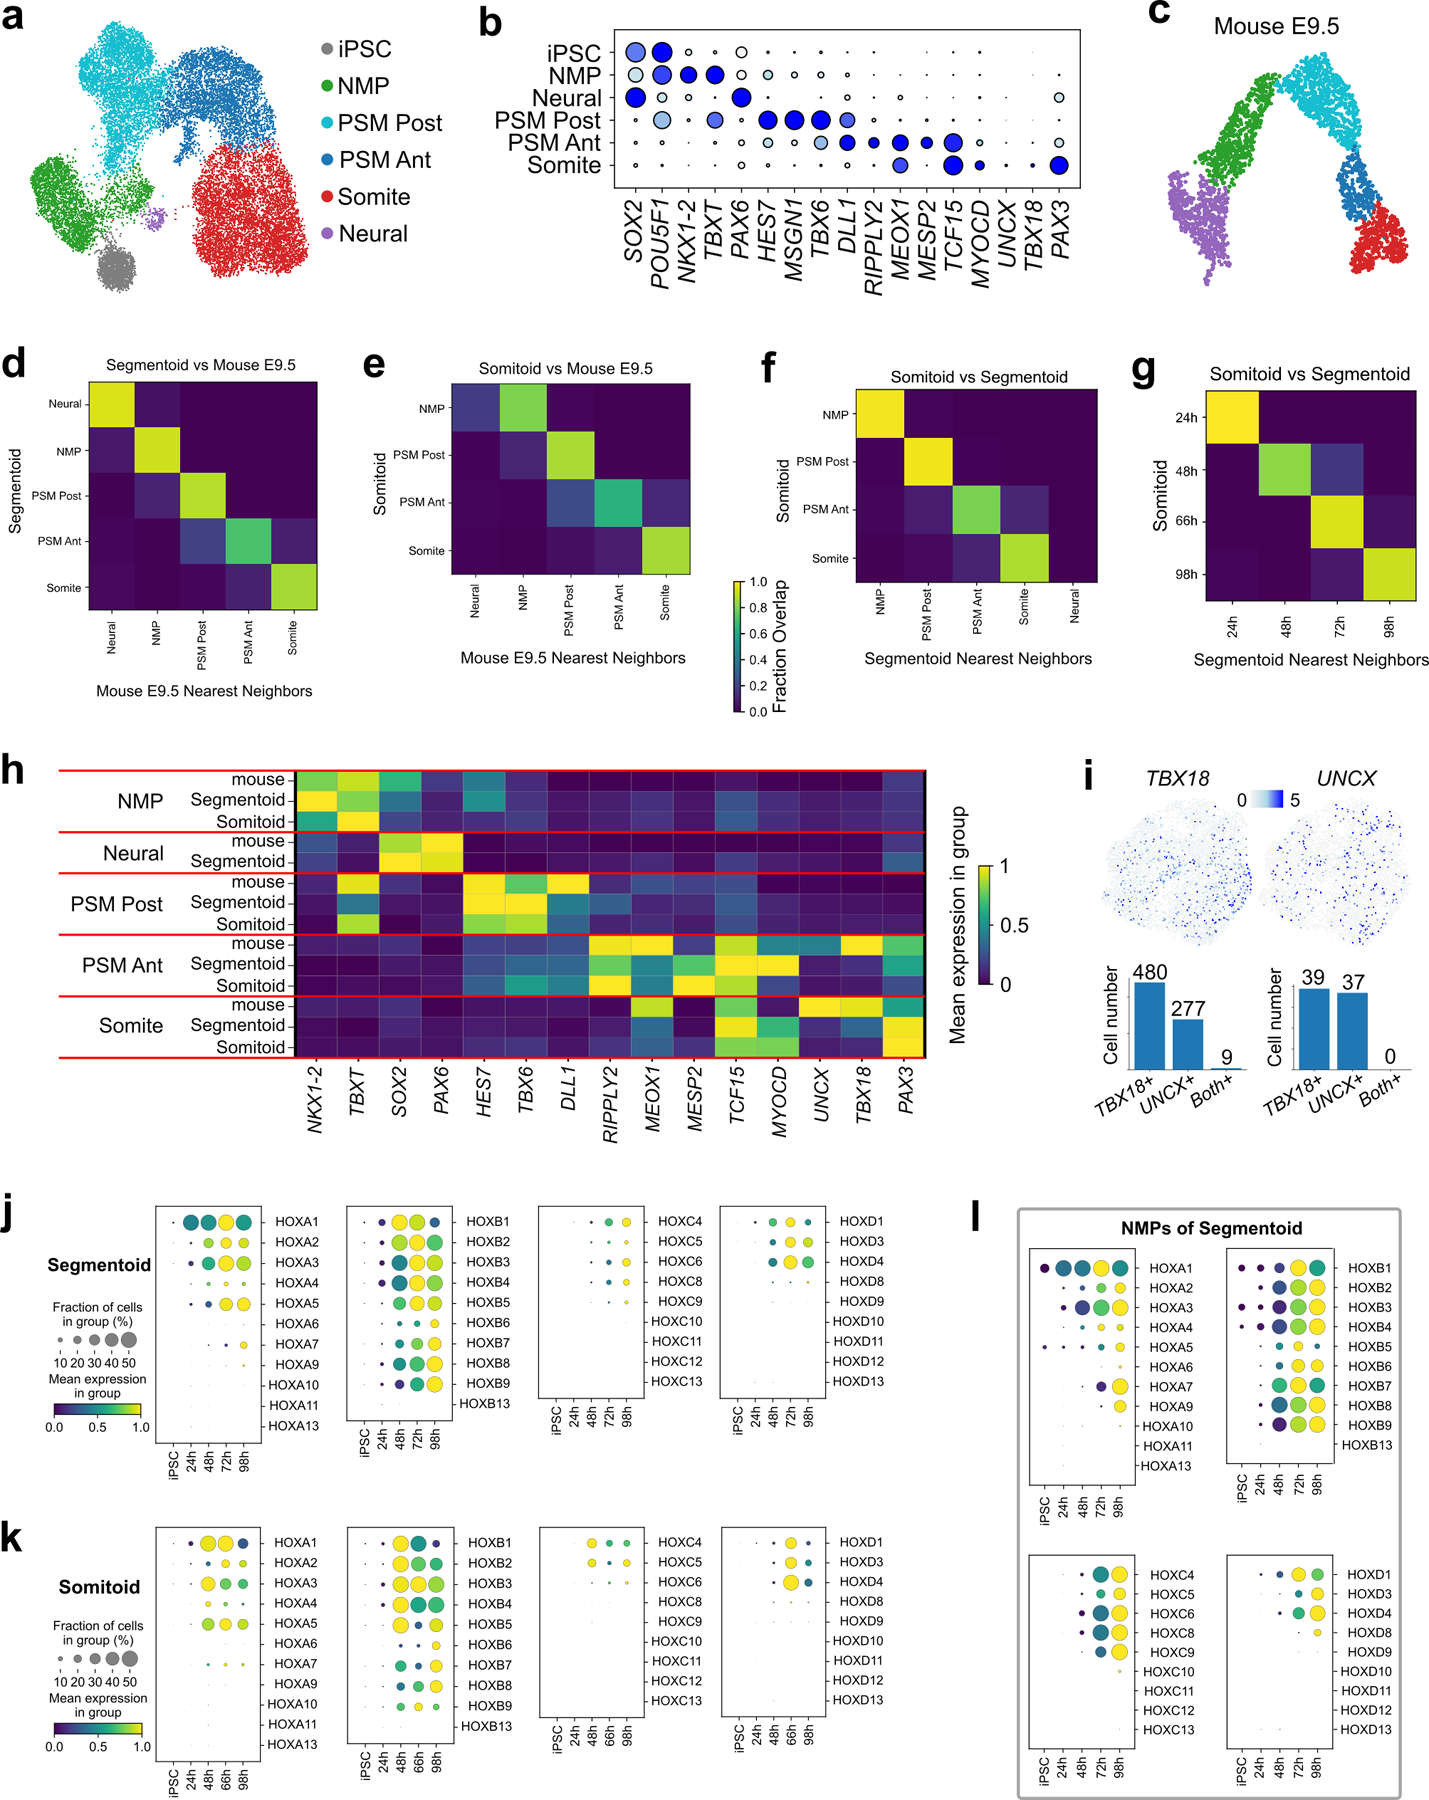
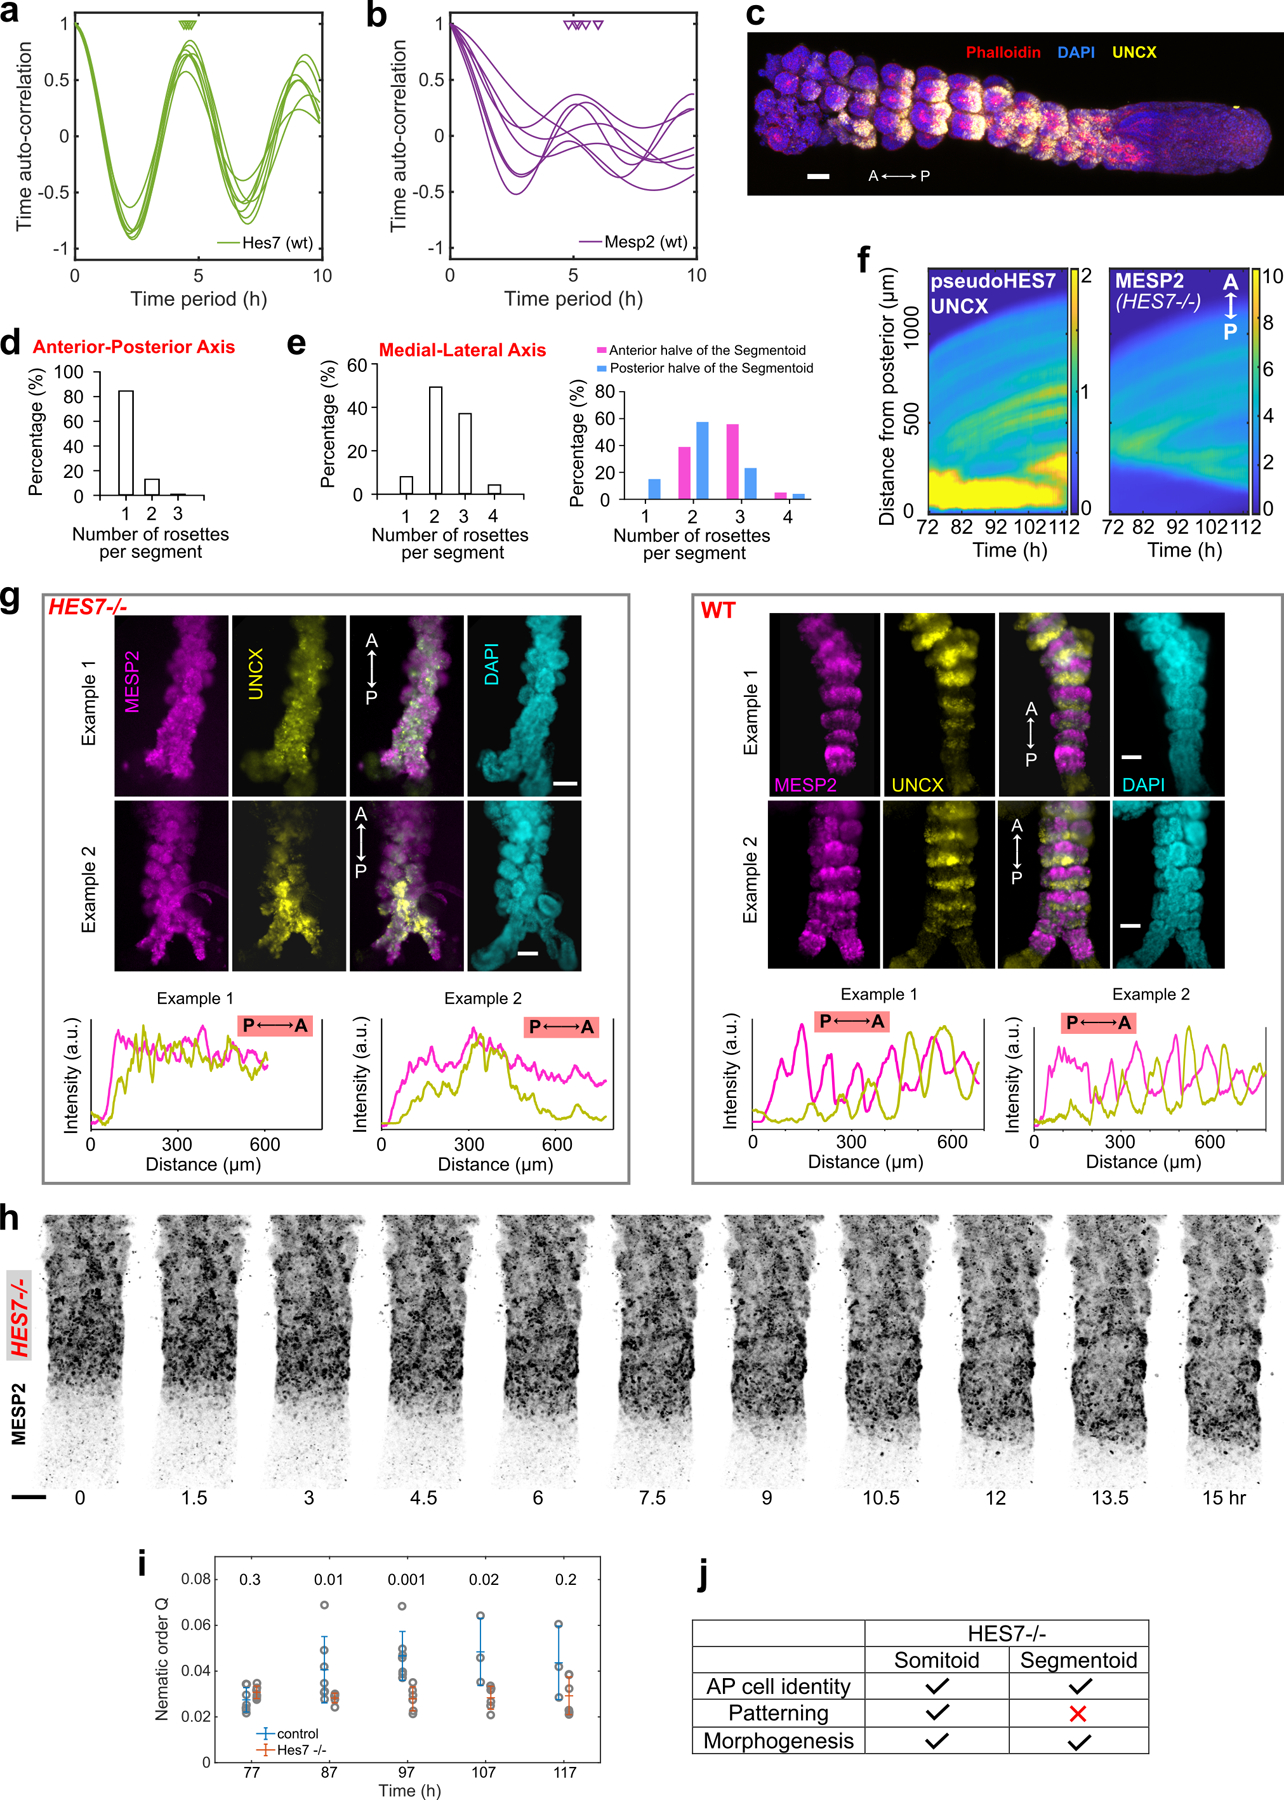
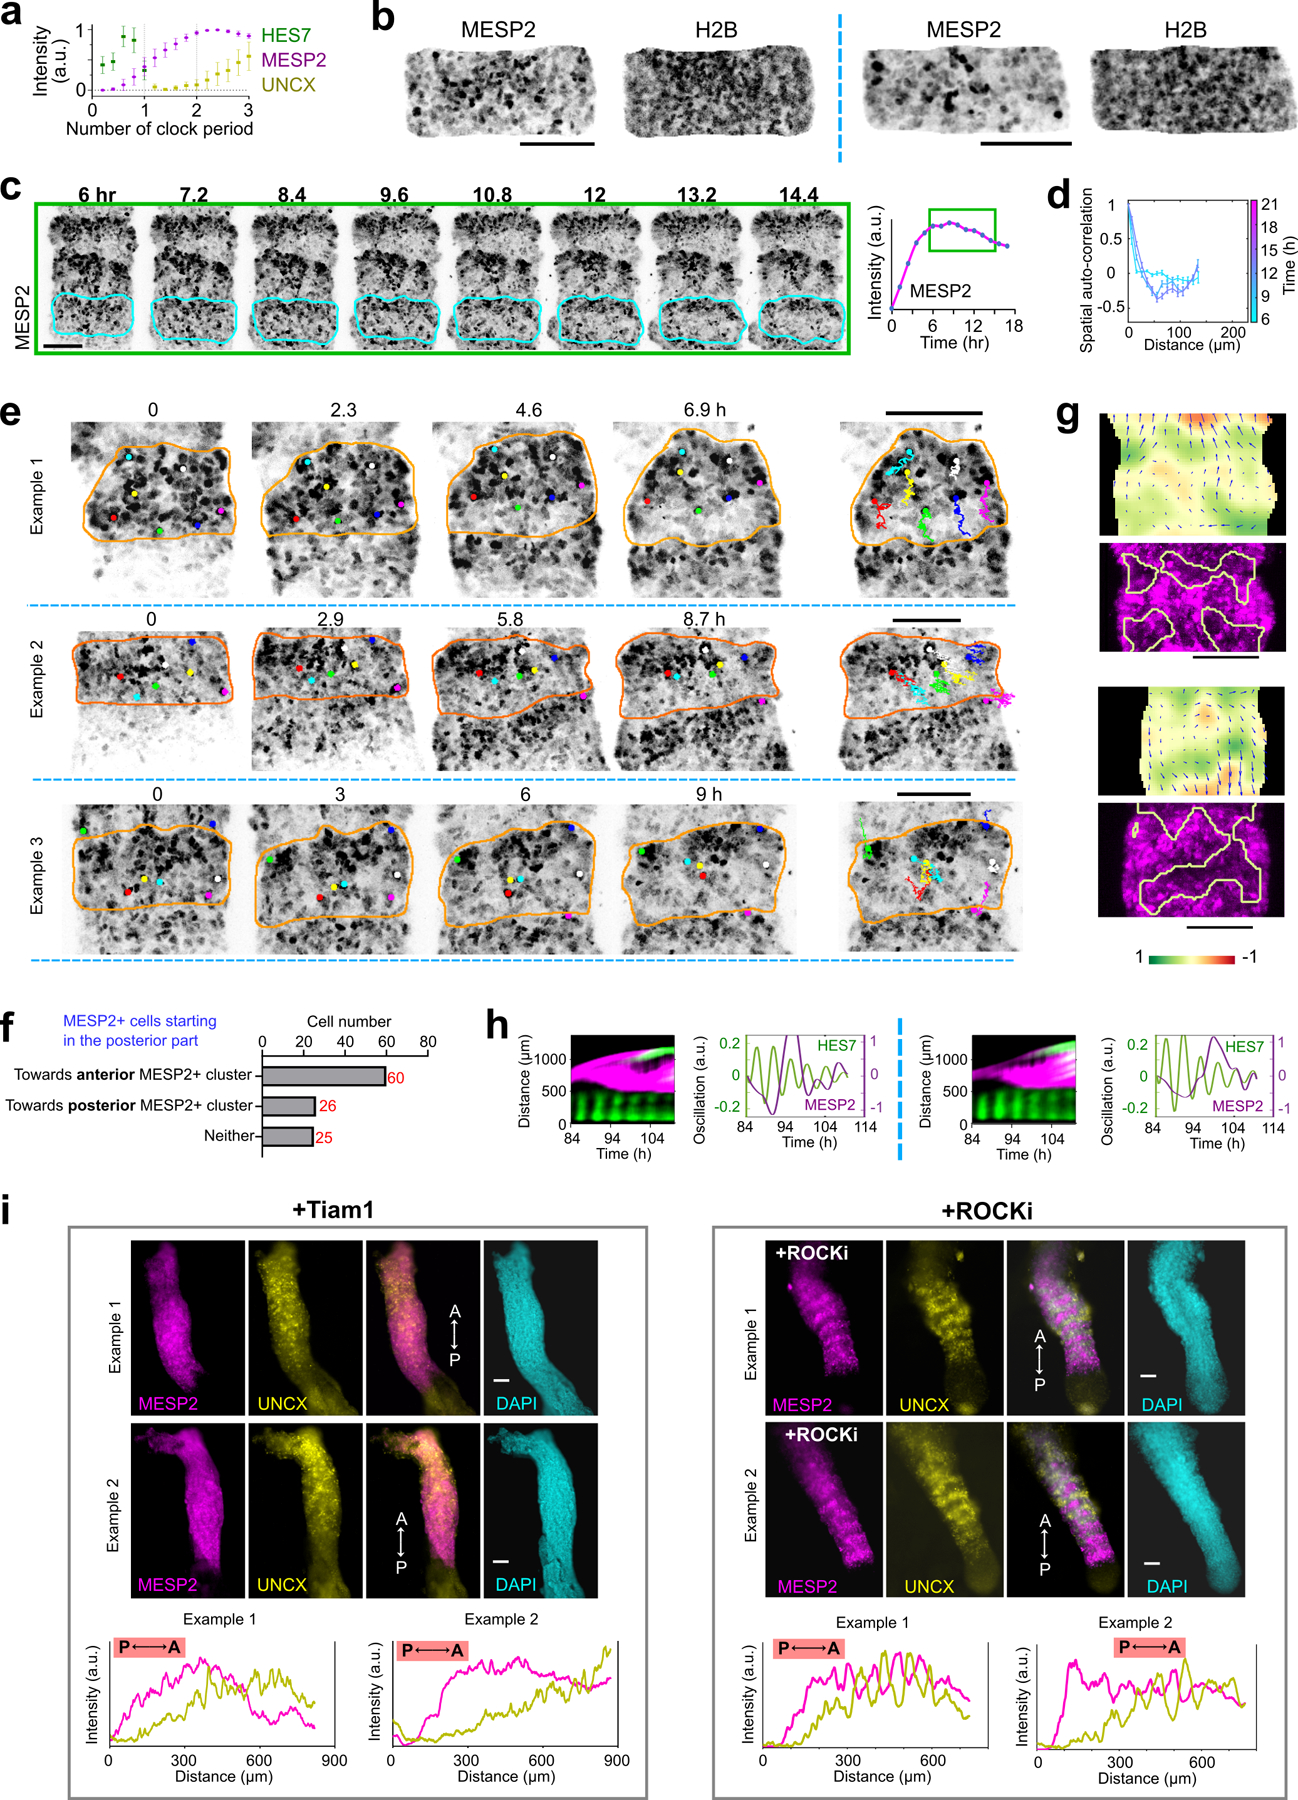
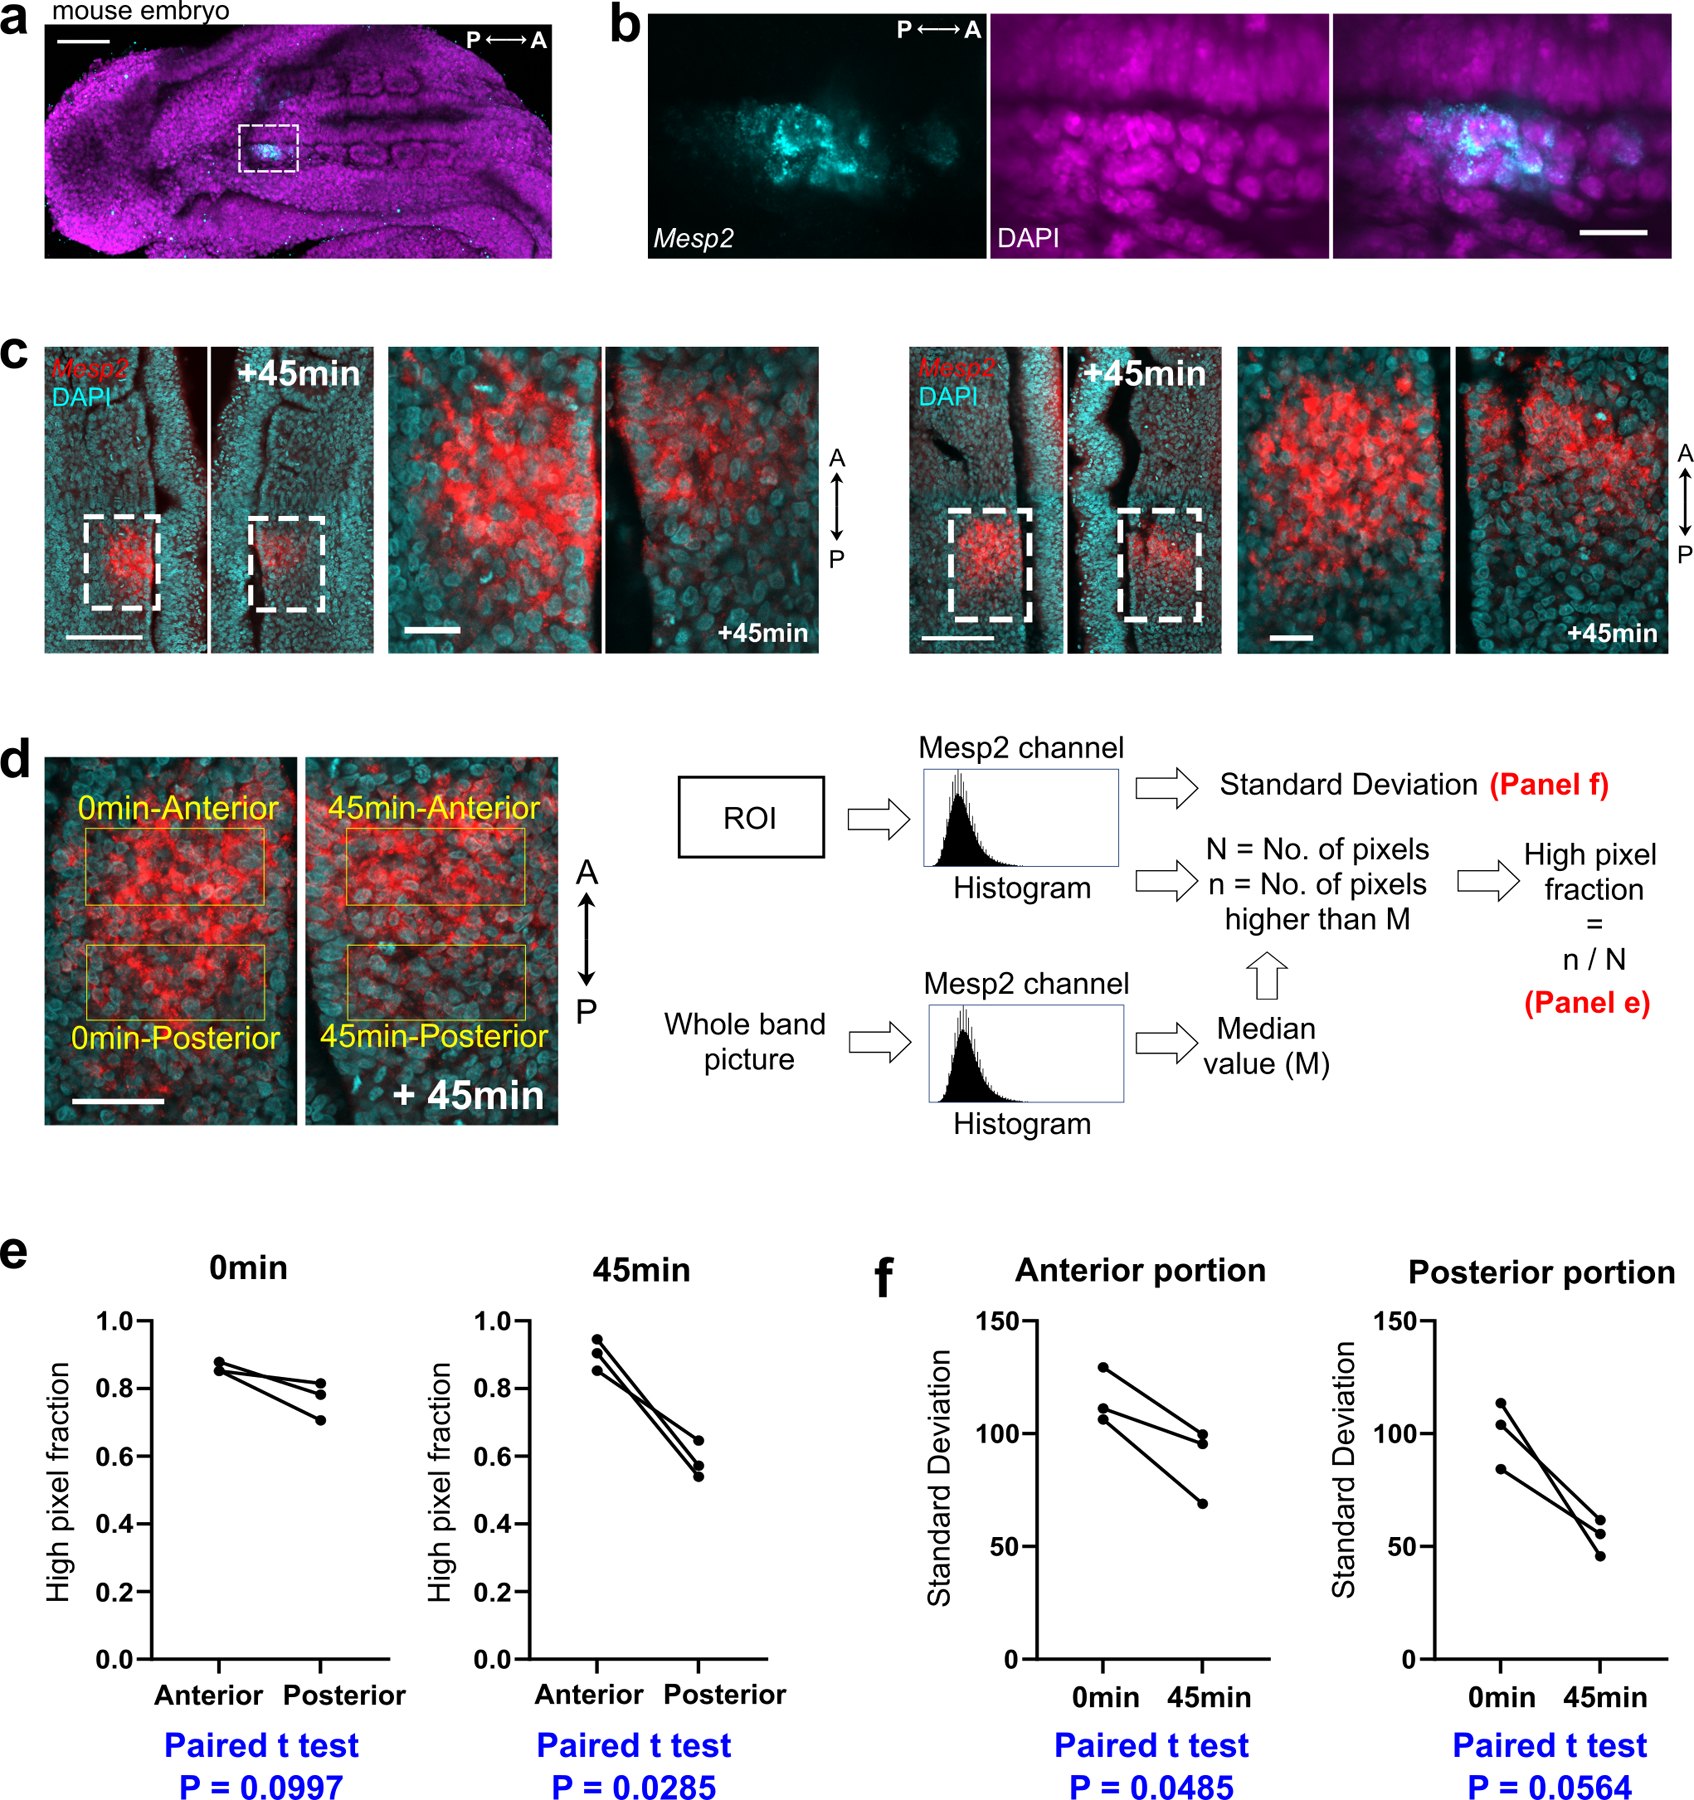
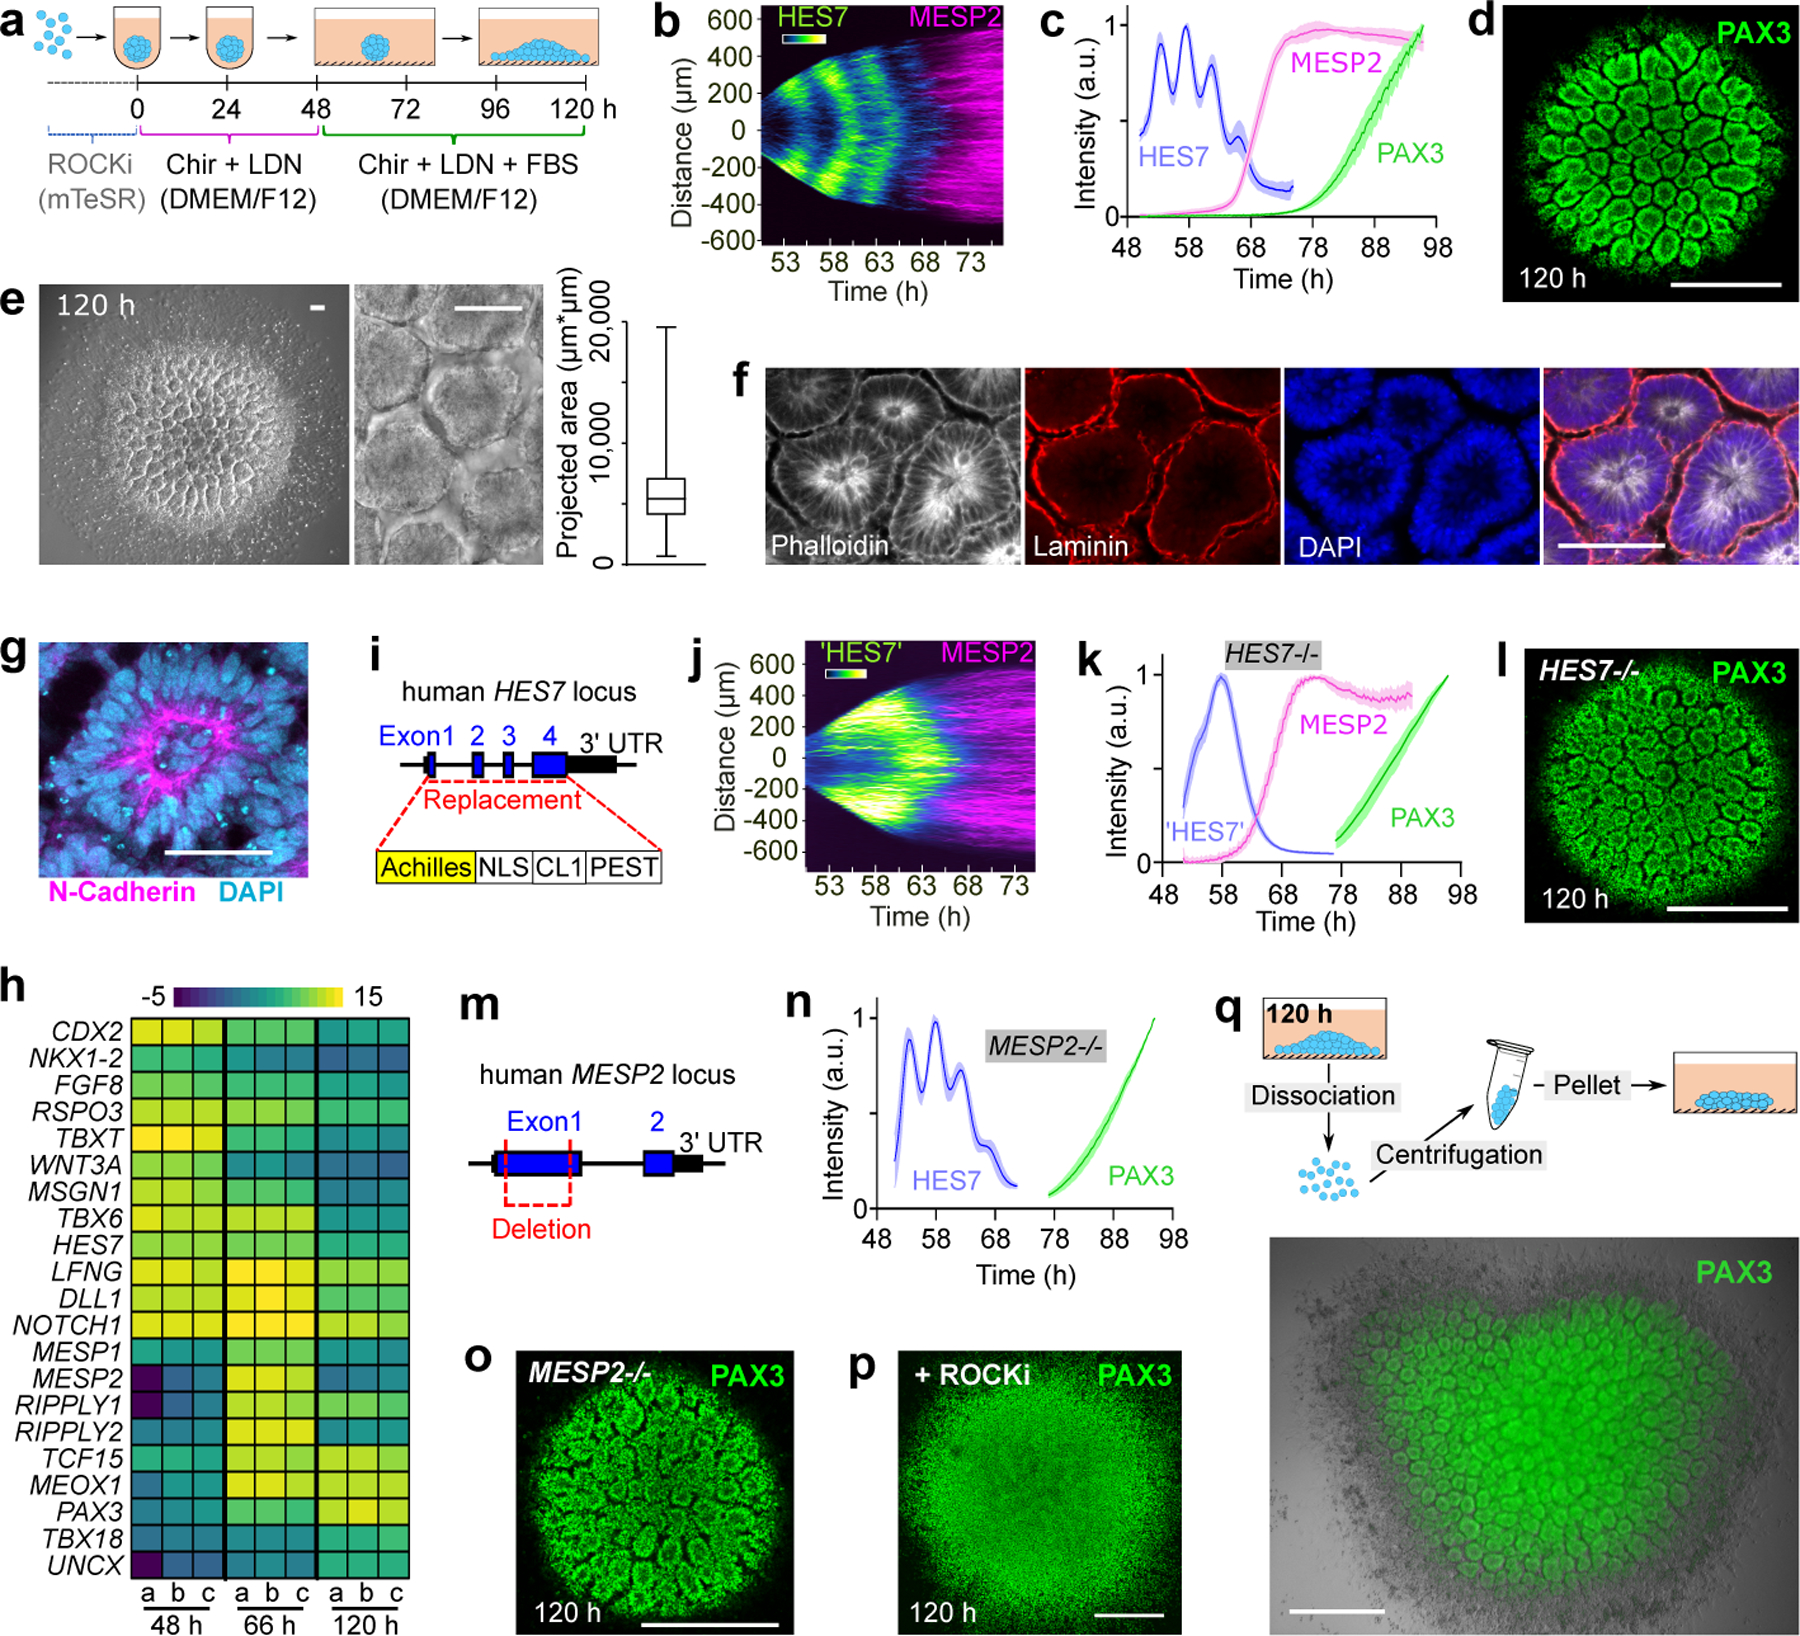
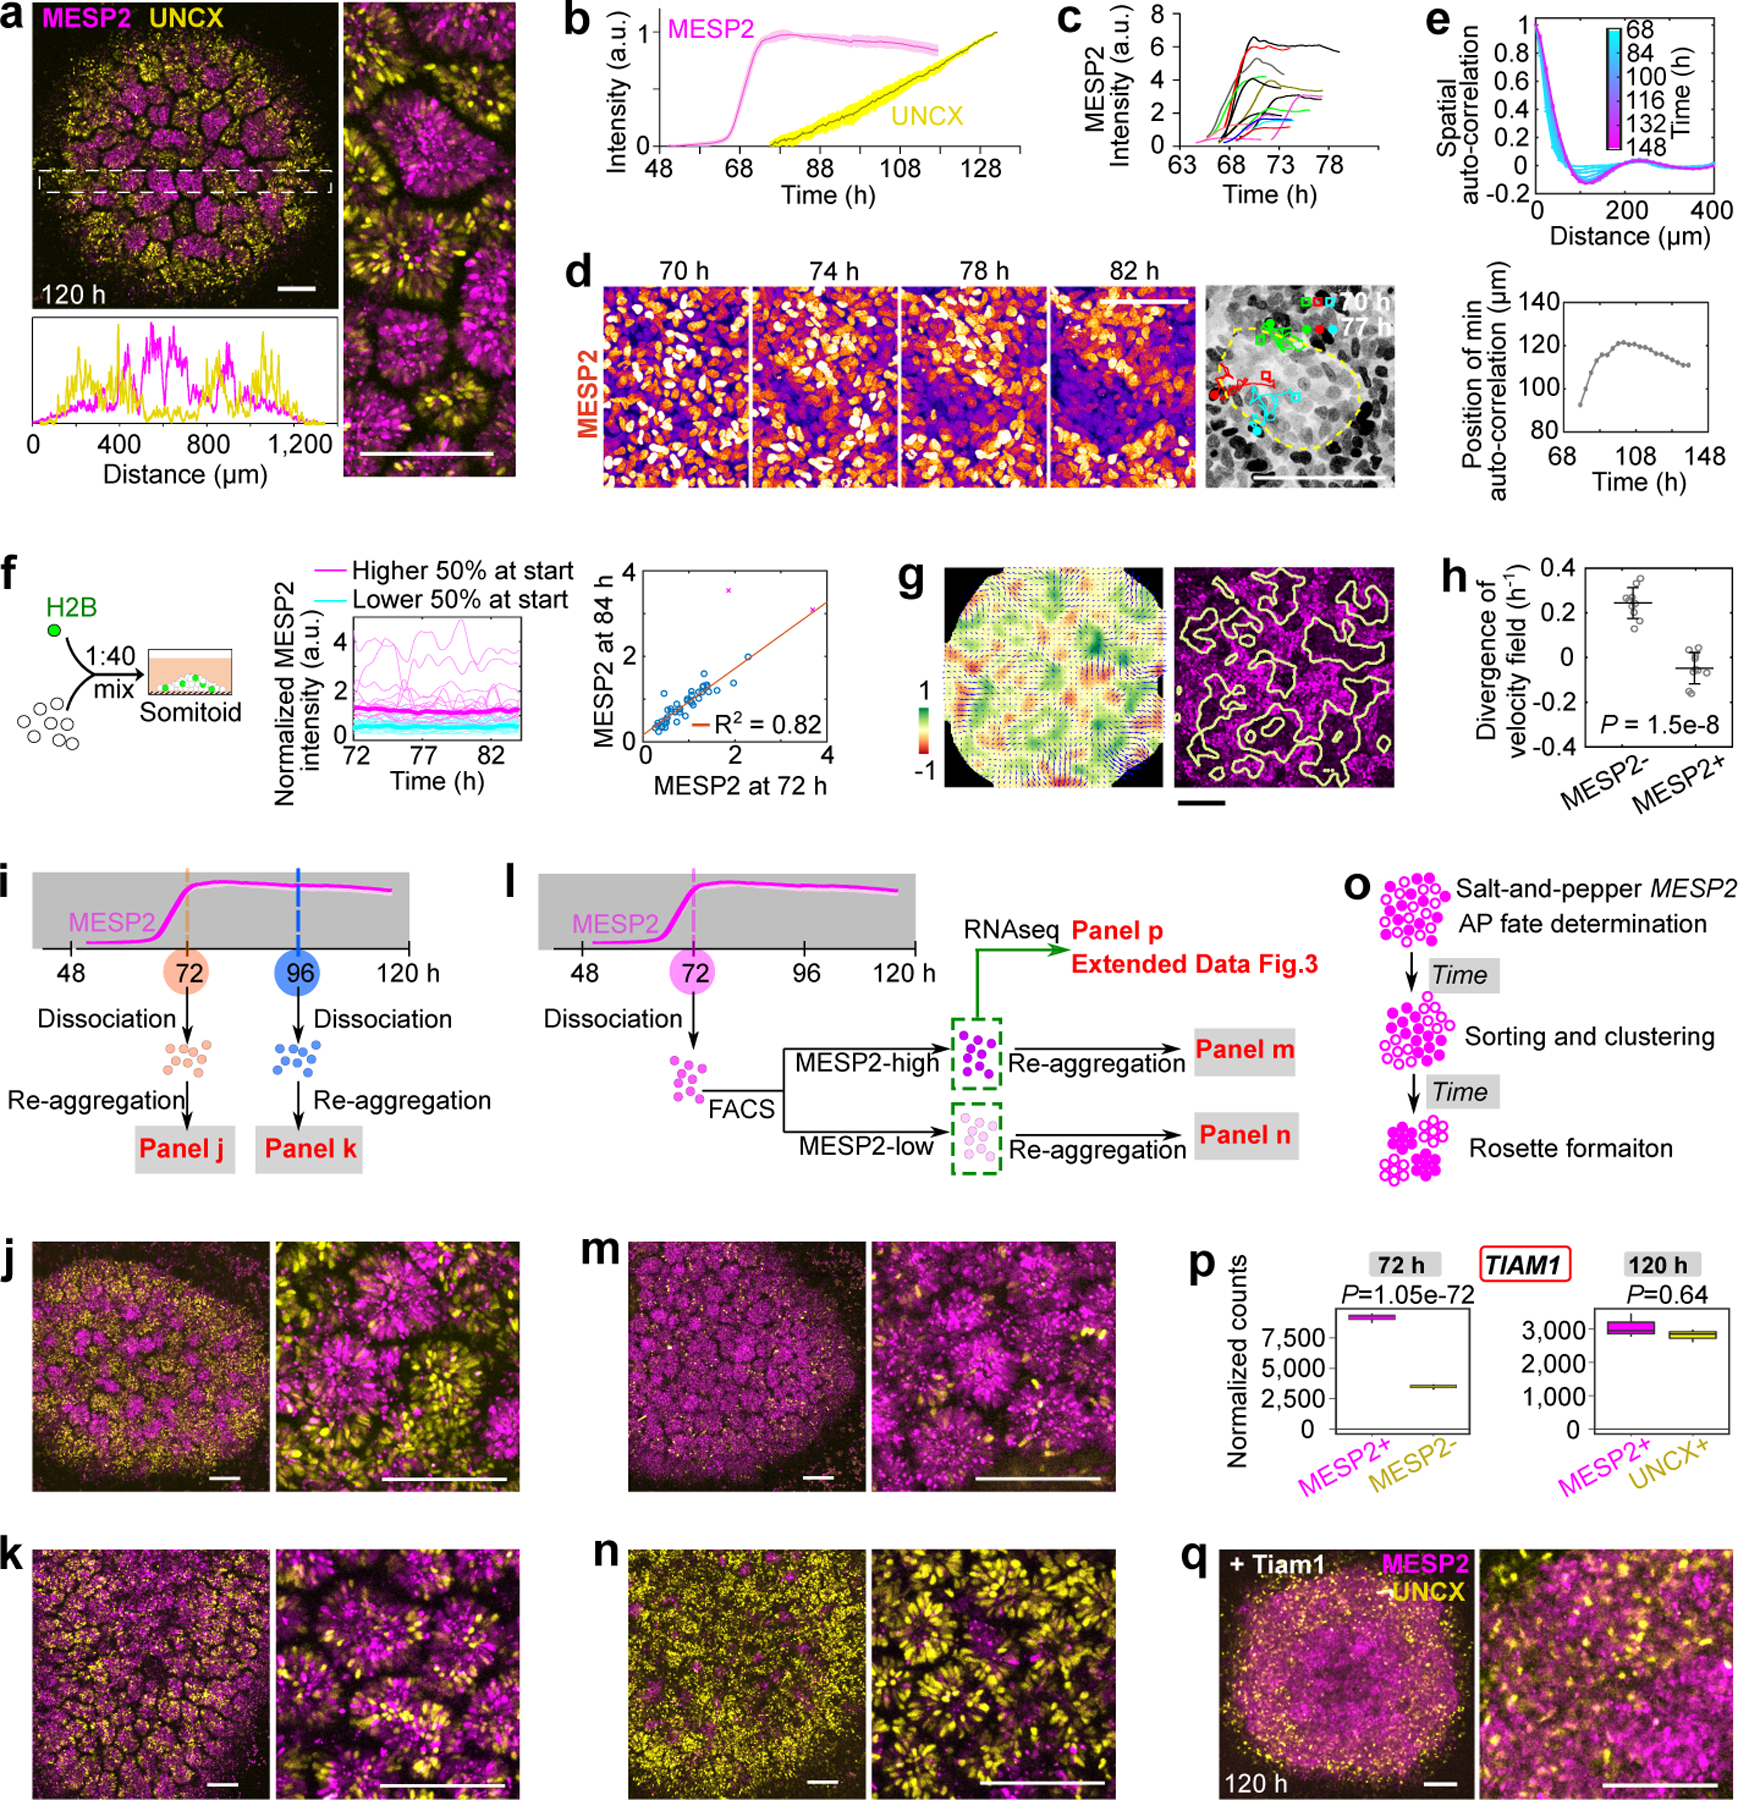
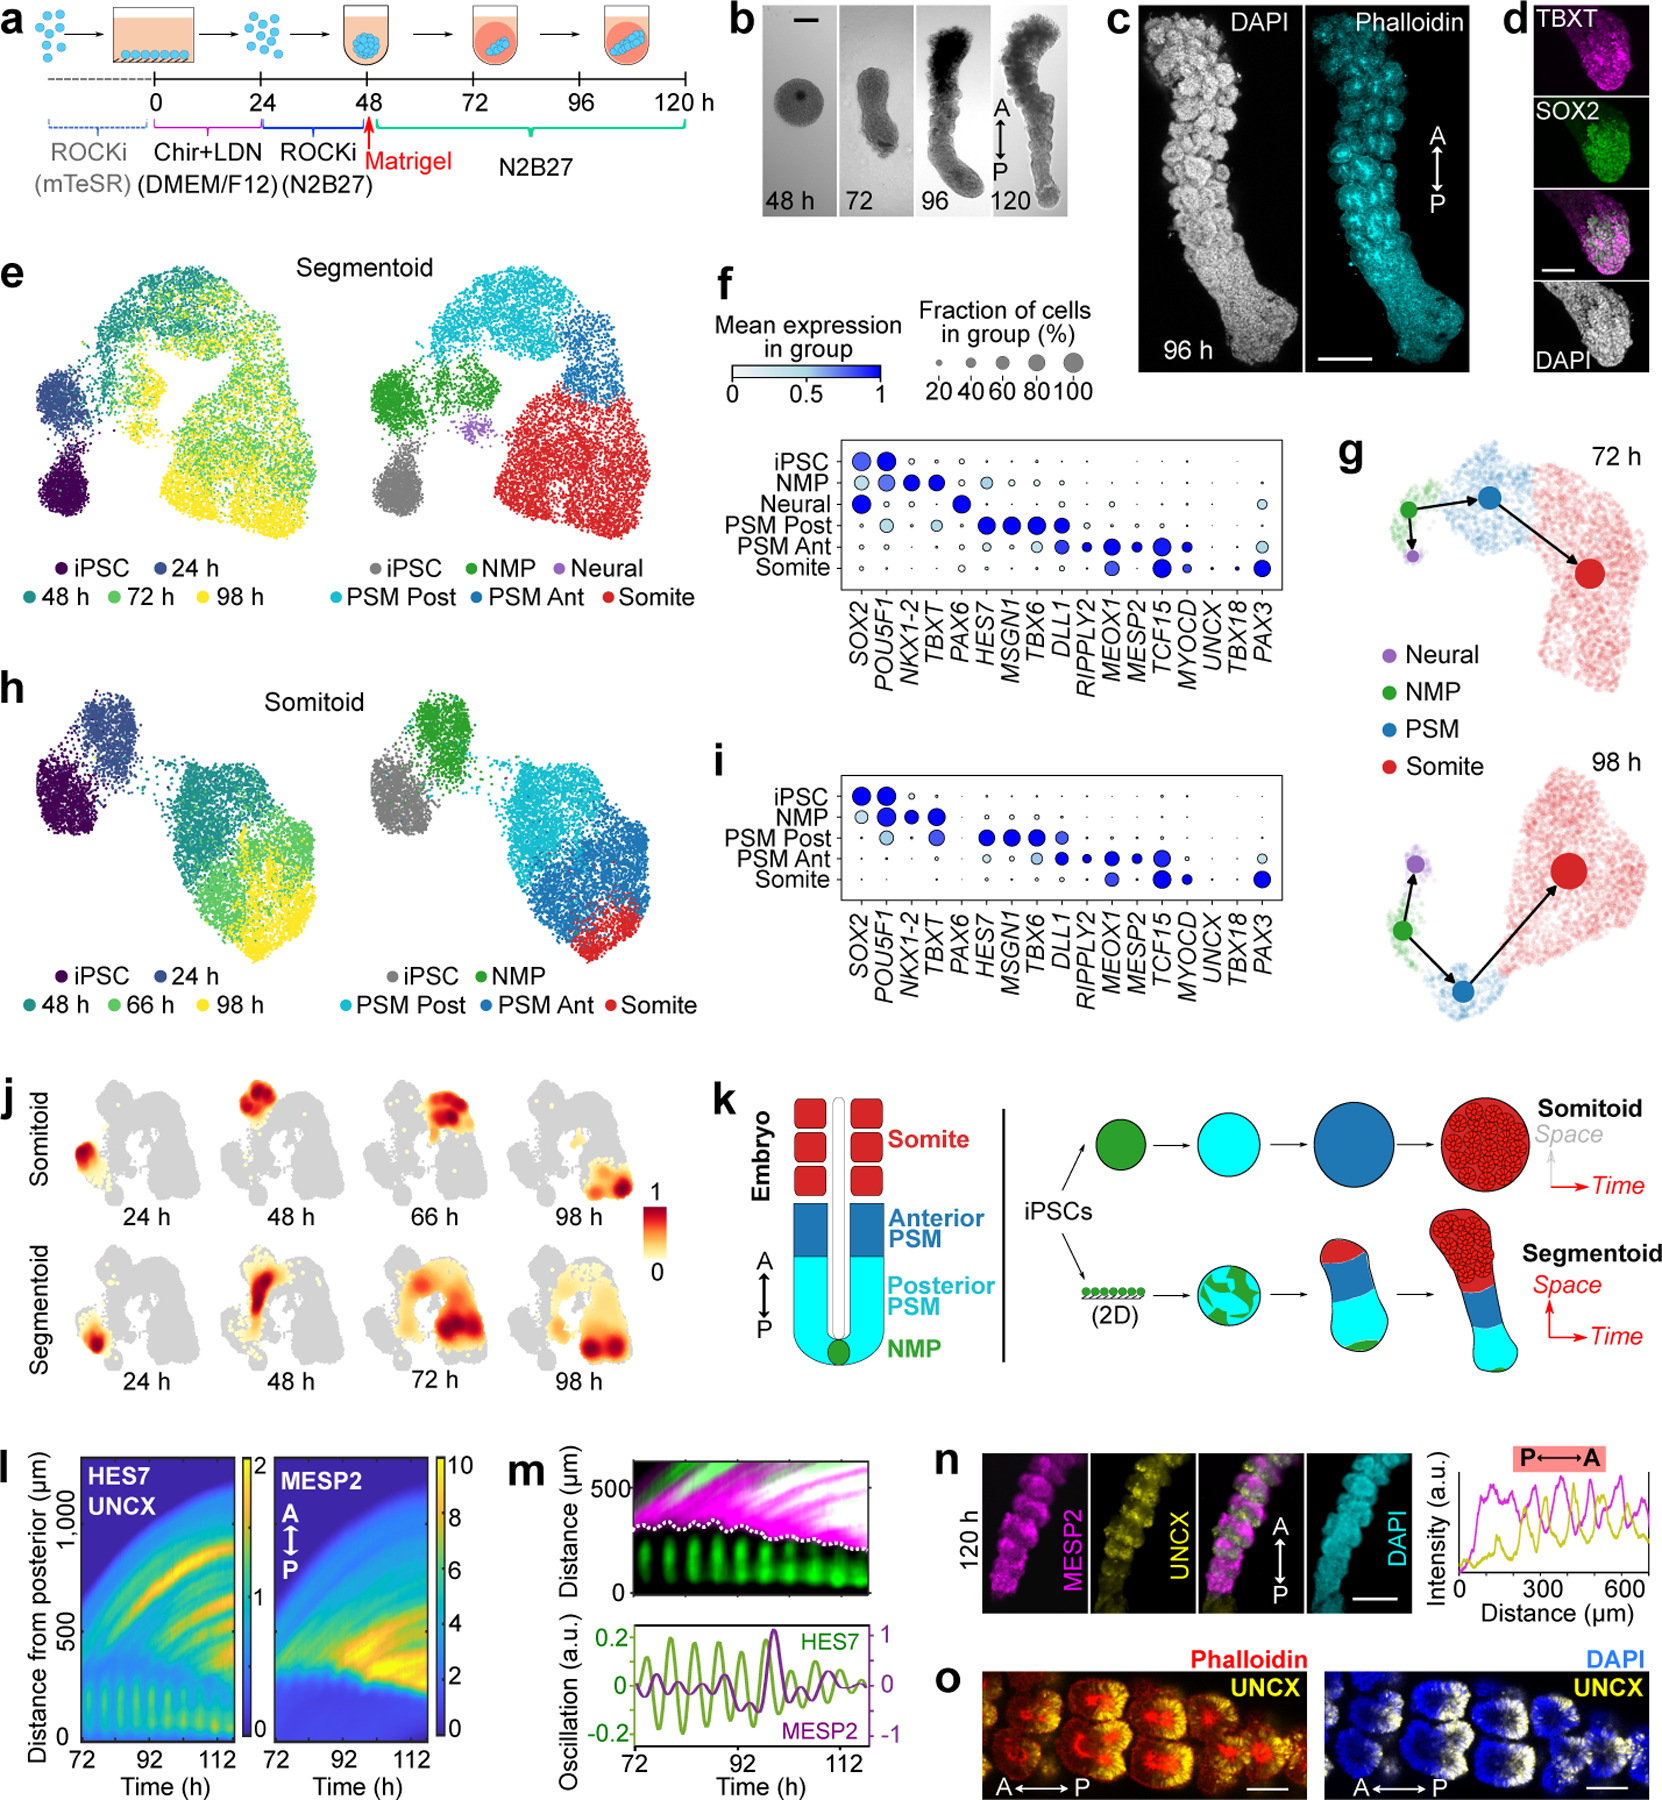
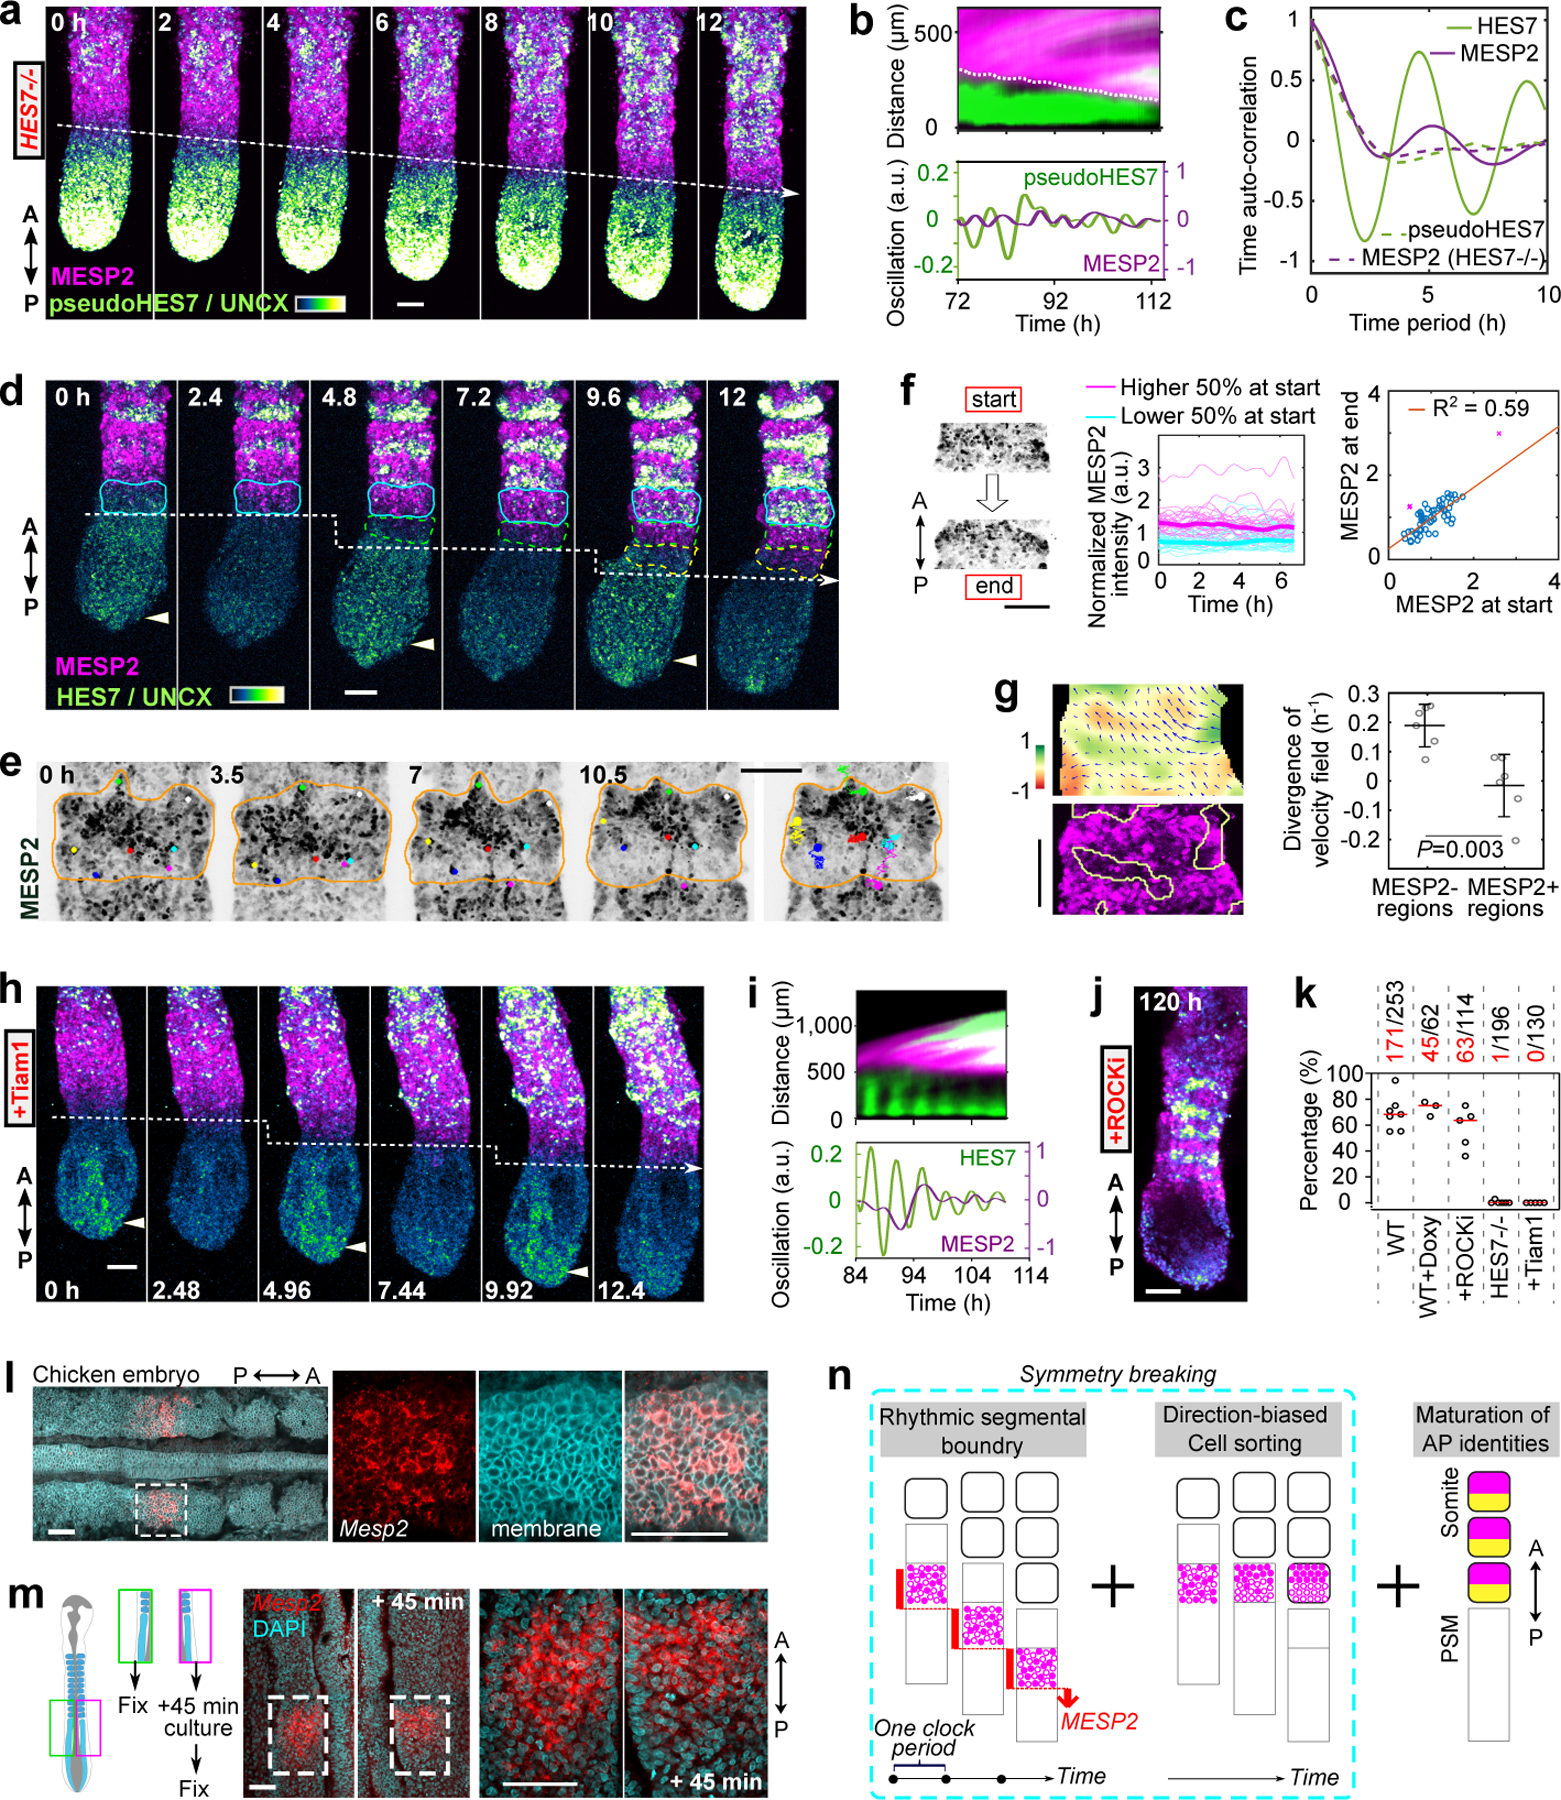
The vertebrate body displays a segmental organization that is most conspicuous in the periodic organization of the vertebral column and peripheral nerves. This metameric organization is first implemented when somites, which contain the precursors of skeletal muscles and vertebrae, are rhythmically generated from the presomitic mesoderm. Somites then become subdivided into anterior and posterior compartments that are essential for vertebral formation and segmental patterning of the peripheral nervous system1-4. How this key somitic subdivision is established remains poorly understood. Here we introduce three-dimensional culture systems of human pluripotent stem cells called somitoids and segmentoids, which recapitulate the formation of somite-like structures with anteroposterior identity. We identify a key function of the segmentation clock in converting temporal rhythmicity into the spatial regularity of anterior and posterior somitic compartments. We show that an initial 'salt and pepper' expression of the segmentation gene MESP2 in the newly formed segment is transformed into compartments of anterior and posterior identity through an active cell-sorting mechanism. Our research demonstrates that the major patterning modules that are involved in somitogenesis, including the clock and wavefront, anteroposterior polarity patterning and somite epithelialization, can be dissociated and operate independently in our in vitro systems. Together, we define a framework for the symmetry-breaking process that initiates somite polarity patterning. Our work provides a platform for decoding general principles of somitogenesis and advancing knowledge of human development.


Conflict of interest statement

Competing interests

The authors declare the following competing interests: O.P. is scientific founder of Anagenesis Biotechnologies. All other authors declare no competing interests.

Figures

Extended Data Fig.1
Extended Data Fig.1. Characterization of the Somitoid model.
a, Time lapse confocal images of H2B-mCherry in a spreading Somitoid. b, Illustration of the design of the HES7/MESP2 double-reporter cell line. c, Left, time-lapse confocal images of HES7 wave; Right, temporal profiles of HES7 reporter in two different regions indicated by the blue and orange boxes. d, Left, box plots of projected areas of all rosettes in individual Somitoids. Right, plot of median rosette area of each Somitoid (n=20 Somitoids). Red bars indicate median with interquartile range. e, Correlation analysis (n=20 Somitoids; two-sided) between the entire Somitoid area and median rosette area (left); between the entire Somitoid area and total rosette number (right). f, Shape descriptors of individual rosettes (top) and entire Somitoids (bottom). n=1,957 rosettes from 20 Somitoids. g, h, Confocal slices from the bottom (z=0 µm) to the top of a rosette in 120 h Somitoid stained with Laminin (g) and N-Cadherin (h) (n=2 Somitoids). i, Representative images of a Somitoid cultured on gelatin (n=5 Somitoids) or laminin (n=5 Somitoids) coated surface, stained with Laminin. j, 3D reconstruction image of a Somitoid cultured in suspension (left; n=2 Somitoids) and a confocal section (right), stained with Laminin. k, Principal components analysis using the same RNA sequencing datasets shown in Fig. 1h. l, Confocal images of 120 h PAX3-reporting Somitoids treated with 5 µM Blebbistatin (left) and control (right). In box-and-whiskers plots, the middle hinge corresponds to median, the lower and upper hinges correspond to the first and third quartiles, respectively, and the lower and upper whiskers correspond to the minimum and maximum, respectively. Scale bars represent 500 µm (a, c, i, l), 50 µm (g, h) and 100 µm (j).
Extended Data Fig.2
Extended Data Fig.2. Antero-Posterior patterning in Somitoids.
a, Illustration of the design of the HES7/MESP2/UNCX triple-reporter cell line. b, Ratio of mean mCherry or YFP intensities in the center circle vs in the big circle (n=8 Somitoids and the bars indicate median). c, Normalized RNA counts of selected polarity genes in cell fractions separated by flow cytometry, as measured by RNA sequencing (n=3 independent experiments, 96 Somitoids in each n). Cells with top 10% mCherry fluorescence are shown on the left (magenta) and top 10% YFP fluorescence on the right (yellow). All four genes were identified as differentially expressed genes by DESeq2 using the Wald test (two-sided). d, Temporal plot of HES7 reporter (mean±s.d., n=3 Somitoids) and images of an UNCX and MESP2 reporting Somitoid treated with 50 µM DAPT added at 48 h. e, Wide-field images of PAX3-reporting Somitoids treated with 50 µM DAPT (left) since 48 h and control (right). f, Maximum-z-projection confocal images of UNCX and MESP2 reporting Somitoids treated with 10 µM ROCKi (left) or 5 µM Blebbistatin (right) since 48 h. g, Left, percentage of UNCX-positive cells characterized by flow cytometry in 120 h WT (n=6 experiments), HES7-null (n=6 experiments), and MESP2-null (n=5 experiments) Somitoids; Data are represented as mean±s.d., one-way ANOVA, compared with WT, P = 0.89 (HES7-null); 2.49e-10 (MESP2-null). Right, images of MESP2 and UNCX reporters in HES7-null Somitoids, and UNCX reporter in MESP2-null Somitoids. h, Histograms of flow cytometry analysis of UNCX-YFP in 120 h Somitoids (control, WT, HES7-null, and MESP2-null cell lines) with debris and doublets removed. Control is the parental NCRM1 cell line. Fractions on the right side of the red dotted line in the histograms are defined as YFP-positive. i, Scattered plot (top) and histogram (bottom) of flow cytometry analysis on MESP2-mCherry Somitoids at 72 h with debris and doublets removed. j, Time-lapse images of MESP2 reporter in a Somitoid. k, Time-lapse maximum-z-projection confocal images of H2B-GFP in the same region of a Somitoid as in Fig.2d. l, Cell tracks of MESP2-high cells overlayed on images of MESP2 reporter. The orange outlines represent the forming MESP2-low regions. m, Spatial auto-correlation (sole MESP2 signal, sole UNCX signal or them combined together) once rosettes are formed (representative example from n=3 Somitoids). n, Additional example of spatial auto-correlation analysis and abscissa-position of the auto-correlation trough (inset) of MESP2/UNCX double reporting Somitoid over time. o, Temporal plot (mean±95%CI) of mean squared displacement (n=3,422 tracks from 2 Somitoids). p, Additional example of normalized temporal profiles of MESP2 reporter in individual cells (top; n=52 cells from one Somitoid), and correlation analysis of MESP2 intensities at 72 h and 84 h (bottom; F-test, one-sided, P = 4.67e-14 after removing 3 outliers identified by calculating Mahalanobis distance, as explained in Methods, marked by magenta cross). Temporal profiles are colored based on relative MESP2 intensity among tracked cells at 72 h, with higher 50% in magenta and lower 50% in cyan throughout the time window. q, Surrounding MESP2 intensity (Methods) of tracked cells at 72 h and 84 h (n=98 cells from two Somitoids; unpaired two-tailed t-test). Cells at both time points are grouped based on relative MESP2 intensity at 72 h, with lower 50% on the left (cyan) and higher 50% on the right (magenta). r, Left, temporal profile of MESP2 intensity in cells starting in a correct (orange) or wrong (green) region (Method). Right, end-time-point MESP2 intensity of cells with correct or wrong start. n=98 cells from two Somitoids; unpaired two-tailed t-test. s, Left, temporal profile of displacement in cells starting in a correct (orange) or wrong (green) region (Method). Right, end-time-point displacement of cells with correct or wrong start. n=98 cells from two Somitoids; unpaired two-tailed t-test. t, Velocity field (arrows) and the corresponding divergence (heatmap) of Particle Image Velocimetry analysis (left) on an additional Somitoid and regions of positive divergence overlayed on the MESP2 reporter image (right; yellow outlines). u, Summary of MESP2 expression and pattern formation processes in the timeline of the Somitoid differentiation. v, Quantification of UNCX reporter in MESP2-high (n=8 re-aggregates from 3 experiments) and MESP2-low (n=6 re-aggregates from 3 experiments) re-aggregates in Fig.2l–n, paired two-sided t-test. In all box and whisker plots, the center indicates the median, the upper bound indicates 75th percentile, and the lower bound indicates 25th percentile. The maxima and minima of the whiskers represent the most extreme non-outlier data points. The outliers are defined as data points greater than the upper bound or smaller than the lower bound by more than 1.5 times the interquartile range. Scale bars represent 500 µm (b, d, f, g, j), 200 µm (e, t), and 100 µm (k, l).
Extended Data Fig.3
Extended Data Fig.3. Differential gene expression during cell sorting and perturbations.
a, Expression fold change plots of selected adhesion proteins between MESP2-low vs MESP2-high cells at 72 h, or between MESP2-high vs UNCX cells at 120 h (n=3 independent experiments for each time point, with 96 Somitoids in each n). The genes plotted are differentially expressed cadherin and protocadherin encoding genes from the comparison between MESP2-low and MESP2-high cells at 72 h. The dashed (dark red) lines represent log2 fold change values of -0.58 and 0.58. The error bar represents the estimated standard error for the log fold change from the model (DESeq2) which is represented as the center of the bar. Genes with fold changes greater than 1.5 (above or below the dash line) and padj < 0.05 (estimated by Deseq2 using two-sided Wald test) are considered to be differentially expressed and colored in either yellow (upregulated in MESP2 low cells) or magenta (upregulated in MESP2 high cells). Genes in blue color from the comparison between MESP2-high and UNCX cells at 120 h are non-differentially expressed genes. The exact P values for each gene are shown in Supplementary Table 3. b, Normalized RNA counts of selected genes encoding adhesion proteins in MESP2-high and MESP2-low cell fractions at 72 h (n=3 independent experiments for each time point, with 96 Somitoids in each n; DESeq2 with two-sided Wald test). Cells with top 10% mCherry fluorescence are shown on the left (magenta) and top 10% YFP fluorescence on the right (yellow). c, Expression fold change plots of selected Ephrin protein encoding genes between MESP2-low vs MESP2-high cells at 72 h, or between MESP2-high vs UNCX cells at 120 h (n=3 independent experiments for each time point, with 96 Somitoids in each n). The error bar represents the estimated standard error for the log fold change from the model (DESeq2) which is represented as the center of the bar. Genes with fold changes greater than 1.5 (above or below the dash line) and padj < 0.05 (estimated by Deseq2 using two-sided Wald test) are considered to be differentially expressed and colored in either yellow (upregulated in MESP2 low cells) or magenta (upregulated in MESP2 high cells). Genes in blue color from the comparison between MESP2-high and UNCX cells at 120 h are non-differentially expressed genes. The exact P values for each gene are shown in Supplementary Table 3. d, Normalized RNA counts of selected genes encoding Ephrin proteins in MESP2-high and MESP2-low cell fractions at 72 h (n=3 independent experiments for each time point, with 96 Somitoids in each n; DESeq2 with two-sided Wald test). e, Expression fold change plots of selected cytoskeleton regulating proteins between MESP2-low vs MESP2-high cells at 72 h, or between MESP2-high vs UNCX cells at 120 h (n=3 independent experiments for each time point, with 96 Somitoids in each n). The error bar represents the estimated standard error for the log fold change from the model (DESeq2) which is represented as the center of the bar. Genes with fold changes greater than 1.5 (above or below the dash line) and padj < 0.05 (estimated by Deseq2 using two-sided Wald test) are considered to be differentially expressed and colored in either yellow (upregulated in MESP2 low cells) or magenta (upregulated in MESP2 high cells). Genes in blue color from the comparison between MESP2-high and UNCX cells at 120 h are non-differentially expressed genes. The exact P values for each gene are shown in Supplementary Table 3. After differential gene expression analysis using Deseq2, differentially expressed genes from the MESP2-high vs MESP2-low comparison (72 h) were used to do KEGG functional analysis. The 42 genes plotted represent those that appear in the KEGG pathway “hsa04810” (Regulation of actin cytoskeleton). f, Kymograph of HES7 and MESP2 reporters obtained from a line scan across the center of a Somitoid overexpressing Tiam1 induced by Doxycycline addition at 48 h. g, percentage of UNCX-positive cells characterized by flow cytometry in 120 h control and Somitoids overexpressing Tiam1 induced by Doxycycline addition at 48 h. Bars represent median. Unpaired two-tailed t-test n=6 replica from 2 independent experiments, with 12–18 Somitoids in each replica. h, Left, maximum-z-projection confocal image of a MESP2/UNCX-reporting Somitoid at 120 h, overexpressing Tiam1 induced by Doxycycline addition at 48 h. Right, spatial auto-correlation analysis of MESP2 and UNCX signals (n=3 Somitoids for each condition). All scale bars represent 500 µm.
Extended Data Fig.4
Extended Data Fig.4. Characterization of the Segmentoid model.
a, b, Time-lapse bright field images of the Segmentoid model. A, anterior; P, posterior. c, Number of rosettes in each Segmentoid (n=40 Segmentoids) with the bar representing median. d, Left, projected areas of rosettes in Segmentoids (n=345 rosettes from 20 Segmentoids). Red bars indicate median with interquartile range. Right, shape descriptors of rosettes in Segmentoids (n=345 rosettes from 20 Segmentoids). The middle hinge corresponds to median, the lower and upper hinges correspond to the first and third quartiles, respectively, and the lower and upper whiskers correspond to the minimum and maximum, respectively. e, Representative bright-field and DAPI images of organoids without Matrigel, with 10% Laminin supplemented, and embedded in 1% Matrigel (n>10 Segmentoids for each condition). f, Length of organoids in suspension (n=3 experiments) or embedded in Matrigel (1%, 5%, n=3 experiments; 10%, n=5 experiments). Individual structure lengths in each experiment are plotted on the left. The median lengths of each experiment are plotted on the right with red bars indicating median, ordinary one-way ANOVA, P=0.26 (1%), 0.0023 (5%), 0.00014 (10%) compared with No Matrigel condition. g, Percentage of structures with more than 1 axis in different conditions with red bars indicating median. Ordinary one-way ANOVA, P>0.999 (1%), =0.0154 (5%), 0.0205 (10%) compared with No Matrigel condition. h, Left, time-lapse maximum-z-projection confocal images of PAX3-YFP reporter (top) and PAX3-YFP merged with H2B-mCherry (bottom) in a Segmentoid. Right, kymographs of PAX3 reporter (top), H2B (middle), and merged channels (bottom) in the same Segmentoid. Segmentoids are aligned to the posterior tip at each time point. Scale bars represent 200 µm (a, b, h) and 100 µm (e).
Extended Data Fig.5
Extended Data Fig.5. Expression of TBXT and SOX2 in Segmentoids.
Confocal images of immunostaining of TBXT and SOX2 at 24 h (a), 48 h (b), 72 h (c), 96 h (d), and 120 h (e) of the Segmentoid model. Representative maximum-z-projection images are shown from b-e. 48 h, n=3 Segmentoids; 72 h, n=11 Segmentoids; 96 h, n=17 Segmentoids; 120 h, n=21 Segmentoids, with 7 Segmentoids still showing apparent TBXT and SOX2 double positive pole. A, anterior; P, posterior. Scale bars (a, b) represent 100 µm and 20 µm in corresponding enlarged views; Scale bars (c, d, e) represent 100 µm.
Extended Data Fig.6
Extended Data Fig.6. Single-cell RNAseq of the Segmentoid model.
a, Proportion of cell types identified with Leiden clustering at different timepoints of the Segmentoid model. b, Stream plots of velocities on the UMAP after correction for differential kinetics recapitulating trajectory of cell types at various timepoints. c, Signature gene expression trends (Log2/Normalized) toward somite as the specific terminal population.
Extended Data Fig.7
Extended Data Fig.7. Single-cell RNAseq of the Segmentoid and the Somitoid model.
a, UMAP embedding of cells merged from both models (19,551 cells) colored with cell types identified with Leiden clustering. b, Dot plot of selected genes in cell type clusters from both models. c, Machine-learning classification of a previous data set of E9.5 mouse embryo. d, e, Classifier analysis on cell types comparing the in vitro models with mouse E9.5. A k-NN classifier trained on clusters of mouse clusters was used to predict identities of the human in vitro models. f, g, Classifier analysis on cell types (f) and time points (g) comparing Somitoids with Segmentoids. h, Mean expression heatmap of selected genes in the three datasets. i, Top, somite sub-cluster highlighting cells expressing TBX18 (left) and UNCX (right); Bottom, number of cells expressing TBX18, UNCX, or both in Segmentoids (left) and Somitoids (right). j, k, l, Dot plots of HOX-family genes expression at various timepoints of the Segmentoid model (j), the Somitoid model (k), and the NMP cells of the Segmentoid (l). The mean expression of each cluster is scaled per gene.
Extended Data Fig.8
Extended Data Fig.8. Antero-Posterior patterning and the segmentation clock.
a, b, Time auto-correlation of HES7 (a) and MESP2 (b) reporter oscillations in individual WT Segmentoids. Triangles indicate auto-correlation peaks, which in turn indicate oscillation period. c, Merged maximum-z-projection confocal image of a Segmentoid with UNCX reporter, DAPI, and Phalloidin staining (n>10 Segmentoids). d, Distribution of rosette numbers in each segment along the anterior-posterior axis. A segment is defined as the posterior boundary of the UNCX stripe to that of the next posterior UNCX stripe. The maximal number of rosettes along the AP axis observed was used to represent the entire segment (n=24 Segmentoids). e, Distribution of rosette numbers in each segment along the medial-lateral axis (left; n=25 Segmentoids). The data is re-grouped based on relative AP location in the Segmentoids (right). f, Kymographs of reporters for pseudoHES7, UNCX, and MESP2 in the same HES7-null Segmentoid. g, Wide-field images and graphs of reporter intensities from posterior (P) to anterior (A) end along 120 h HES7-null (left) and WT (right) Segmentoids (n>10 Segmentoids for each condition). h, Time-lapse, maximum-z-projection confocal images of MESP2 reporter in a HES7-null Segmentoid. i, Average nematic order of MESP2/UNCX signals in WT and HES7-null Segmentoids as a function of time (mean±s.d; n=7 WT Segmentoids and n=6 HES7-null Segmentoids). Statistics was performed with a Wilcoxon rank-sum test (two-sided) and P-value is shown. j, Summary of HES7-null phenotypes in Somitoid and Segmentoid. All scale bars represent 100 µm.
Extended Data Fig.9
Extended Data Fig.9. Antero-Posterior patterning and cell sorting.
a, Reporter dynamics in forming segments aligned according to phases of HES7 oscillation (n=6 segments in 2 Segmentoids). Data are represented as mean±s.d. b, Representative images of MESP2 reporter and H2B-GFP in a segment at the salt and petter stage. c, Left, Time-lapse, maximum-z-projection confocal images of MESP2 reporter in the same Segmentoid in Fig.4d. Right, temporal profile of MESP2 intensity in the forming segment outlined in cyan. Green solid-line boxes indicate the corresponding time points. d, Representative example of spatial auto-correlation analysis (mean±s.e.m) of MESP2 and UNCX reporters as a function of time in a developing segment (n=6 segments from 2 Segmentoids). e, Cell tracking examples of MESP2-high cells. Dots of the same color represent the same cell and the orange outlines indicate the forming segment. f, Movement classification of tracked MESP2-high cells starting in the posterior part of the segment (n=111 cells from 10 segments in 5 Segmentoids). g, Additional examples of velocity field (arrows) and the corresponding divergence (heatmap) of Particle Image Velocimetry analysis and regions of positive divergence overlayed on the MESP2 reporter image. h, Additional examples of merged kymographs of HES7/UNCX (green) and MESP2 (magenta) in a Segmentoid overexpressing Tiam1 induced by Doxycycline addition at 72 h, as well as HES7 and MESP2 oscillations. i, Wide-field images and graphs of reporter intensities from posterior (P) to anterior (A) end along 120 h Segmentoids, overexpressing Tiam1 induced by Doxycycline addition at 72 h (left; n>10 Segmentoids) or treated with 10 µM ROCKi (right; n>10 Segmentoids). All scale bars represent 100 µm.
Extended Data Fig.10
Extended Data Fig.10. Embryos stained with Mesp2 HCR probe.
a, Merged maximum-z-projection confocal image of a mouse embryo stained with Mesp2 HCR probe (cyan) and DAPI (magenta). b, Enlarged view of the region indicated by the dotted-line box in a. c, Additional half-embryo pairs stained with MESP2 HCR probe (red) and DAPI (cyan). d, Schemes for quantification. e, High pixel fractions of the anterior and posterior portions of the MESP2 bands at 0 and 45 min. Paired t-test, two-sided. f, Standard Deviations of pixel values in the anterior/posterior portions of the MESP2 bands at 0 and 45 min. Paired t-test, two-sided. Three out of 10 embryos at Time 0 captured the peak of the broad band phase of MESP2 expression, with the criteria that the expression domain roughly occupied the whole segment and MESP2 total intensity was not significantly increased at 45 min. Scale bars represent 100 µm (a, d) and 20 µm (b); 100 µm and 20 µm in corresponding enlarged views (c).
Fig.1
Fig.1. Characterization of the Somitoid model.
a, Protocol illustration. b, Reporter kymograph from a line scan across the center of Somitoid. c, Temporal profiles (mean±s.d.) of reporters for HES7 (n=5 Somitoids), MESP2 (n=6 Somitoids), and PAX3 (n=6 Somitoids). d, Image of PAX3 reporting Somitoid. e, Bright field images and rosette projected areas (n=1957 rosettes from 20 Somitoids). center line, median; box limits, upper and lower quartiles; whiskers, maximum and minimum. f-g, Immunostaining images of rosettes (n>10 Somitoids). h, Heat map of selected genes in 48 h, 66 h, and 120 h Somitoids (n=3 experiments; 48 Somitoids in each n), as measured by RNA sequencing. Expression levels were calculated by log2 (TPM+0.01). i, HES7 knockout strategy. j, Kymograph of pseudoHES7 and MESP2 reporters in HES7-null Somitoid. k, Temporal profiles (mean±s.d.) of reporters for pseudoHES7 (n=6 Somitoids), MESP2 (n=6 Somitoids), and PAX3 (n=9 Somitoids) in HES7-null Somitoids. l, PAX3 reporter in HES7-null Somitoid. m, MESP2 knockout strategy. n, Temporal profiles (mean±s.d.) of reporters for HES7 (n=6 Somitoids) and PAX3 (n=8 Somitoids) in MESP2-null Somitoids. o, PAX3 reporter in MESP2-null Somitoid. p, Image of PAX3-reporting Somitoid treated with 10 µM ROCKi for 48 h. q, Experiment scheme and image of re-aggregating 120 h Somitoids. PAX3 reporter and bright field images are overlayed. Scale bars 500 µm (d, l, o, p, q); 100 µm (e, f); 50 µm (g).
Fig.2
Fig.2. Antero-Posterior polarity patterning in the Somitoid model.
a, Images of MESP2-mCherry and UNCX-YFP reporter and fluorescence intensity profiles across the dotted-line box. b, Temporal profiles (mean±s.d.) of MESP2 (n=6 Somitoids) and UNCX (n=10 Somitoids) over entire Somitoids. c, Temporal profiles of MESP2-mCherry in single cells. d, Time lapse images of MESP2-mCherry reporter and tracks of MESP2-high cells (yellow dotted line represents a forming MESP2-low region). e, Top, spatial auto-correlation of MESP2-mCherry and UNCX-YFP signals over time. Bottom, abscissa-position of the trough of the spatial auto-correlation function over time. f, Experiment design (left), temporal MESP2-mCherry profiles in single cells (middle; n=46 cells from 1 Somitoid; thickened lines represent median), and correlation analysis of MESP2-mCherry intensities at 72 and 84 h (right). F-test (one-sided), P=3.89e-17 after 2 outliers removed (magenta cross; Methods). g, Left, velocity field (arrows) and the corresponding divergence (heatmap) of PIV analysis. Right, positive divergence regions (yellow lines), extracted from the left panel, overlayed on 84 h MESP2-mCherry image. h, Divergence of velocity field of MESP2-high and low regions (mean±s.d., n=10 regions from 2 Somitoids; unpaired two-tailed t-test). i-k, Scheme (i) and images of re-aggregated Somitoids at 72 h (j) or 96 h (k). l-n, Scheme (l) and images of re-aggregated MESP2-high (m) and low (n) cells separated at 72h. o, Model illustration. Solid circles, MESP2-high cells; Hollow circles, MESP2-low cells. p, Normalized RNA counts of TIAM1 in separated cell fractions at 72 h or 120 h, measured by RNA sequencing (n=3 experiments, 96 Somitoids in each n; DESeq2 with two-sided Wald test). MESP2-high cells are shown on the left (magenta), and MESP2-low (72 h) or UNCX+ (120 h) cells on the right (yellow). q, Reporter images of Somitoid overexpressing Tiam1 (Doxycycline since 48 h). Scale bars 150 µm (a, g, j, k, m, n, q); 100 µm (d).
Fig.3
Fig.3. Characterization of the Segmentoid model.
a, Protocol illustration. b, Developmental sequence of a Segmentoid. A, anterior; P, posterior. c, Segmentoid at 96 h (n>10 Segmentoids). d, Posterior tip of 96 h Segmentoid immunostained with TBXT and SOX2 (n>10 Segmentoids). e, UMAP embedding (10,861 cells) colored with timepoints (left) and cell types (right) identified with Leiden clustering. iPSC, 1,491 cells; 24 h, 1,066 cells; 48 h, 1,577 cells from 76 Segmentoids; 72 h, 3,539 cells from 64 Segmentoids; 98 h, 3,188 cells from 32 Segmentoids. f, Dot plot showing expression of selected cell type specific genes in Segmentoids’ clusters. Mean expression of each cluster is scaled per gene. g, PAGA graphs with velocity-directed edges in 72 h (top) and 98 h (bottom) Segmentoids. h, UMAP embedding (8,690 cells) colored with timepoints (left) and cell types (right) following Leiden clustering. iPSC, 1,491 cells; 24 h, 1,265 cells from 96 Somitoids; 48 h, 2,335 cells from 96 Somitoids; 66 h, 2,246 cells from 80 Somitoids; 98 h, 1,353 cells from 48 Somitoids. i, Dot plot showing expression of selected cell type specific genes in Somitoids’ clusters. j, Heatmap of cell density (scaled per timepoint) in UMAP of cells from merged datasets of Somitoids and Segmentoids (19,551 cells). k, Illustration of in vitro models. Each cell type is represented by the same color. l, Kymographs of HES7-Achilles (posterior part in the kymograph), UNCX-YFP, and MESP2-mCherry reporters. Each time point is aligned to the posterior tip. m, Top, kymograph showing expression of the HES7/UNCX (green) and MESP2 (magenta) reporters. Dotted line highlights the start of MESP2 expression. Bottom, HES7 and MESP2 oscillations (Methods). n, Reporter images (left) and intensity profiles (right) along Segmentoid at 120 h (n>10 Segmentoids). o, Images of UNCX-YFP merged with Phalloidin or DAPI (n>10 Segmentoids). Scale bars 200 µm (b, c, n); 100 µm (d, o).
Fig.4
Fig.4. Formation of anterior and posterior somite compartments in Segmentoids.
a, Time lapse reporter images of HES7-null Segmentoid. b, Merged kymographs (top) and pseudoHES7-Achilles and MESP2-mCherry oscillations (bottom; Methods). c, Average time auto-correlation of reporter oscillations in WT (n=7 Segmentoids) and HES7-null (n=6 Segmentoids). d, Time lapse reporter images of WT Segmentoid. White arrowheads indicate peaks of HES7 oscillation. e, Time lapse MESP2-mCherry images and tracks of MESP2-high cells. Dots of same color represent the same cell. f, Images showing “start” and “end” of tracking (left), temporal MESP2-mCherry profiles in single cells (middle; n=63 cells from 7 segments of 3 Segmentoids; thickened lines represent median), and correlation analysis of MESP2-mCherry intensities at start and end (right). F-test (one-sided), P = 7.47e-13 after 3 outliers removed (magenta cross; Methods). g, Left, Velocity field with the corresponding divergence of PIV analysis (top) and positive divergence regions overlayed on MESP2-mCherry image (bottom). Right, divergence of velocity field of MESP2-high and low regions (mean±s.d., n=6 segments of 3 Segmentoids; unpaired two-tailed t-test). h, Time lapse reporter images after Tiam1 overexpression. Doxycycline (Doxy) was added 24 h before. i, Merged kymographs (top) and reporter oscillations (bottom) after Tiam1 overexpression (Doxy since 72 h). j, Image of reporters after ROCKi treatment for 72 h. k, Percentages with proper patterning (Methods). Each data represents an independent experiment (WT, n=7; Doxy, n=3; ROCKi, n=5; HES7-/-, n=6; Tiam1, n=5); red bars, median. Total numbers scored and positive numbers (red) are shown. One-way ANOVA Tukey, compared with WT, P=0.98 (Doxy), 0.31 (ROCKi), 5.03e-10 (HES7-/-), 1.14e-9 (Tiam1). l, Images of chicken embryo stained with MESP2 HCR probe and membrane dye. m, Experiment scheme and images of half-embryo pairs stained with MESP2 HCR probe and DAPI. n, Model illustration. Scale bars 100 µm (a, d, e, f, g, h, j); 50 µm (l, m).

Comment in

References

    1. Hubaud A & Pourquié O Signalling dynamics in vertebrate segmentation. Nat. Rev. Mol. Cell Biol 15, 709–721 (2014). - PubMed
    1. Saga Y The mechanism of somite formation in mice. Curr. Opin. Genet. Dev 22, 331–338 (2012). - PubMed
    1. Fleming A, Kishida MG, Kimmel CB & Keynes RJ Building the backbone: the development and evolution of vertebral patterning . Development 142, 1733–1744 (2015). - PubMed
    1. Kuan C-YK, Tannahill D, Cook GMW & Keynes RJ Somite polarity and segmental patterning of the peripheral nervous system. Mech. Dev 121, 1055–1068 (2004). - PubMed
    1. Oates AC, Morelli LG & Ares S Patterning embryos with oscillations: structure, function and dynamics of the vertebrate segmentation clock. Development 139, 625–639 (2012). - PubMed

Publication types

Substances