. 2022 Dec;10(12):e005660.
doi: 10.1136/jitc-2022-005660.

Targeting of colorectal cancer organoids with zoledronic acid conjugated to the anti-EGFR antibody cetuximab

Affiliations

Targeting of colorectal cancer organoids with zoledronic acid conjugated to the anti-EGFR antibody cetuximab

Roberto Benelli et al. J Immunother Cancer. 2022 Dec.

Abstract

Background: Antibody-drug conjugates (ADC) are essential therapeutic options to treat solid and hematological cancers. The anti-epidermal growth factor-receptor (EGFR) antibody cetuximab (Cet) is used for the therapy of colorectal carcinoma (CRC). Anti-CRC Vδ2 cytolytic T lymphocytes can be elicited by the priming of tumor cells with the aminobisphosphonate zoledronic acid (ZA) and consequent presentation of isopentenyl pyrophosphates through butyrophilin (BTN) family members such as BTN3A1 and BTN2A1. A major drawback that impairs the targeting of ZA to CRC is the bone tropism of aminobisphosphonates.

Methods: The phosphoric group of ZA was linked to free amino groups of Cet in the presence of imidazole following the labeling of phosphoric groups of DNA to amino groups of proteins. The generation of Cet-ZA ADC was confirmed by matrix assisted laser desorption ionization mass spectrometry and inductively coupled plasma-mass spectrometry analysis. Thirteen CRC organoids were obtained with a chemically defined serum-free medium in Geltrex domes. Proliferation and activation of cytolytic activity against CRC organoids by Vδ2 T cells was detected with flow cytometry, crystal violet and cytotoxic probe assays and image analysis. Immunohistochemistry and quantification of BTN3A1 or BTN2A1 expression and the number of tumor infiltrating Vδ2 T cells in CRC were performed by automatic immunostaining, whole slide scanning and computerized analysis of digital pathology imaging.

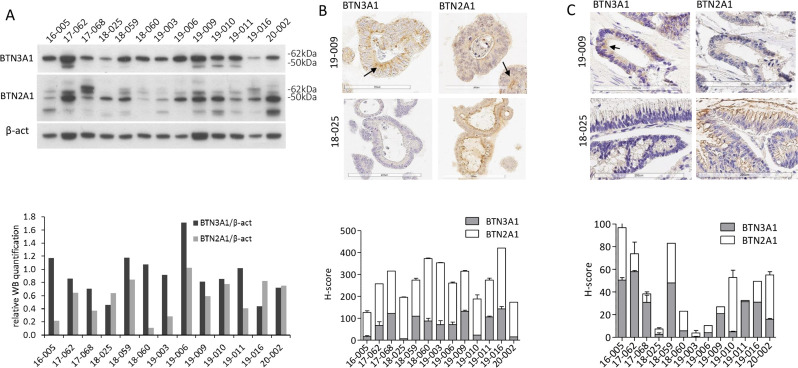
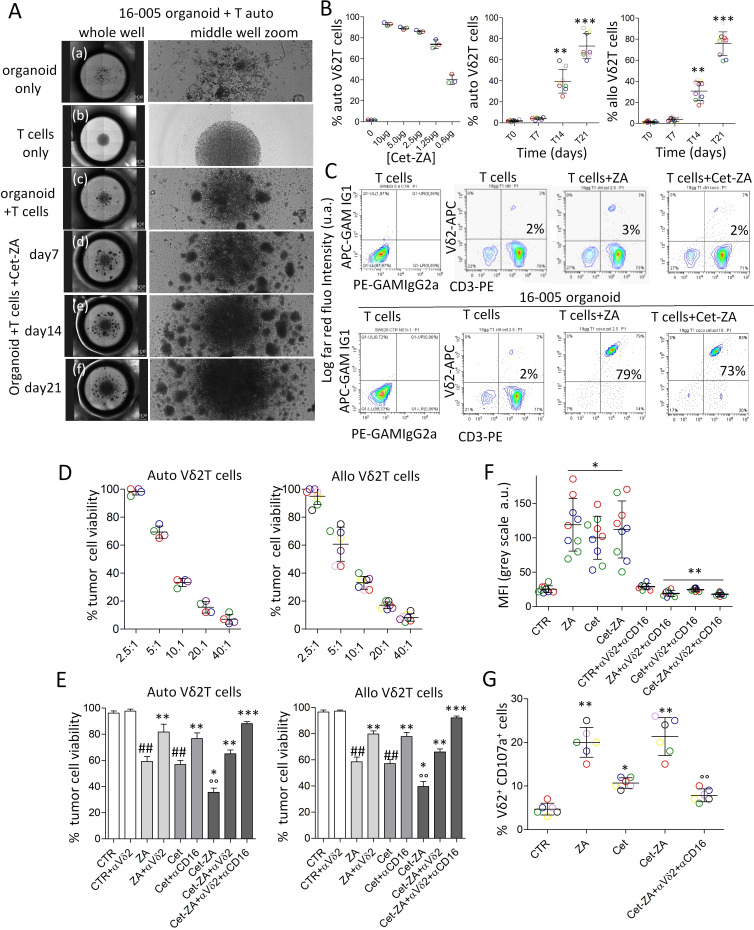
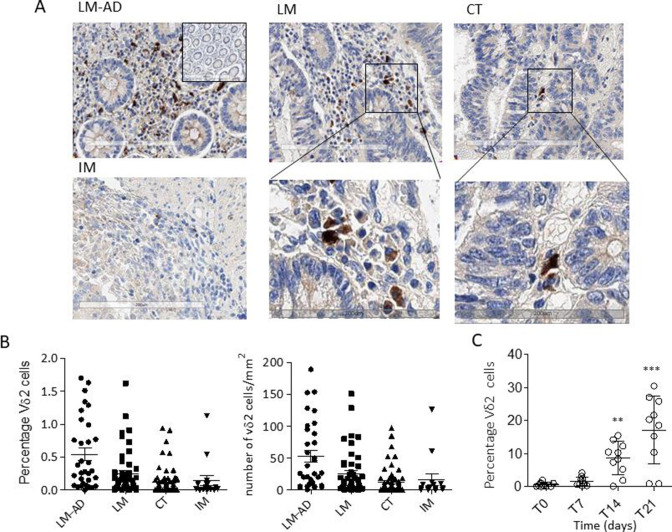
Results: The novel ADC Cet-ZA was generated with a drug antibody ratio of 4.3 and displayed a reactivity similar to the unconjugated antibody. More importantly, patient-derived CRC organoids, or CRC tumor cell suspensions, could trigger the expansion of Vδ2 T cells from peripheral blood and tumor infiltrating lymphocytes when primed with Cet-ZA. Furthermore, Cet-ZA triggered Vδ2 T cell-mediated killing of CRC organoids. The expression of BTN3A1 and BTN2A1 was detected not only in CRC organoids but also in CRC specimens, together with a considerable amount of tumor infiltrating Vδ2 T cells.

Conclusions: These findings are proof of concept that the Cet-ZA ADC can be used to target specifically CRC organoids and may suggest a new experimental approach to deliver aminobisphosphonates to EGFR+ solid tumors.

Keywords: Antibodies, Neoplasm; Cytotoxicity, Immunologic; Gastrointestinal Neoplasms; Lymphocyte Activation.


Conflict of interest statement

Competing interests: None declared.

Figures

Figure 1
Figure 1
Cet-ZA ADC characterization and reactivity with CRC organoids. (A) Matrix assisted laser desorption ionization mass spectra of Cetuximab (top) and Cet-ZA ADC (bottom). Singly, doubly and triply charged species are detected at about m/z 150 kDa, 75 kDa and 50 kDa, respectively. (B) Cet-ZA titration. Upper panels: the CRC cell lines LS180, SW480 and HT29 were incubated with serial dilutions (200–0.002 µg/mL/106 cells) of Cet or Cet-ZA ADC for 1 hour at RT, followed by the APC-labeled anti-hIg antiserum. Samples were analyzed by CyAn ADP flow cytometer and results are expressed as log mean fluorescence intensity (MFI, arbitrary units, a.u.). Lower panels: histograms of the reactivity of Cet (light gray) or Cet-ZA ADC (black) at 2 µg/mL/106 cells evaluated by flow cytometry as above and expressed as log far red fluorescence intensity (a.u.) versus percentage of positive cells. Also, the epithelial growth factor receptordull SW620 cell line is depicted. Negative control (CTR; cells incubated with the APC-conjugated goat-human antiserum alone) is shown with the light gray line. (C) LS180, SW480, HT29 cell lines were incubated with 2 µg/mL Cet or Cet-ZA ADC as above followed by 100 nM SYTO 16, observed with FV500 Confocal Microscope (400× magnification) and data analyzed with FluoView V.4.3b computer software. Red: Cet or Cet-ZA. Blue: nuclei in pseudocolor. Bar: 10 µm. (D) The indicated organoids, prepared as described in Materials and Methods, were incubated with Cet (gray) or Cet-ZA ADC (black), followed by the APC-anti-hIg antiserum. Control aliquots were stained with APC-anti-hIg alone (CTR, light gray). Samples were analyzed by CyAn ADP flow cytometer and results are expressed as log far red fluorescence intensity (a.u.) versus cell number. (E) Organoids were incubated with 2 µg/mL Cet or Cet-ZA ADC as above followed by 100 nM SYTO 16, observed with FV500 Confocal Microscope (400× magnification) and data analyzed with FluoView V.4.3b computer software. Red: Cet or Cet-ZA. Blue: nuclei in pseudocolor. Bar:100 µm. ADC, antibody-drug conjugates; APC, allophycocyanin; Cet, cetuximab; CRC, colorectal cancer; RT, room temperature; ZA, zoledronic acid.
Figure 2
Figure 2
Expression of BTN3A1 and BTN2A1 in CRC organoids. (A) Upper panel: western blot of CRC organoid (n=13) lysates: BTN3A1, BTN2A1 and beta-actin signals are shown. Lower panel: histogram representing the relative quantification of BTN3A1 (black) and BTN2A1 (gray) levels, normalized against beta-actin. As BTN2A1 showed multiple bands, the lane with the higher signal (about 50 kDa) was used for quantification. (B) Upper pictures: expression of BTN3A1 and BTN2A1 by IHC on two representative CRC organoids (arrows indicate the main distribution). Lower panel: quantification (H-score) of BTN3A1 (gray) or BTN2A1 (white) expression in all CRC-derived organoids. Each value is the mean±SD from three different sections (each containing 20–40 organoids). (C) Upper pictures: expression of BTN3A1 and BTN2A1 by IHC on the tumor specimens where the organoids in (B) were derived from. Lower panel: quantification (H-score) of BTN3A1 (gray) or BTN2A1 (white) expression in all CRC specimens which organoids were derived from. Each value is the mean±SD from three different sections for each patient. BTN, butyrophilin; CRC, colorectal cancer; IHC, immunohistochemistry.
Figure 3
Figure 3
Cet-ZA ADC can induce Vδ2 T-cell proliferation and trigger Vδ2 T-cell cytotoxicity against CRC organoids. (A) Images of cell cultures of either CRC organoids, or autologous (auto) T cells or co-cultures of organoids and autologous T cells, taken using the JuLI-stage imaging recorder. For each culture condition, the combination of images of the entire well (left pictures) and the middle region of the U-bottomed culture well (right pictures) are shown. (A) organoids only at the onset of the assay; (B) T cells only on day 21 of culture; (C) T cells and organoids on day 21 of culture; (D–F) T cells and organoids in the presence of 2 µg/mL Cet-ZA on day 7, 14 and 21, respectively. (B) Percentage of Vδ2 T cells evaluated, by double immunofluorescence and FACS analysis at day 21 of culture with serial dilutions of Cet-ZA (0.6–10 µg/mL, left graph), or at day 7, 14, 21 of culture with 2 µg/mL Cet-ZA (central and right graphs). The different colors of the symbols represent organoids and T lymphocytes from different patients (central graph) or from different healthy donors (right graph). **p<0.001 and ***p<0.0001 versus T0 (day 0). (C) Percentage of Vδ2 T cells (upper panels: autologous T cells alone; lower panels: autologous T cells co-cultured with the 16–005 organoid), evaluated at day 21 of culture without or with 5 µM ZA, or 2 µg/mL Cet-ZA, by double immunofluorescence with the anti-Vδ2 γδ123R3 (IgG1) and the anti-CD3 JT3A 289/11 /F10 (IgG2a) mAb, followed by PE-GAM IgG1 or APC-GAM IgG2a and fluorescence activated cell sorter (FACS) analysis. Negative controls of T cells incubated with both the anti-isotype specific GAM are shown in the left contour plots. Results are expressed as log far red fluorescence intensity (arbitrary units, a.u.) versus log red fluorescence intensity (a.u.). (D) Cytolytic activity exerted by autologous (left graph) or allogenic (right graph) Vδ2 T cells, at different effector:target (E:T) ratios, against CRC organoids seeded in Geltrex drops. After 72 hours, co-cultures were allowed to adhere in clean plates for further 24 hours, stained with crystal-violet and colorimetric intensity evaluated at 594 nm. Results are expressed as percentage of cell viability. Mean±SD from experiments performed with four (left) or six (right) organoids (different colors). (E) Cytolytic activity exerted by autologous (left graph) or allogenic (right graph) Vδ2 T cells, in the absence (control, CTR) or presence of 2 µg/mL Cet-ZA, or 2 µg/mL cet or 2 µM ZA, at the E:T ratio of 2.5:1. In some experiments, the anti(α)-Vδ2 mAb (γδ123) or the anti(α)-CD16 (VD4) mAb (1 µg/mL) were added, alone or in combination as indicated. Cytotoxicity was evaluated and results expressed as in panel (A). Mean±SD from experiments performed with four (left) or six (right) organoids. ##p<0.001 versus CTR; °°p<0.001 versus ZA or Cet; *p<0.0001 versus CTR; **p<0.001 versus ZA or Cet or Cet-ZA; ***p<0:0001 versus ZA or Cet or Cet-ZA. (F) Cytotoxicity measured on addition to CRC organoids/Vδ2 T-cell cultures of 100 nM C. LIVE Tox Green fluorescent probe for 24 hours, either without (CTR) or with stimuli (ZA, Cet, Cet-ZA), and in some samples with the anti(α)-Vδ2 plus anti(α)-CD16 mAb (1 µg/mL). Images were taken with the JuLI-stage imaging device, turned into black and white pictures and analyzed with the Cell Count plugin tool of the ImageJ2 software, after defining a random 200 region of interest. Results are expressed as mean fluorescence intensity as gray color intensity (a.u.) and are the mean±SD from three experiments, in triplicate, with nine different organoids (identified by colors) and autologous Vδ2 T cells. *p<0.001 versus CTR; **p<0.001 versus ZA, Cet, or Cet-ZA. (G) Cytotoxic granule exocytosis by Vδ2 T cells towards autologous organoids. The PE-conjugated anti-CD107a (LAMP-1) mAb was added to the co-cultures performed as above (E:T ratio 2.5:1), either without (CTR) or with ZA, Cet or Cet-ZA, for the last 24 hours. Cytolytic effectors were identified by staining with the APC-anti-CD3 mAb. Results are expressed as percentage of CD3+CD107a+ cells by flow cytometry analysis and are the mean±SD from five experiments (identified by colors) with different organoids and autologous Vδ2 T cells. **p<0.0001 versus CTR; *p<0.001 versus CTR; °°p<0.001 versus Cet-ZA. ADC, antibody-drug conjugates; APC, allophycocyanin; Cet, cetuximab; CRC, colorectal cancer; GAM, goat anti-mouse; LAMP-1, lysosomal-associated membrane protein 1; mAb, monoclonal antibodies; ZA, zoledronic acid.
Figure 4
Figure 4
CRC localization of Vδ2 T lymphocytes in different tumor areas. (A) Vδ2 T lymphocyte identified by staining with the anti-Vδ2 BB3 mAb in the different areas of a representative CRC. Upper images: adenomatous areas (LM-AD, left), luminal margin (LM, central) or central tumor (CT, right) (20× magnification). Inset in the upper left image: negative CTR with the second reagents alone (10×). Lower left image: invasive margin (IM), lower central and lower right images are enlargements of the squares indicated in LM and CT of the upper images. (B) Quantification of Vδ2 T-cell infiltration in patients with CRC: LM-AD, LM, CT and IM, evaluated with the Nuclear V9 macro of Leica Image Scope V.12.3 software (described in online supplemental figure 4C). Left graph: percentage of Vδ2 T lymphocytes/total cell number (nuclei count). Right graph: number of Vδ2 T lymphocytes/mm2. (C) Cet-ZA ADC (2 µg/mL/106 cells) was added to CRC-derived cell suspensions and Vδ2 T cells were evaluated at time 0 and at 7, 14, 21 days of culture by double immunofluorescence with the anti-Vδ2 mAb γδ123R3 and the anti-CD45 mAb, followed by PE-GAM IgG1 or APC-GAM IgG2a and flow cytometry analysis. Results are expressed as percentage of Vδ2 T cells as mean±SD from 10 cases. **p<0.001 and ***p<0.0001 versus T0 (day 0). ADC, antibody-drug conjugates; APC, allophycocyanin; Cet, cetuximab; CRC, colorectal cancer; GAM, goat anti-mouse; mAB, monoclonal antibodies; ZA, zoledronic acid.

Similar articles

Cited by

References

    1. Fridman WH, Pagès F, Sautès-Fridman C, et al. . The immune contexture in human tumours: impact on clinical outcome. Nat Rev Cancer 2012;12:298–306. 10.1038/nrc3245 - DOI - PubMed
    1. Church SE, Galon J. Tumor microenvironment and immunotherapy: the whole picture is better than a glimpse. Immunity 2015;43:631–3. 10.1016/j.immuni.2015.10.004 - DOI - PubMed
    1. Gentles AJ, Newman AM, Liu CL, et al. . The prognostic landscape of genes and infiltrating immune cells across human cancers. Nat Med 2015;21:938–45. 10.1038/nm.3909 - DOI - PMC - PubMed
    1. Meraviglia S, Lo Presti E, Tosolini M, et al. . Distinctive features of tumor-infiltrating γδ T lymphocytes in human colorectal cancer. Oncoimmunology 2017;6:e1347742. 10.1080/2162402X.2017.1347742 - DOI - PMC - PubMed
    1. Corvaisier M, Moreau-Aubry A, Diez E, et al. . V gamma 9V delta 2 T cell response to colon carcinoma cells. J Immunol 2005;175:5481–8. 10.4049/jimmunol.175.8.5481 - DOI - PubMed

Publication types