. 2022 Dec;10(12):e005293.
doi: 10.1136/jitc-2022-005293.

Impact of CD4 T cells on intratumoral CD8 T-cell exhaustion and responsiveness to PD-1 blockade therapy in mouse brain tumors

Affiliations

Impact of CD4 T cells on intratumoral CD8 T-cell exhaustion and responsiveness to PD-1 blockade therapy in mouse brain tumors

Saad M Khan et al. J Immunother Cancer. 2022 Dec.

Erratum in

Abstract

Background: Glioblastoma is a fatal disease despite aggressive multimodal therapy. PD-1 blockade, a therapy that reinvigorates hypofunctional exhausted CD8 T cells (Tex) in many malignancies, has not shown efficacy in glioblastoma. Loss of CD4 T cells can lead to an exhausted CD8 T-cell phenotype, and terminally exhausted CD8 T cells (Tex term) do not respond to PD-1 blockade. GL261 and CT2A are complementary orthotopic models of glioblastoma. GL261 has a functional CD4 T-cell compartment and is responsive to PD-1 blockade; notably, CD4 depletion abrogates this survival benefit. CT2A is composed of dysfunctional CD4 T cells and is PD-1 blockade unresponsive. We leverage these models to understand the impact of CD4 T cells on CD8 T-cell exhaustion and PD-1 blockade sensitivity in glioblastoma.

Methods: Single-cell RNA sequencing was performed on flow sorted tumor-infiltrating lymphocytes from female C57/BL6 mice implanted with each model, with and without PD-1 blockade therapy. CD8+ and CD4+ T cells were identified and separately analyzed. Survival analyses were performed comparing PD-1 blockade therapy, CD40 agonist or combinatorial therapy.

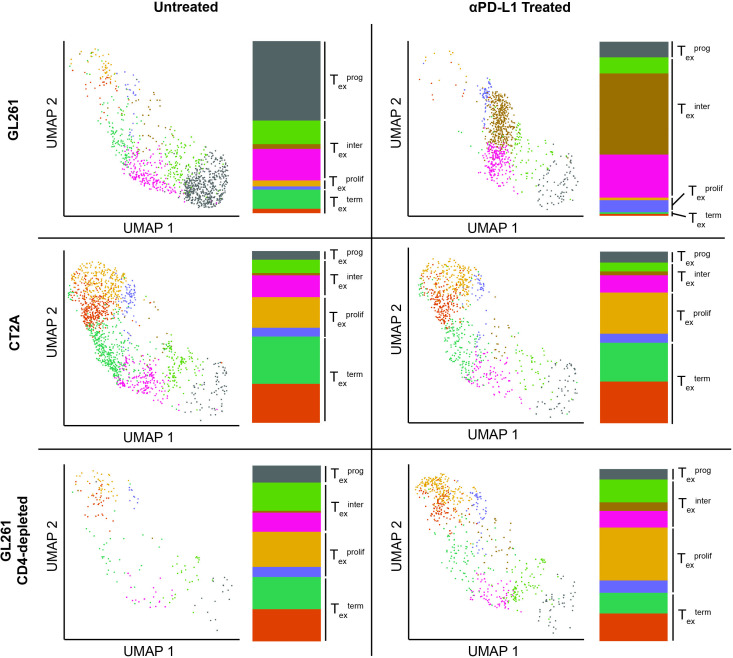
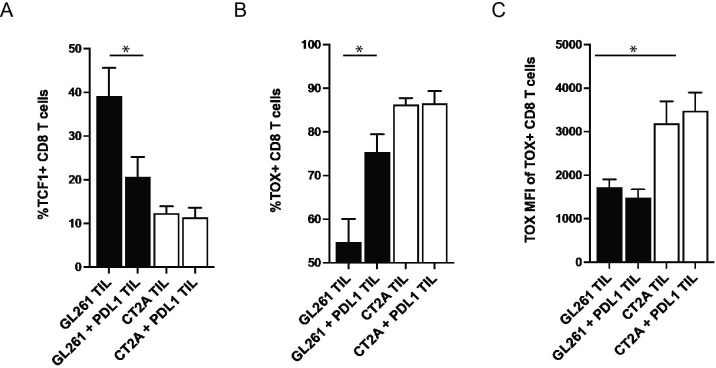
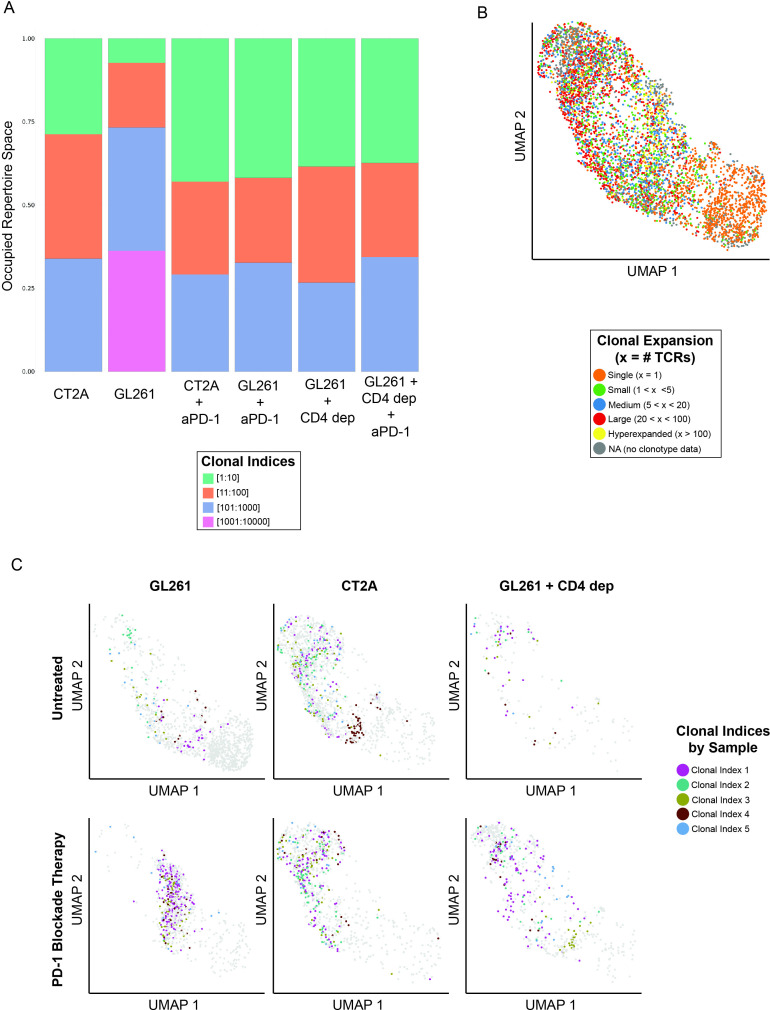
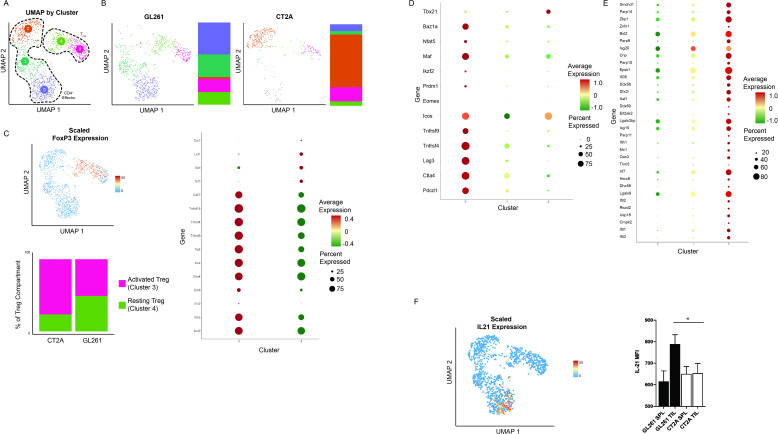
Results: The CD8 T-cell compartment of the models is composed of heterogenous CD8 Tex subsets, including progenitor exhausted CD8 T cells (Tex prog), intermediate Tex, proliferating Tex, and Tex term. GL261 is enriched with the PD-1 responsive Tex prog subset relative to the CT2A and CD4-depleted GL261 models, which are composed predominantly of the PD-1 blockade refractory Tex term subset. Analysis of the CD4 T-cell compartments revealed that the CT2A microenvironment is enriched with a suppressive Treg subset and an effector CD4 T-cell subset that expresses an inhibitory interferon-stimulated (Isc) signature. Finally, we demonstrate that addition of CD40 agonist to PD-1 blockade therapy improves survival in CT2A tumor-bearing mice.

Conclusions: Here, we describe that dysfunctional CD4 T cells are associated with terminal CD8 T-cell exhaustion, suggesting CD4 T cells impact PD-1 blockade efficacy by controlling the severity of exhaustion. Given that CD4 lymphopenia is frequently observed in patients with glioblastoma, this may represent a basis for resistance to PD-1 blockade. We demonstrate that CD40 agonism may circumvent a dysfunctional CD4 compartment to improve PD-1 blockade responsiveness, supporting a novel synergistic immunotherapeutic approach.

Keywords: CD4-positive T-lymphocytes; CD8-positive T-lymphocytes; brain neoplasms; immunotherapy; lymphocytes, tumor-infiltrating.


Conflict of interest statement

Competing interests: None declared.

Figures

Figure 1
Figure 1
Single-cell RNA-sequencing characterization of infiltrating CD8+ T cells in six glioma models. (A) UMAP with cells colored according to graph-based cluster on the left (Tex subsets defined in subsequent analyses) and by glioma model on the right. (B) Gene expression dot plot of key genes associated with terminal and progenitor exhausted T-cell (Tex) populations, which defines cluster 1 as Texprog. (C) UMAP and violin plot of left exhaustion module score and right expression of Tcf7. (D) UMAP feature plot of Ki67 expression supports clusters 3 and 7 as a Texprolif subset. Tex, exhausted CD8 T cell; Texprog, progenitor exhausted CD8 T cell; Texprolif, proliferating Tex cell.
Figure 2
Figure 2
Effect of murine glioma model and PD-1 blockade therapy on CD8+ T-cell compartment. For each model: left UMAP of CD8+ T cells, right histogram of cell composition in each cluster. While GL261 shifts from a Texprog to Texinter predominant model following PD-1 blockade therapy, the CD4-deficient models (CT2A and CD4-depleted GL261) are composed of Texterm cells that are not affected by PD-1-blockade therapy. Tex, exhausted CD8 T cell; Texinter, intermediate exhausted CD8 T cell; Texprog, progenitor exhausted CD8 T cell; Texprolif, proliferating Tex cell; Texterm, terminally exhausted CD8 T cell.
Figure 3
Figure 3
Differences in TCF1 and TOX expression among CD8+ TIL isolated from GL261 and CT2A with and without PD-1 blockade therapy. (A) Bar graph depicting percentage TCF1+PD-1+CD8+ TIL among total PD-1+CD8+ TIL in GL261 and CT2A with and without anti-PDL1 antibody treatment (GL261 TIL vs CT2A TIL, p=0.0025; GL261 TIL vs GL261+PDL1 TIL, p=0.021). (B) Bar graph depicting percentage TOX+PD-1+CD8+ TIL among total PD-1+CD8+ TIL in GL261 and CT2A with and without anti-PDL1 antibody treatment (GL261 TIL vs CT2A TIL, p=0.0003; GL261 TIL vs GL261+PDL1 TIL, p=0.0057). (C) Bar graph representing mean fluorescent intensity of TOX expression in TOX+PD-1+CD8+ TIL (GL261 TIL vs CT2A TIL, p=0.0069). Data pooled from at least two independent experiments with n=3 mice per group per experiment. TIL, tumor-infiltrating lymphocyte.
Figure 4
Figure 4
Tumor-infiltrating T-cell TCR clonality and diversity (A) TCR heterogeneity of each glioma model, wherein ‘clonal index’ represents each clonotype’s rank-based frequency. (B) Clonal expansion categories superimposed onto UMAP of all conditions concatenated. (C) Visualization of the top five expanded clonotypes of each tumor model superimposed onto individual UMAP.
Figure 5
Figure 5
Single-cell RNA sequencing characterization of infiltrating CD4 T cells. (A) UMAP with cells colored according to graph-based cluster. (B) Graph-based clustering and cluster composition of the CD4 T-cell compartment separated by glioma model. (C) Characterization of the regulatory T-cell (Treg) compartment: scaled Foxp3 expression defines clusters 3 and 4 as Treg (left/top); expression dot plot of key Treg genes defines cluster 3 as activated and cluster 4 as resting Treg (right); and histogram of Treg composition shows CT2A is predominantly activated Treg, while GL261 is composed of equivalent proportions of activated and resting Treg (left/bottom). (D) Expression dot plot of effector CD4 T-cell genes in the non-Treg clusters. (E) Expression dot plot of genes comprising the Isc signature, which is more highly expressed in cluster 2. (F) Feature plot demonstrating scaled gene expression of IL-21 (left) and bar graph depicting protein expression represented as mean fluorescent intensity of IL-21 within Foxp3 CD4+ TIL (right; data pooled from at least two independent experiments with n=3 mice per group per experiment.; GL261 TIL vs CT2A TIL, p=0.030). IL, interleukin; TIL, tumor-infiltrating lymphocyte; Treg, regulatory T cell.
Figure 6
Figure 6
Circumventing a dysfunctional CD4 T-cell response through CD40 agonism. Kaplan-Meier survival curves evaluating CD40 agonist and PD-1 blockade monotherapy and combinatorial therapy in (A) CT2A (p=0.0003) and (B) GL261 (p=0.1129) demonstrate CD40 agonism delivers a synergistic benefit with PD-1-blockade therapy, exclusively in a CD4-deficient environment. For each experiment, n=5 per group and pooled from two independent experiments.

References

    1. Desai R, Suryadevara CM, Batich KA, et al. Emerging immunotherapies for glioblastoma. Expert Opin Emerg Drugs 2016;21:133–45. 10.1080/14728214.2016.1186643 - DOI - PMC - PubMed
    1. Wolburg H, Noell S, Fallier-Becker P, et al. The disturbed blood-brain barrier in human glioblastoma. Mol Aspects Med 2012;33:579–89. 10.1016/j.mam.2012.02.003 - DOI - PubMed
    1. Tawbi HA, Forsyth PA, Algazi A, et al. Combined nivolumab and ipilimumab in melanoma metastatic to the brain. N Engl J Med Overseas Ed 2018;379:722–30. 10.1056/NEJMoa1805453 - DOI - PMC - PubMed
    1. Blackburn SD, Shin H, Freeman GJ, et al. Selective expansion of a subset of exhausted CD8 T cells by alphaPD-L1 blockade. Proc Natl Acad Sci U S A 2008;105:15016–21. 10.1073/pnas.0801497105 - DOI - PMC - PubMed
    1. Wherry EJ, Ha S-J, Kaech SM, et al. Molecular signature of CD8+ T cell exhaustion during chronic viral infection. Immunity 2007;27:670–84. 10.1016/j.immuni.2007.09.006 - DOI - PubMed

Publication types

Substances