. 2022 Dec;10(12):e005345.
doi: 10.1136/jitc-2022-005345.

Modeling resistance of colorectal peritoneal metastases to immune checkpoint blockade in humanized mice

Affiliations

Modeling resistance of colorectal peritoneal metastases to immune checkpoint blockade in humanized mice

Emre Küçükköse et al. J Immunother Cancer. 2022 Dec.

Abstract

Background: The immunogenic nature of metastatic colorectal cancer (CRC) with high microsatellite instability (MSI-H) underlies their responsiveness to immune checkpoint blockade (ICB). However, resistance to ICB is commonly observed, and is associated with the presence of peritoneal-metastases and ascites formation. The mechanisms underlying this site-specific benefit of ICB are unknown.

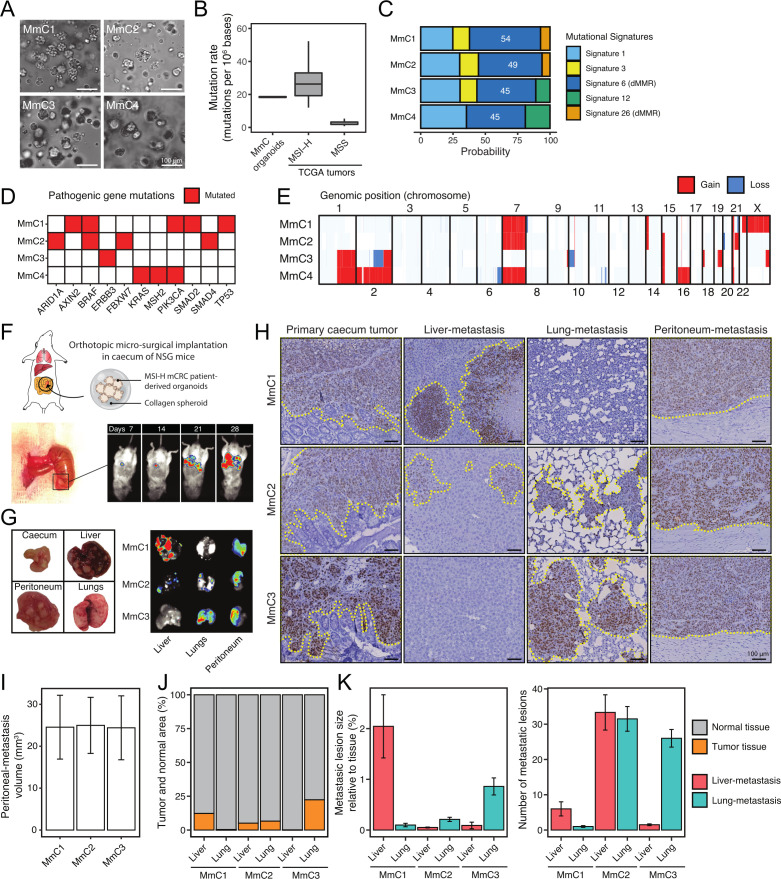
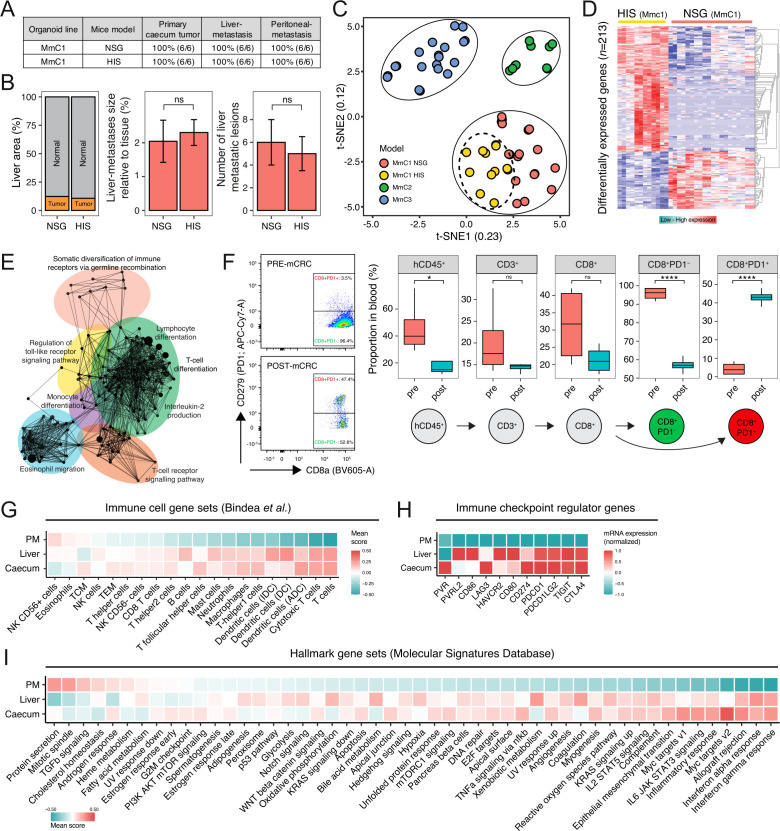
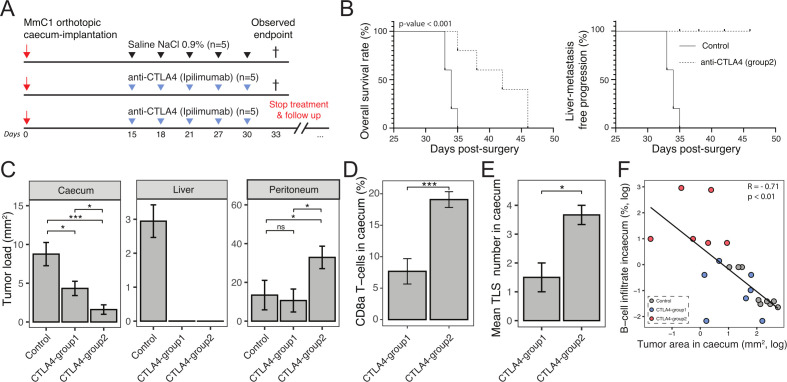
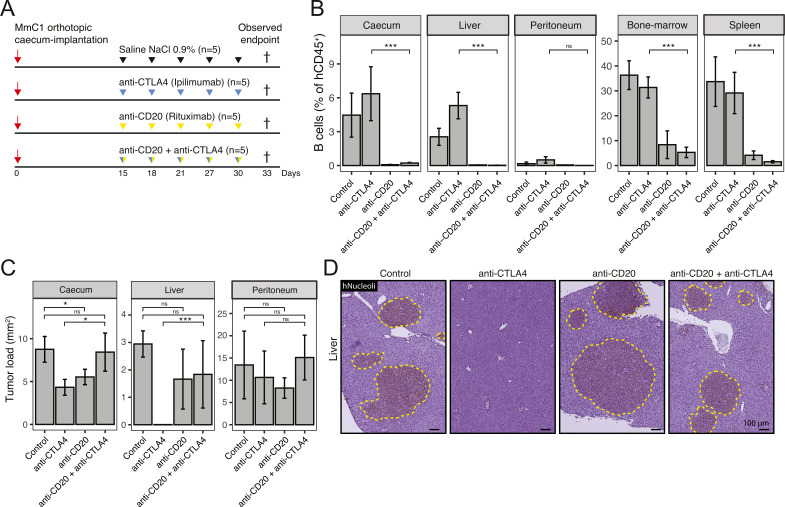
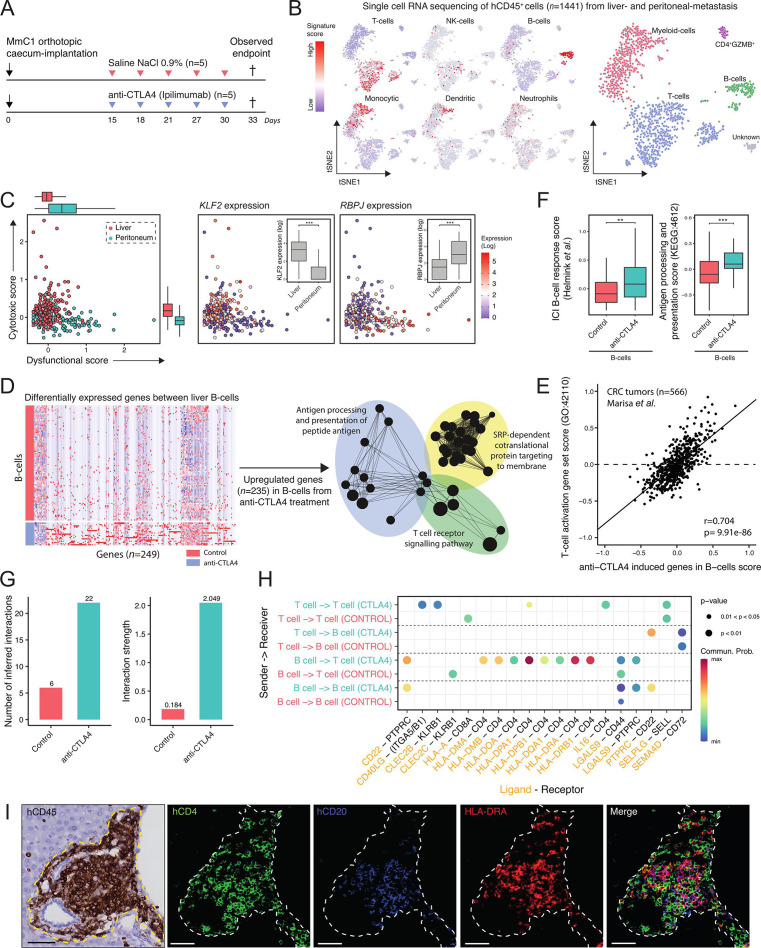
Methods: We created a novel model for spontaneous multiorgan metastasis in MSI-H CRC tumors by transplanting patient-derived organoids (PDO) into the cecum of humanized mice. Anti-programmed cell death protein-1 (PD-1) and anti-cytotoxic T-lymphocytes-associated protein 4 (CTLA-4) ICB treatment effects were analyzed in relation to the immune context of primary tumors, liver metastases, and peritoneal metastases. Immune profiling was performed by immunohistochemistry, flow cytometry and single-cell RNA sequencing. The role of B cells was assessed by antibody-mediated depletion. Immunosuppressive cytokine levels (interleukin (IL)-10, transforming growth factor (TGF)b1, TGFb2, TGFb3) were determined in ascites and serum samples by ELISA.

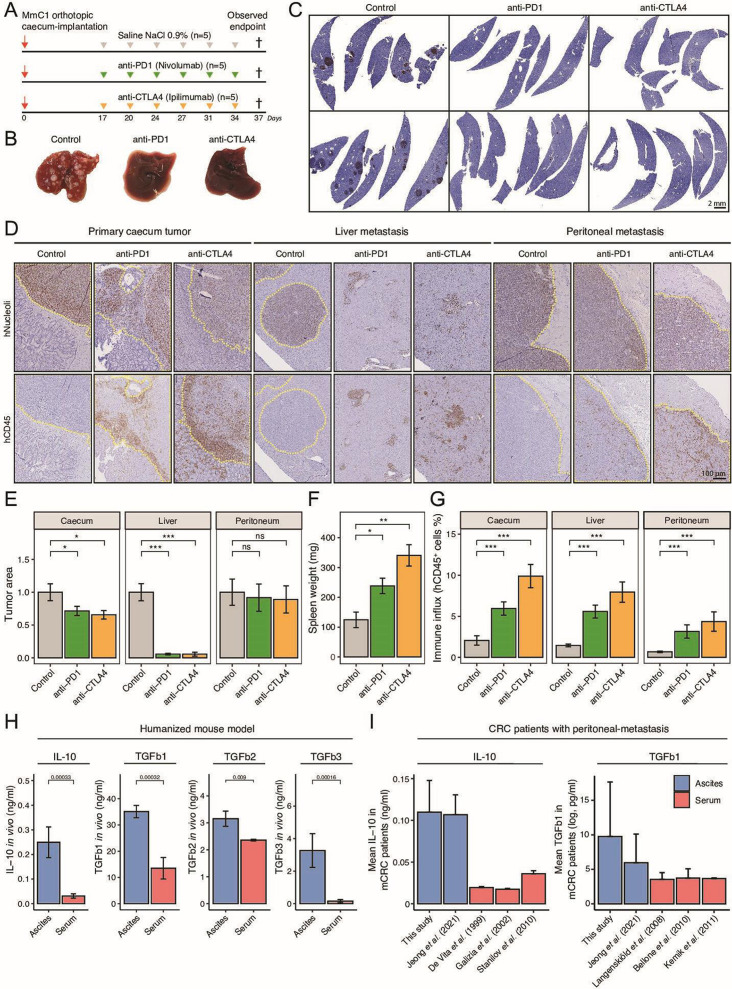
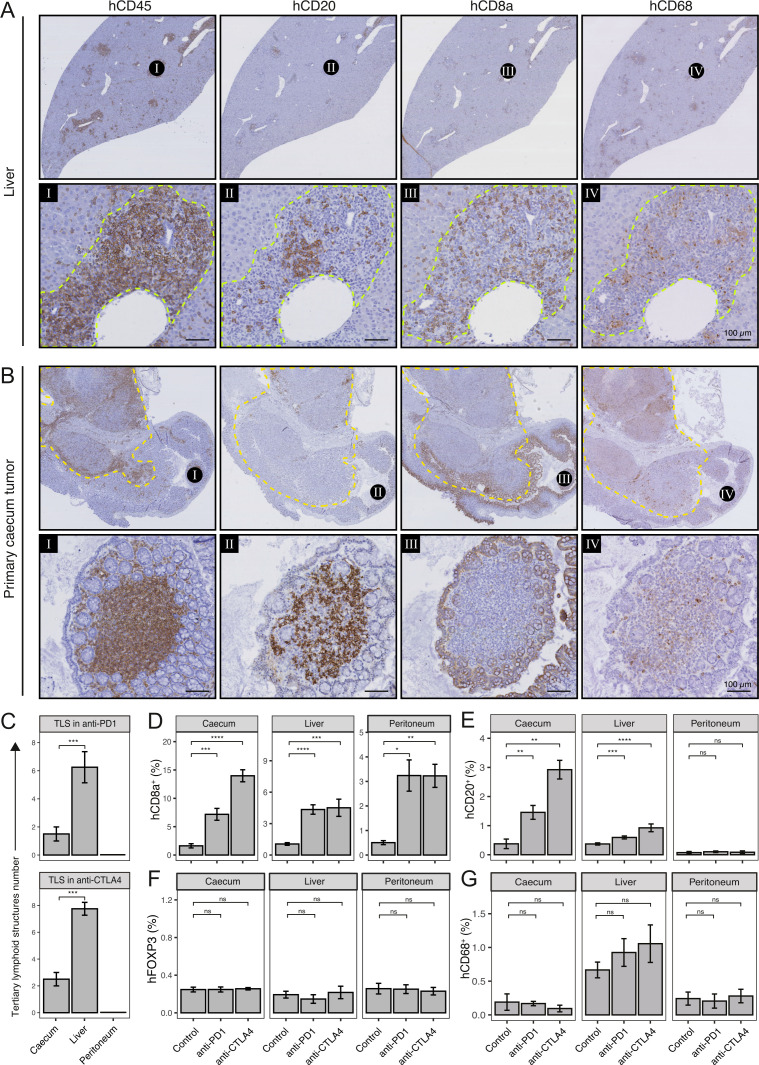
Results: PDO-initiated primary tumors spontaneously metastasized to the liver and the peritoneum. Peritoneal-metastasis formation was accompanied by the accumulation of ascites. ICB completely cleared liver metastases and reduced primary tumor mass but had no effect on peritoneal metastases. This mimics clinical observations. After therapy discontinuation, primary tumor masses progressively decreased, but peritoneal metastases displayed unabated growth. Therapy efficacy correlated with the formation of tertiary lymphoid structures (TLS)-containing B cells and juxtaposed T cells-and with expression of an interferon-γ signature together with the B cell chemoattractant CXCL13. B cell depletion prevented liver-metastasis clearance by anti-CTLA-4 treatment. Peritoneal metastases were devoid of B cells and TLS, while the T cells in these lesions displayed a dysfunctional phenotype. Ascites samples from patients with cancer with peritoneal metastases and from the mouse model contained significantly higher levels of IL-10, TGFb1, TGFb2 and TGFb3 than serum samples.

Conclusions: By combining organoid and humanized mouse technologies, we present a novel model for spontaneous multiorgan metastasis by MSI-H CRC, in which the clinically observed organ site-dependent benefit of ICB is recapitulated. Moreover, we provide empirical evidence for a critical role for B cells in the generation of site-dependent antitumor immunity following anti-CTLA-4 treatment. High levels of immunosuppressive cytokines in ascites may underlie the observed resistance of peritoneal metastases to ICB.

Keywords: B-lymphocytes; CTLA-4 antigen; immunotherapy; programmed cell death 1 receptor; tumor microenvironment.


Conflict of interest statement

Competing interests: EK, BAH, JV, AV, MC, SvH, IHMBR, CJAP, JL, HS, and OK have no conflicts of interest to disclose. SFB is the inventor on patents related to the Organoid Technology. SFB is employed by the Foundation Hubrecht Organoid Technology. MK reports having an advisory role for Nordic Farma, Merck-Serono, Pierre Fabre, Servier, and MSD and institutional scientific grants from Bayer, Bristol Myers Squibb, Merck, Nordic Farma, Pierre Fabre Roche, Servier, and Sirtex. JMLR reports having an advisory role for Merck-Serono, Pierre Fabre, Servier, MSD, Bayer, and Bristol Myers Squibb and institutional scientific grants from Bristol Myers Squibb, Pierre Fabre, Servier, and Hubrecht Organoid Technology. All grants were unrelated to the study and were paid to the individual’s institution.

Figures

Figure 1
Figure 1
MmC organoids recapitulate genomic characteristics of MSI-H CRC tumors and retain metastatic capacity with patient-specific organ tropism. (A) Brightfield microscopic images of MmC-PDOs. (B) Tumor mutation burden (non-synonymous mutations/mb) in MmC-PDOs and MSS/MSI-H CRC tumors (TCGA). (C) Mutational signature probabilities in MmC-PDOs, determined by the nucleotide mutation types. (D) Mutation status of genes significantly mutated in MSI-H CRC according to TCGA. Red indicates mutated genes. (E) Copy number profile of MmC-PDOs for each chromosome. Gain (red) and loss (blue) in genomic position are indicated. (F) Schematic overview of MmC-PDO implantation under the cecum serosa-layer in NOD.Cg-PrkdcscidIl2rgtm1Wjl /SzJ (NSG) mice. Tumor/metastasis are monitored by using bioluminescence of luciferase-transduced MmC-PDOs. (G) Formation of primary tumor at cecum-implanted site and metastases in liver, peritoneum, and lungs in MmC1-3 models. (H) Histological hNucleoli staining of primary cecum tumor, liver metastasis, lung metastasis, and peritoneum metastasis for MmC1-3 models. Dashed yellow line indicates tumor/metastasis area. Scale-bar 100 µm. (I) Peritoneum-metastasis volume (mm3), (J) total metastases area relative to normal tissue, (K) number, and metastasis lesion size for MmC1-3 models (hNucleoli quantification). Three independent experiments, n=5 mice per experiment. CRC, colorectal cancer; mCRC, metastatic CRC; MSI-H, high level microsatellite instability; MSS, microsatellite stable; PDOs, patient-derived organoids; TCGA, The Cancer Genome Atlas.
Figure 2
Figure 2
Preservation of metastasis patterns in humanized mice despite extensive influx of immune cells. (A) Comparison of NSG and HIS (humanized immune system) MmC1 mice models for tumor outgrowth and liver metastasis, and peritoneum metastasis, two independent experiments. (B) Histological quantification (hNucleoli) in NSG and HIS livers of MmC1 models, two independent experiments, n=6 mice per group. Mann-Whitney; ns, not significant. (C) t-SNE projection of RNA sequencing data of in vitro/vivo samples. (D) Differential gene expression analysis between NSG and HIS mice. Red indicates upregulated genes and blue vice versa. (E) Functionally grouped network with gene ontology terms as nodes of upregulated genes in HIS model (ClueGO Cytoscape). (F) Circulating immune populations in blood before/after implantation in HIS mice. Proportion of parent population shown (%). Mann-Whitney: *p<0.05; ****p<0.0001; ns, not significant. (G) Relative scores of immune cell gene sets, (H) immune checkpoint regulator genes, and (I) hallmark gene sets, representing biological states or processes in RNA sequencing data of primary cecum tumor, liver metastases and peritoneum metastases derived from HIS mice samples. Color indicates expression: red=high; blue=low. HIS, human immune system; mCRC, metastatic colorectal cancer; PD-1, programmed cell death protein-1, t-SNE, t-distributed stochastic neighbor embedding.
Figure 3
Figure 3
Eradication of liver metastasis but not peritoneal metastasis by ICB therapy. (A) Experimental protocol of treating HIS mice with anti-PD-1 (200 µg, i.p.) or anti-CTLA-4 (200 µg, i.p.), starting post 17 days orthotropic cecum-implantation. N=5 mice per group. All animals are sacrificed at the first observed endpoint of control mice. (B) Example livers of control, anti-PD-1-treated and anti-CTLA-4-treated mice at observed endpoint of control group. (C) Histological hNucleoli staining examples of liver sections from two different mice per group. Scale-bar is 2 mm (D) Histological hNucleoli (top) and hCD45 (bottom) staining of primary cecum tumor, liver metastasis, and peritoneum metastasis. Dashed yellow line indicates tumor/metastasis area. Scale-bar 100 µm. (E) Tumor/metastasis area (hNucleoli mm2 in cecum, liver, and peritoneum. (F) Splenic weight (mg) at observed endpoint of control group, representative for degree of splenomegaly. (G) Total immune infiltration (hCD45% relative to tissue) in cecum, liver, and peritoneum. (H) Immune suppressive cytokine levels of IL-10, TGFb1, TGFb2 and TGFb3 in ascites versus serum samples of HIS mice. (I) Mean IL-10 and TGFb1 concentration in ascites or serum samples of human patients with metastatic CRC. Data shown as mean±SEM. Mann-Whitney: *p<0.05; **p<0.01; ***p<0.001, ****p<0.0001; CRC, colorectal cancer; CTLA-4, cytotoxic T-lymphocytes-associated protein 4; HIS, human immune system; ICB, immune checkpoint blockade; IL, interleukin; i.p., intraperitoneal injection; mCRC, metastatic CRC; ns, not significant; PD-1, programmed death ligand-1; TGF, transforming growth factor.
Figure 4
Figure 4
Immune checkpoint blockade induces formation of tertiary lymphoid structures (TLS) and distinct tumor-infiltrating lymphocytes (TIL) populations. (A) Histological examples of TLS in liver and (B) cecum of anti-CTLA-4-treated mouse. Spatial information of immune cells (hCD45), B cells (hCD20), Cytotoxic T cells (hCD8a) and macrophages (hCD68) in TLS are shown. Dashed yellow line indicates primary tumor. Scale-bar of area zoom 100 µm. (C) Number of TLS in cecum, liver, and peritoneum of anti-PD-1 (top) and anti-CTLA-4-treated mice (bottom). (D) Cytotoxic T cell (hCD8a), (E) B cell (hCD20), (F) regulatory T cells (hFOXP3), and (G) macrophages (hCD68) infiltration (% relative to tissue) in cecum, liver, and peritoneum. Mann-Whitney: *p<0.05; **p<0.01; ***p<0.001; ****p<0.0001; CTLA-4, cytotoxic T-lymphocytes-associated protein 4; ns, not significant; PD-1, programmed death ligand-1, TIL, tumor-infiltrating lymphocytes.
Figure 5
Figure 5
Extended period of life after anti-CTLA-4 therapy discontinuation leads to further antitumor response and is associated with B cell influx and TLS formation. (A) Experimental protocol of treating human immune system mice with anti-CTLA-4 (200 µg, i.p.), starting post 15 day’s orthotropic cecum-implantation with 3 days interval. Inhibition with anti-CTLA-4 was discontinued at the observed endpoint (day 33) of the control group to monitor immune checkpoint blockade response. N=5 mice per group. (B) Kaplan-Meier: overall survival rate and liver metastasis-free progression. (C) Tumor/metastases area (hNuceloli mm2 in cecum, liver, and peritoneum. (D) CD8a T cell infiltration in primary cecum tumor in CTLA-4-group 1 and CTLA-4-group 2 animals. (E) Number of TLS formation in cecum in CTLA-4-group 1 and CTLA-4-group 2 animals. Mann-Whitney: *p<0.05; **p<0.01; ***p<0.001; ****p<0.0001; ns, not significant. (F) Negative correlation with tumor area (mm2) and B cell infiltrate (%) in cecum, log-scaled. Gray=control, blue=CTLA-4-group 1 and red=CTLA-4-group 2. CTLA-4, cytotoxic T-lymphocytes-associated protein 4; i.p., intraperitoneal injection; TLS, tertiary lymphoid structures.
Figure 6
Figure 6
Depletion of B cells results in a significant decrease of antitumor response in anti-CTLA-4 treatment. (A) Experimental protocol of treating human immune system mice with anti-CTLA-4 (200 µg, i.p.), anti-CD20 (300 µg, i.p.) or combination, starting post 15 days orthotropic cecum-implantation with 3 days interval. N=5 mice per group. All animals are sacrificed at the first observed endpoint (t=33 days) of control mice. (B) B cell (hCD20) population (percentage of hCD45+ cells) in cecum, liver, peritoneum, bone-marrow, and spleen samples, determined by flow cytometry. (C) Tumor/metastases area (hNucleoli mm2 in cecum, liver, and peritoneum. Mann-Whitney: *p<0.05; **p<0.01; ***p<0.001; ****p<0.0001; ns, not significant. (D) Histological (hNucleoli) examples of liver metastases, scale-bar is 100 µm. CTLA-4, cytotoxic T-lymphocytes-associated protein 4; i.p., intraperitoneal.
Figure 7
Figure 7
Immune checkpoint blockade induces site-specific transcriptional reprogramming in T cells and the formation of antigen-presenting B cells in TLS. (A) Experimental protocol of treating human immune system mice with anti-CTLA-4 (200 µg, i.p.), starting post 15 day’s orthotropic cecum-implantation with 3 days interval. All animals are sacrificed at the first observed endpoint (t=33 days) of control mice. Immune cells (hCD45+) from liver metastasis and peritoneum metastasis were sorted for single-cell RNA sequencing. i.p. intraperitoneal injection. (B) t-SNE projection of single-cell RNA sequencing log-transformed counts on all detectable genes in hCD45+ cells. Scores of microenvironment cell populations, including cell types: T cell, NK cell, B cell, monocytic, dendritic and neutrophil. (C) Cytotoxic-scores and dysfunctional-scores for T cells of liver (red) and peritoneum (blue) tissue. Expression (log) of associated transcription-factors KLF2 and RBPJ with cytotoxic- and dysfunctional scores, respectively. Mann-Whitney: **p<0.01; ***p<0.001. (D) Differential gene expression analysis between B cells from control and anti-CTLA-4-treated mice. Red and blue colors indicate upregulated and downregulated genes, respectively. Functional network analysis using ClueGO Cytoscape and gene ontology terms as nodes of upregulated genes (n=235) in anti-CTLA-4-treated derived B cells. (E) Positive correlation with anti-CTLA-4 induced genes in B cells signature and ‘T cell activation’ signature in a CRC cohort. (F) Boxplots showing expression of a B cell gene signature associated with response to ICB therapy, and genes in the ‘antigen processing and presentation’ pathway (KEGG: hsa04612) in B cells in control and anti-CTLA-4-treated mice. (G) Inference and analysis of cell–cell communication using CellChat. Bar plot represents the total number of inferred interactions (left) and interaction strength (right) of B and T cells derived from livers of control (red) or anti-CTLA-4 treated (blue) mice. (H) Bubble plot representing the communication probabilities for the identified ligand-receptor interactions between cell groups. (I) Histological analysis of HLA-DRA+ B cells juxtaposed to CD4+ T cells in TLS in anti-CTLA-4-treated mouse livers. Scale-bar 50 µm. CRC, colorectal cancer; CTLA-4, cytotoxic T-lymphocytes-associated protein 4; ICB, immune checkpoint blockade; i.p., intraperitoneal; NK, natural killer; TLS, tertiary lymphoid structures, t-SNE, t-distributed stochastic neighbor embedding.

References

    1. Venderbosch S, Nagtegaal ID, Maughan TS, et al. . Mismatch repair status and BRAF mutation status in metastatic colorectal cancer patients: a pooled analysis of the CAIRO, CAIRO2, COIN, and FOCUS studies. Clin Cancer Res 2014;20:5322–30. 10.1158/1078-0432.CCR-14-0332 - DOI - PMC - PubMed
    1. Kim CG, Ahn JB, Jung M, et al. . Effects of microsatellite instability on recurrence patterns and outcomes in colorectal cancers. Br J Cancer 2016;115:25–33. 10.1038/bjc.2016.161 - DOI - PMC - PubMed
    1. Tran B, Kopetz S, Tie J, et al. . Impact of BRAF mutation and microsatellite instability on the pattern of metastatic spread and prognosis in metastatic colorectal cancer. Cancer 2011;117:4623–32. 10.1002/cncr.26086 - DOI - PMC - PubMed
    1. Sharma P, Allison JP. Dissecting the mechanisms of immune checkpoint therapy. Nat Rev Immunol 2020;20:75–6. 10.1038/s41577-020-0275-8 - DOI - PubMed
    1. Chalabi M, Fanchi LF, Dijkstra KK, et al. . Neoadjuvant immunotherapy leads to pathological responses in MMR-proficient and MMR-deficient early-stage colon cancers. Nat Med 2020;26:566–76. 10.1038/s41591-020-0805-8 - DOI - PubMed

Publication types

Substances