. 2022 Dec 21;13(1):7844.
doi: 10.1038/s41467-022-35373-4.

Calcium-permeable channelrhodopsins for the photocontrol of calcium signalling

Affiliations

Calcium-permeable channelrhodopsins for the photocontrol of calcium signalling

Rodrigo G Fernandez Lahore et al. Nat Commun. .

Erratum in

Abstract

Channelrhodopsins are light-gated ion channels used to control excitability of designated cells in large networks with high spatiotemporal resolution. While ChRs selective for H+, Na+, K+ and anions have been discovered or engineered, Ca2+-selective ChRs have not been reported to date. Here, we analyse ChRs and mutant derivatives with regard to their Ca2+ permeability and improve their Ca2+ affinity by targeted mutagenesis at the central selectivity filter. The engineered channels, termed CapChR1 and CapChR2 for calcium-permeable channelrhodopsins, exhibit reduced sodium and proton conductance in connection with strongly improved Ca2+ permeation at negative voltage and low extracellular Ca2+ concentrations. In cultured cells and neurons, CapChR2 reliably increases intracellular Ca2+ concentrations. Moreover, CapChR2 can robustly trigger Ca2+ signalling in hippocampal neurons. When expressed together with genetically encoded Ca2+ indicators in Drosophila melanogaster mushroom body output neurons, CapChRs mediate light-evoked Ca2+ entry in brain explants.


Conflict of interest statement

The authors declare no competing interests.

Figures

Fig. 1
Fig. 1. Calcium flux at high [Ca2+]e in selected CCRs.
A CrChR2 crystal structure (PDB ID: 6EID, 10.2210/pdb6EID/pdb) with proposed ion permeation pathway (black arrow) and water densities after 10 ns MD simulation (grey mesh). Amino acids in stick representation have been previously associated with calcium permeation. Insets, right: H3 and H4) Helix 3 and Helix 4 with residues L132, D156 and F219 (Helix 6) and Central Gate) Central Gate formed by S63, E90 and N258. B Unrooted phylogenetic tree of chlorophyte CCRs. Coloured entries represent ChRs with calcium measurements in panels (C) and (D). Overview of depicted CCRs can be found in Supplementary Fig. 1. C Fura-2 imaging of calcium influx for different ChRs expressed in Fura-2-AM loaded ND7/23 cells probed with 10 s of 470 nm illumination (~0.08 mW/mm2, saturating conditions for C2-LC, indicated by blue bar) at 70 mM [CaCl2]e (mean ± SEM). D Quantified peak responses (as in panel C) after 10 s of illumination. Each dot represents one cell (mean ± SEM). Number of replicates: bReaCh-ES: n = 78; ChRmine: n = 37; C1C2: n = 45; CheRiff: n = 97; ReaChR: n = 89; ChRoME: n = 104; C1V1: n = 72; PsChR: n = 33; CrChR2: n = 104; TsChR: n = 49; C2-LC: n = 91; CoChR: n = 43. n = X biologically independent cells. EC extracellular, IC intracellular, R340/380 Fura-2 ratio, R0 Fura-2 ratio of first acquisition.
Fig. 2
Fig. 2. Engineering of Calcium-permeable ChannelRhodopsins (CapChRs).
A Design strategy for CapChR1 (green) and CapChR2 (orange). Pore helices coloured in dark grey and miscellaneous helices in light grey. B and C Exemplary CapChR2 homology model depicting mutated residues and their intended effects (based on structure data, PDB ID: 6EID, 10.2210/pdb6EID/pdb). Grey mesh represents water accessibility according to MD simulations. D and H Representative photocurrent traces of CapChR1 (green) and CapChR2 (orange) respectively, recorded from −80 to +40 mV in 20 mV steps in ND7/23 cells (blue bar: illumination with saturating, 470 nm light; ~1.9 mW/mm²). E and I Current–voltage relationships for CapChR1 and CapChR2 under varying extracellular conditions (shadows represent the SEM; normalized to high [NaCl]e at −80 mV). F and J Stationary photocurrents for CapChR1 and CapChR2 at the designated extracellular conditions (mean ± SEM). G and K Estimated reversal potential (Erev) for CapChR1 and CapChR2 at the designated ionic conditions (Box middle line: Mean; Box outer edges ± SEM; Box whiskers: 1.5 × SEM). Number of replicates in E [NaCl]e: n = 14; [CaCl2]e: n = 12; [NMGCl]e: n = 6, in F) [NaCl]e: n = 14; [CaCl2]e pH 7.2: n = 12; [CaCl2]e pH 9: n = 5; [NMGCl]e: n = 5; [KCl]e: n = 3; [MgCl2]e: n = 4, in G) ([NaCl]e: n = 14; [CaCl2]e pH 7.2: n = 12; [CaCl2]e pH 9: n = 5; [NMGCl]e: n = 6; [KCl]e: n = 3; [MgCl2]e: n = 4), in I) ([NaCl]e: n = 10; [CaCl2]e: n = 7; [NMGCl]e: n = 6), in J [NaCl]e: n = 10; [CaCl2]e pH 7.2: n = 7; [CaCl2]e pH 9: n = 5; [NMGCl]e: n = 6; [KCl]e: n = 3; [MgCl2]e: n = 3, in K) [NaCl]e: n = 10; [CaCl2]e pH 7.2: n = 7; [CaCl2]e pH 9: n = 5; [NMGCl]e: n = 6; [KCl]e: n = 3; [MgCl2]e: n = 3. n = X biologically independent cells. EC extracellular, IC intracellular.
Fig. 3
Fig. 3. Calcium vs. sodium permeation in C2-LC, CapChR1 and CapChR2.
AC Representative photocurrents traces of C2-LC (red), CapChR1 (green) and CapChR2 (orange), respectively, recorded from −80 to +40 mV in 20 mV steps at different calcium/sodium concentrations in ND7/23 cells (blue bar: illumination with saturating, 470 nm light; ~1.9 mW/mm2). DF I(E) relationships with estimated reversal potentials (insets, Box middle line: Mean; Box outer edges ± SEM; Box whiskers: 1.5 × SEM) for the tested ChRs at the designated ionic conditions (mean ± SEM, normalized to currents at −80 mV and 0 mM [CaCl2]e). Dots represent mean values and shading the SEM (p values for D, E and G: C2-LC p = 5.52 × 10−10; CapChR1 p = 4.06 × 10−5; CapChR2 p = 0.04). GI Left: Normalized photocurrents at −80 mV holding potential and at the denoted [CaCl2]e in the presence of sodium. Bars represent the mean ± SEM and dots represent single measurements. Right: Channel closure kinetics at the denoted [CaCl2]e in the presence of sodium (τoff). Lines and bars represent the mean ± SEM and dots represent single measurements). Number of replicates for photocurrents in DI C2-LC: n = 3 in all conditions; CapChR1: n = 6 in all conditions; CapChR2: n = 5 in all conditions, for τoff in GI C2-LC/CapChR1/CapChR2: 144 mM [NaCl]e/0 mM [CaCl2]e: n = 3/5/4, 140 mM [NaCl]e/2 mM [CaCl2]e: n = 4/6/5, 134 mM [NaCl]e/5 mM [CaCl2]e: n = 5/7/9, 124 mM [NaCl]e/10 mM [CaCl2]e: n = 6/8/11, 1 mM [NaCl]e/70 mM [CaCl2]e: n = 11/12/13. p values for GI (left/right): C2-LC P = 3.33 × 10−4; CapChR1 P = 2.63 × 10−6/1.46 × 10−6; CapChR2 P = 0.01/3.93 × 10−5. Two-sided two-group t-test (control: 144 mM [Na+]e/0 mM [Ca2+]e): *P ≤ 0.05, **P ≤ 0.01, ***P ≤ 0.001, ****P ≤ 0.0001. n = X biologically independent cells.
Fig. 4
Fig. 4. Ca2+-flux at physiological levels of [CaCl2]e in ND7/23 cells.
AC Fura-2-AM imaging on CoChR WT (blue), C2-LC (red), CapChR1 (green) and CapChR2 (orange). A Overview of the experimental setup: Fura-2-AM loaded ND7/23 cells with a resting membrane potential were illuminated with 470 nm (~0.08 mW/mm2, saturating light intensities) light to allow an influx of calcium ions through the expressed ChR in the presence and absence of bath Mg2+. B Mean imaging response of the denoted constructs under the two measured conditions (mean as coloured line and shadows represent SEM). C Quantified peak responses after 10 s of illumination. Single dots on the right of the columns represents one cell under those conditions (Bar: mean ± SEM). Number of replicates in (B) and (C) (+Mg2+/−Mg2+): CoChR n = 30/30; C2-LC n = 32/30; CapChR1: n = 21/21; CapChR2: n = 24/21. Two-sided, unpaired Wilcoxon–Mann–Whitney-Test: *P ≤ 0.05, **P ≤ 0.01, ***P ≤ 0.001, ****P ≤ 0.0001. P values for comparison to C2-LC in C: CoChR P = 0.35; CapChR1 P = 0.44; CapChR2 P = 5.07 × 10−10. DH Voltage-clamped calcium imaging on CapChR1 and 2. D Experimental design for voltage-clamped measurements on ND7/23 cells. Cells were loaded with membrane-impermeable Fura-2 via the patch pipette (internal buffer: 110 mM [NaCl]i and divalent cation free, see the “Methods” section). A baseline measurement was started for both the 380 and 340 nm channels (5 acquisitions), with subsequent 470 nm illumination (100 ms, ~0.08 mW/mm2, ~0.008 mJ/mm² per F340/380 ratio acquisition, saturating illumination for both CapChRs) to measure calcium influx through the CapChRs. A membrane voltage of −80 mV was applied at each illumination cycle. E Calcium imaging response (ratio of 340/380 nm fluorescence; R340/380) for both CapChRs at physiological pH and ion concentrations. F Fluorescence change (ΔR) after 100 ms of illumination at −80 mV holding potential. G and H Fluorescence change (ΔR) for CapChR1 (green) and CapChR2 (orange) after 100 ms of illumination at −80 mV holding potential and at different extracellular calcium and sodium concentrations. Box middle line: Mean; Box outer edges ± SEM; Box whiskers: 1.5 × SEM. Number of replicates in G and H: CapChR1/CapChR2: 144 mM [NaCl]e/0 mM [CaCl2]e: n = 7/8, 143.8 mM [NaCl]e/0.1 mM [CaCl2]e: n = 7/6, 143 mM [NaCl]e/0.5 mM [CaCl2]e: n = 7/6, 142 mM [NaCl]e/1 mM [CaCl2]e: n = 6/5, 140 mM [NaCl]e/2 mM [CaCl2]e: n = 45/29, 134 mM [NaCl]e/5 mM [CaCl2]e: n = 7/9, 124 mM [NaCl]e/10 mM [CaCl2]e: n = 6/11, 104 mM [NaCl]e/20 mM [CaCl2]e: n = 8/5. n = X biologically independent cells. AU arbitrary units.
Fig. 5
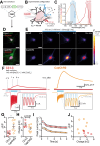
Fig. 5. Quantification of light-driven Ca2+ flux in neurons.
A Design of the AAV-expression vector with YFP fused to the opsins. B Whole-cell voltage-clamp experiments allowed direct perfusion of the Cal-630 indicator, with high loading efficiency in the soma. C Exemplary activation spectra of CapChR2, the excitation spectrum of Cal-630 and the band-pass filtered light for ChR and Cal-630 excitation. CapChR2 action spectra reproduced from Supplementary Fig. 10, with n = 6, the excitation spectrum of Cal-630 provided by the manufacturer. D Exemplary live-cell wide-field images of neurons expressing C2-LC-YFP or CapChR2-YFP, overlaid with a maximum intensity projection of the Cal-630 signal obtained during the recording session (scale bars: 10 µm). E Fluorescent images of the Cal-630 signal before (−2 s), after 1 or 4 s of blue light flashes, or 18 s after blue-light illumination from the cells shown in C (scale bars: 10 µm). F Single-trial intensity profiles of somatic Ca2+ signals evoked by 20 50-ms flashes of 470 nm (1 mW/mm2, saturating conditions) at 5 Hz in a C2-LC (red) or CapChR2 (yellow)-expressing neuron. Simultaneously recorded currents are shown underneath. Insets show the current decay after the last light flash. G Comparison of the maximum ΔF/F0 evoked by blue-light flashes (C2-LC, n = 6; CapChR2, n = 7; unpaired, two-tailed t-test: p = 0.012). H Quantification of the total charge transfer evoked by the opsin stimulation (C2-LC, n = 6; CapChR2, n = 7 unpaired, two-tailed t-test: p = 0.063, no adjustment for multiple comparisons). I Time course of peak currents evoked by 470 nm flashes in C2-LC and CapChR2-expressing neurons (C2-LC, n = 6; CapChR2, n = 7). J Scatter plot of the light-evoked charge transfer against the maximum Ca2+ signal within single cells. Graphs depict the mean ± SEM. *P ≤ 0.05, **P ≤ 0.01, ***P ≤ 0.001, ****P ≤ 0.0001. n = X biologically independent cells. AU arbitrary units.
Fig. 6
Fig. 6. Electrophysiological characterization of CapChRs in organotypic hippocampal slice culture.
A Construct design and fluorescent confocal micrographs showing organotypic hippocampal cultures (DIV 20) transduced with AAVs-expressing mScarlet-tagged ChRs. All three constructs C2-LC, CapChR1 and CapChR2 were homogeneously expressed throughout the hippocampal tissue after 3–4 days post-transduction (example shown for CapChR2). B Representative whole cell current traces depicting the effects of 500 ms of 490 nm (1–2 mW/mm2, saturating) light exposure at different calcium concentrations. C Charge transfer (normalized to values at 0 mM [CaCl2]e) between 1 and 2 s of illumination (n = 4 for C2-LC; n = 5 for CapChR1; n = 4 for CapChR2). D Photocurrents from CapChR2 in presence of blockers and the total charge transfer in % of the control. Apamin (Apam; 10 µM) Paxilline (PAX; 10 µM) (n = 3), Ryanodine (Ry, 50 µM) (n = 4) and Niflumic Acid (NFA, 0.5 mM, n = 4). E Effects of NFA application on photocurrents of C2-LC (n = 7), CapChR1 (n = 6) and CapChR2 (n = 7). F Exemplary whole cell voltage traces of CapChR2-expressing neurons, depicting the effects of 1 s of 490 nm light exposure in current clamp mode in the presence or absence of NFA in the bath solution. G Number of spikes elicited during illumination in (F) (mean, ±SEM; n = 4 cells). H Summary of the effect of NFA on pyramidal cell depolarization (mean, ±SEM; n = 4). I Schematic representation of the physiological response in CapChR2-expressing slices. Calcium entry via CapChR2 elicits calcium store release and activates calcium-activated chloride channels (TMEM16). Graphs depict the mean ± SEM. n = X biologically independent cells. AU arbitrary units, EC extracellular, IC intracellular, ER endoplasmic reticulum.
Fig. 7
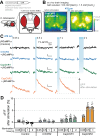
Fig. 7. Targeted activation of CapChR2 reliably elicits calcium influx to single Drosophila neurons.
A Expression of UAS-CapChR1, UAS-CapChR2 and UAS-CrChR2 was targeted to M4/6 mushroom body output neurons using the VT1211-Gal4 driver line. B Blue-light (470 nm, ~4.5 mW/cm2) activation of CapChR2 elicits marked calcium increase in M4/6 neurons, measured with co-expressed jRCaMP1a in Drosophila explant brain preparations. C Example jRCaMP1a fluorescence traces following blue-light pulses of indicated duration (blue bars). D Fluorescence signal quantification following blue-light stimulation. For 0.05 s, 0.5 and 1 s of blue light excitation n = 16 for CapChR1, n = 13 for CapChR2, n = 10 for CrChR2 (C2) and n = 8 for the control. For 2 s blue light excitation n = 12 for CapChR1, n = 7 for CrChR2 and n = 6 for the control. Bar charts depict the mean ± SEM. n = X biologically independent flies. AU arbitrary units.
Fig. 8
Fig. 8. Proposed model for Ca2+-permeation and inward rectification in CapChR2 based on MD simulations.
A Stable binding of Ca2+ to E81 in the absence of membrane voltage (Vm) and no illumination. B Upon the application of a negative membrane potential, a second Ca2+ ion binds to E81 and the first ion is displaced into the pore (“knock-on”), where it binds E77 and flips towards the central gate. C Isomerization of the retinal allows the deprotonation of E70 and D43 with the help of Ca2+, which interacts with both carboxyl groups. Further along the putative permeation pathway is E238, which might assist in continued passage through the pore. These interactions are only possible when ions permeate from the extracellular side (EC) to the intracellular side (IC).

References

    1. Nagel, G. et al. Channelrhodopsin-1: a light-gated proton channel in green algae. Science296, 2395–2398 (2002). - PubMed
    1. Nagel, G. et al. Channelrhodopsin-2, a directly light-gated cation-selective membrane channel. Proc. Natl Acad. Sci. USA100, 13940–13945 (2003). - PMC - PubMed
    1. Vierock, J., Grimm, C., Nitzan, N. & Hegemann, P. Molecular determinants of proton selectivity and gating in the red-light activated channelrhodopsin Chrimson. Sci. Rep.7, 9928 (2017). - PMC - PubMed
    1. Govorunova, E. G., Sineshchekov, O. A., Li, H., Janz, R. & Spudich, J. L. Characterization of a highly efficient blue-shifted channelrhodopsin from the marine alga Platymonas subcordiformis. J. Biol. Chem.288, 29911–29922 (2013). - PMC - PubMed
    1. Wietek, J. et al. Conversion of channelrhodopsin into a light-gated chloride channel. Science344, 409–412 (2014). - PubMed

Publication types

LinkOut - more resources