. 2022 Dec 21;13(1):7845.
doi: 10.1038/s41467-022-35265-7.

Biomolecular condensate phase diagrams with a combinatorial microdroplet platform

Affiliations

Biomolecular condensate phase diagrams with a combinatorial microdroplet platform

William E Arter et al. Nat Commun. .

Abstract

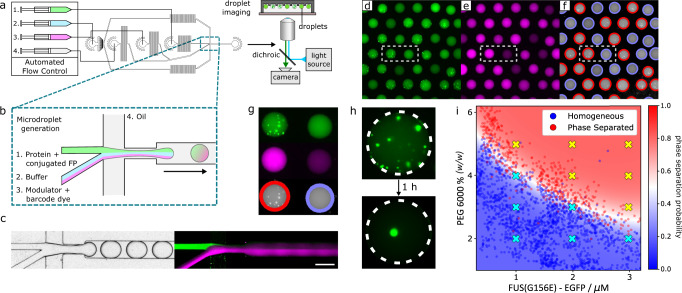
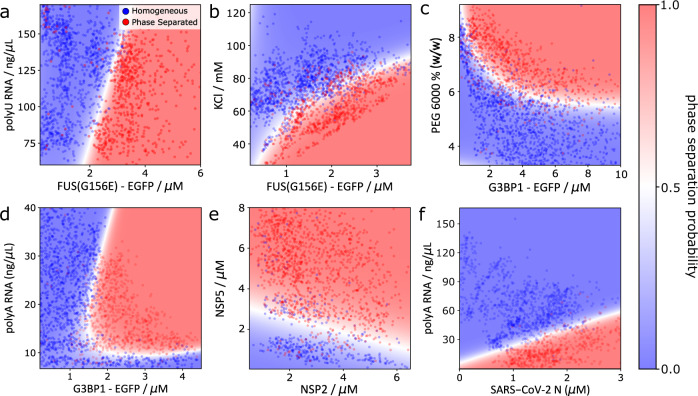
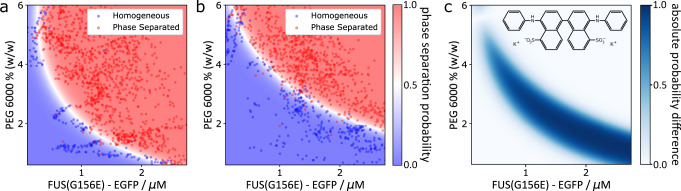
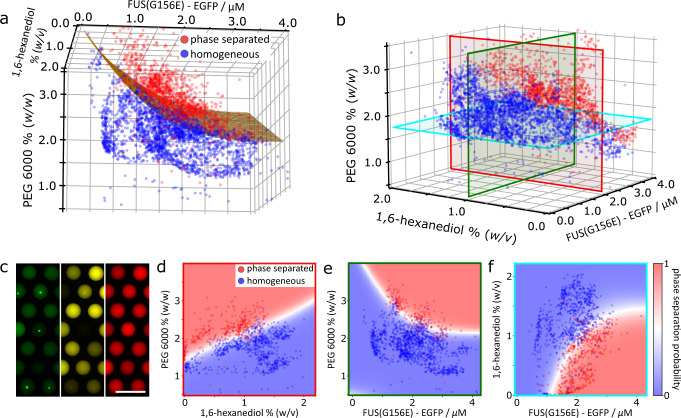
The assembly of biomolecules into condensates is a fundamental process underlying the organisation of the intracellular space and the regulation of many cellular functions. Mapping and characterising phase behaviour of biomolecules is essential to understand the mechanisms of condensate assembly, and to develop therapeutic strategies targeting biomolecular condensate systems. A central concept for characterising phase-separating systems is the phase diagram. Phase diagrams are typically built from numerous individual measurements sampling different parts of the parameter space. However, even when performed in microwell plate format, this process is slow, low throughput and requires significant sample consumption. To address this challenge, we present here a combinatorial droplet microfluidic platform, termed PhaseScan, for rapid and high-resolution acquisition of multidimensional biomolecular phase diagrams. Using this platform, we characterise the phase behaviour of a wide range of systems under a variety of conditions and demonstrate that this approach allows the quantitative characterisation of the effect of small molecules on biomolecular phase transitions.


Conflict of interest statement

Parts of this work pertaining to the encapsulation and analysis of phase-separating macromolecules within microdroplets have been the subject of a patent publication (application number GB2021051243W, publication number WO2021234410A1) filed by Cambridge Enterprise Limited, a fully owned subsidiary of the University of Cambridge, W.E.A., G.K., T.J.W., R.Q. and T.P.J.K. are inventors. T.P.J.K. and P.St.G.-H. are founders, and W.E.A., G.K. T.J.W. and R.Q. are consultants and/or employees of Transition Bio Ltd. The remaining authors declare no competing interests.

Figures

Fig. 1
Fig. 1. PhaseScan workflow.
a Droplets are generated using a flow-focussing microfluidic device controlled by automated syringe pumps and then imaged in wells by fluorescence microscopy. b At the droplet generating junction, aqueous solutions are combined under laminar flow before droplet formation. c Brightfield microscopy image of droplet generation (left) and combined fluorescence images of droplet generation (right) showing fluorescence of EGFP (green) and Alexa647 (magenta) barcodes for FUSG156E and PEG, respectively. d, e Epifluorescence microscopy images of trapped microdroplets, with EGFP and Alexa647 fluorescence corresponding to FUSG156E and PEG concentration, respectively. f Classification of droplets as phase separated (red outline) or homogeneous (blue outline) according to distribution of EGFP fluorescence. g Phase separated (left) and homogeneous (right) microdroplets imaged according to EGFP (top) and Alexa647 fluorescence (middle) and subsequent phase separation classification (bottom). Images correspond to the highlighted regions in (df). h Liquid condensates merge over time in microdroplets. i Phase diagram of EGFP-FUSG156E vs. PEG 6000 concentration, 50 mM Tris pH 7.4, 150 mM KCl. Red and blue data points in the scatter plot correspond to individual microdroplets classified as phase separated or homogeneous, respectively. The heat map corresponds to the probability of phase separation as determined by an SVM classifier trained on the droplet scatter plot. N = 2754 droplets. Yellow and cyan crosses correspond to phase separated and homogeneous behaviour as determined by manual pipetting experiment. Source data are provided as a Source Data file. Parts of this figure are reproduced with permission from Geiger et al..
Fig. 2
Fig. 2. Application of PhaseScan to a variety of condensate systems.
a Phase diagram of EGFP-tagged FUSG156E vs. polyU RNA concentration. N = 2096 droplets. b Phase diagram of FUSG156E condensation as a function of protein and salt concentration. N = 2625 droplets. c Phase diagram of EGFP-tagged G3BP1 vs. PEG 6000 concentration. N = 2549 droplets. d Phase diagram for polyA RNA-mediated phase separation G3BP1. N = 3077 droplets. e Phase diagram for coacervation-condensation of rotavirus proteins NSP2 and NSP5. N = 1672 droplets. f Phase diagram for polyA RNA-mediated phase separation of SARS-CoV-2 N protein. N = 1599 droplets. Red and blue data points in scatter plots correspond to individual microdroplets classified as phase separated or homogeneous, respectively. The heat map corresponds to the probability of phase separation as determined by an SVM classifier trained on the droplet scatter plot. Source data are provided as a Source Data file.
Fig. 3
Fig. 3. Probing the effect of small molecule modulators on phase separation using PhaseScan.
a Phase diagram of EGFP-tagged EGFP-tagged FUSG156E vs. PEG 6000 concentration in the absence of bis-ANS. N = 1616 droplets. b Phase diagram of EGFP-tagged EGFP-tagged FUSG156E vs. PEG 6000 concentration in the presence of bis-ANS. N = 2559 droplets. c Molecular structure of bis-ANS and differential phase diagram of homotypic FUS phase diagram ± bis-ANS. Red and blue data points in scatter plots correspond to individual microdroplets classified as phase separated or homogeneous, respectively. The heat map corresponds to the probability of phase separation as determined by an SVM classifier trained on the droplet scatter plot. Source data are provided as a Source Data file.
Fig. 4
Fig. 4. Generation of multidimensional phase diagrams using the PhaseScan platform.
a, b 3D phase diagram of EGFP-tagged FUSG156E vs. PEG 6000 vs. 1,6-HD concentration. N = 3904 droplets. c Epifluorescence microscopy images of trapped microdroplets with EGFP (green), Alexa546 (yellow), and Alexa647 (red) fluorescence corresponding to FUSG156E and 1,6-HD, and PEG concentrations, respectively. df 2D slices of the 3D phase diagram, with outline colours corresponding to the red, green and blue planes shown in (b), respectively. Red and blue data points in scatter plots correspond to individual microdroplets classified as phase separated or homogeneous, respectively. The heat map corresponds to the probability of phase separation as determined by an SVM classifier trained on the droplet scatter plot. Source data are provided as a Source Data file.

References

    1. Boeynaems S, et al. Protein phase separation: a new phase in cell biology. Trends Cell Biol. 2018;28:420–435. doi: 10.1016/j.tcb.2018.02.004. - DOI - PMC - PubMed
    1. Hyman AA, Weber CA, Jülicher F. Liquid-liquid phase separation in biology. Annu Rev. Cell Dev. Biol. 2014;30:39–58. doi: 10.1146/annurev-cellbio-100913-013325. - DOI - PubMed
    1. Shin, Y. & Brangwynne, C. P. Liquid phase condensation in cell physiology and disease. Science. 357, 6357 (2017) - PubMed
    1. Banani, S. F., Lee, H. O., Hyman, A. A. & Rosen, M. K. Biomolecular condensates: organizers of cellular biochemistry. Nat. Rev. Mol. Cell Biol.18, 285–298 (2017). - PMC - PubMed
    1. Sokolova E, et al. Enhanced transcription rates in membrane-free protocells formed by coacervation of cell lysate. Proc. Natl Acad. Sci. USA. 2013;110:11692–11697. doi: 10.1073/pnas.1222321110. - DOI - PMC - PubMed

Publication types