. 2022 Dec 21;13(1):7791.
doi: 10.1038/s41467-022-35388-x.

Huntington disease oligodendrocyte maturation deficits revealed by single-nucleus RNAseq are rescued by thiamine-biotin supplementation

Affiliations

Huntington disease oligodendrocyte maturation deficits revealed by single-nucleus RNAseq are rescued by thiamine-biotin supplementation

Ryan G Lim et al. Nat Commun. .

Abstract

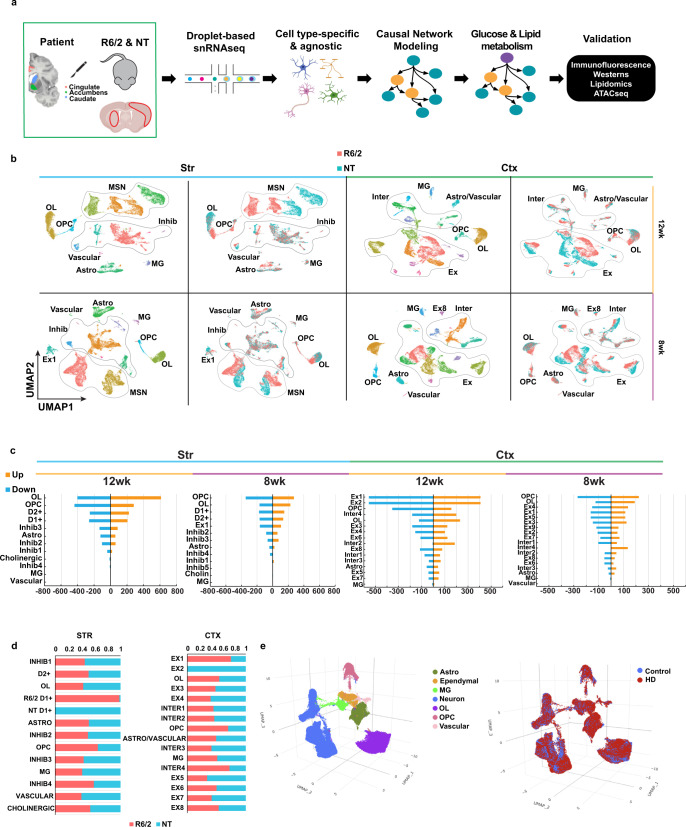
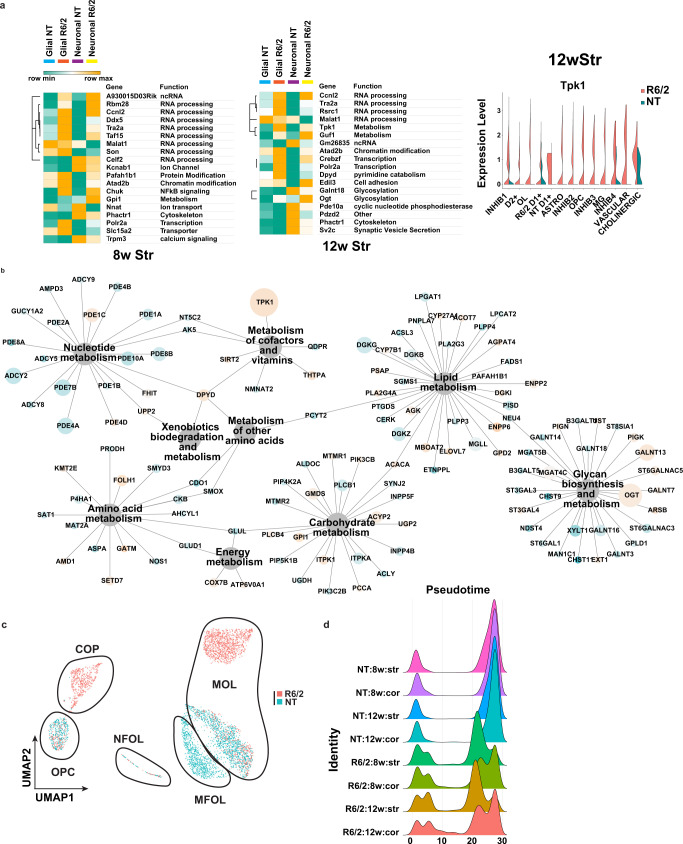
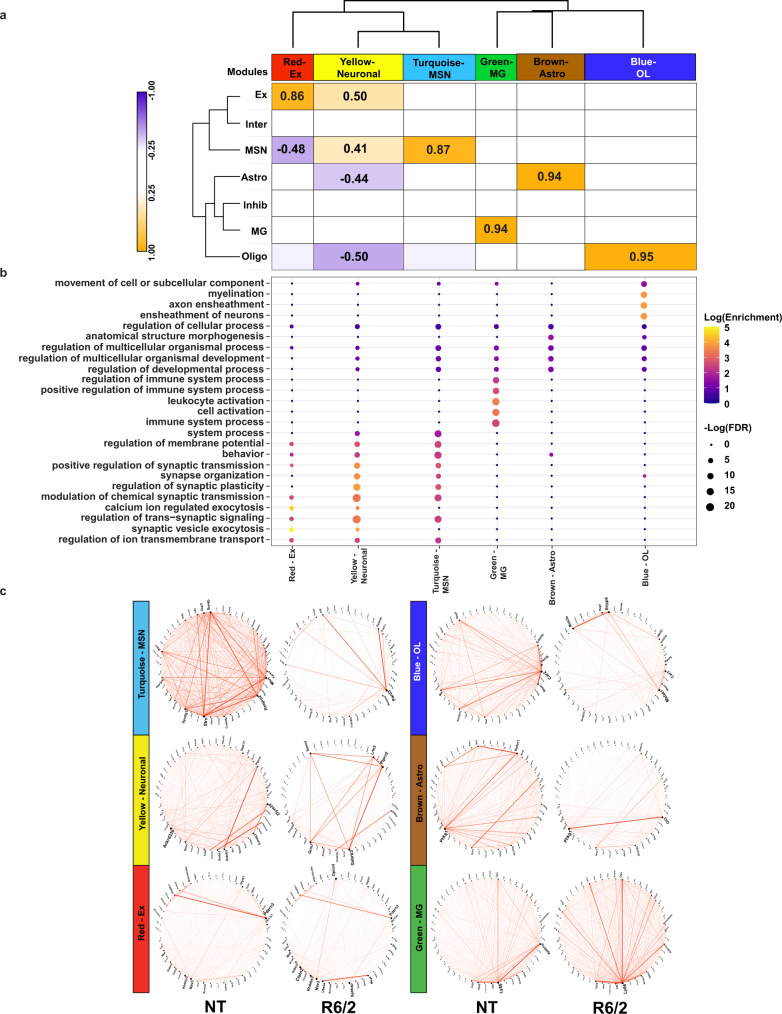
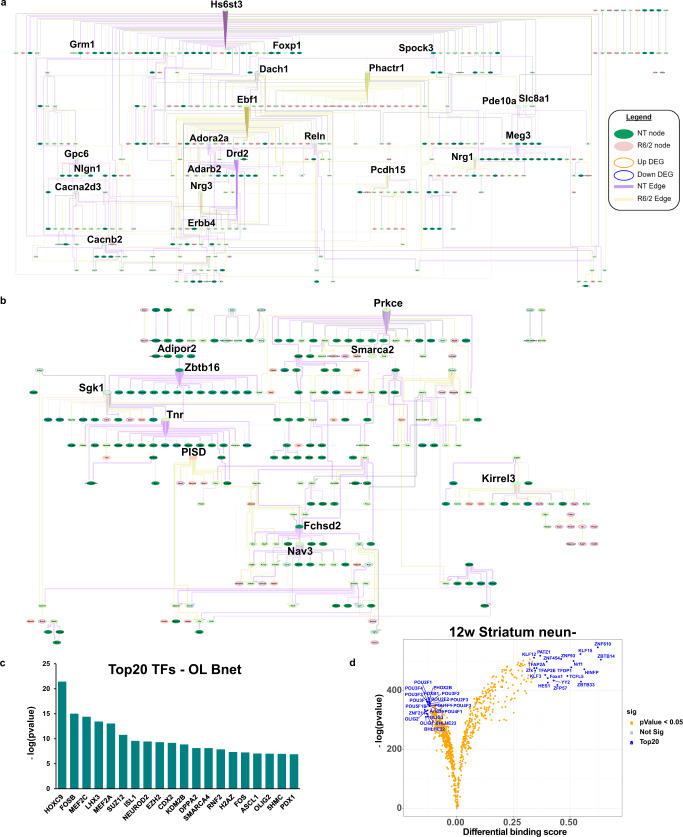
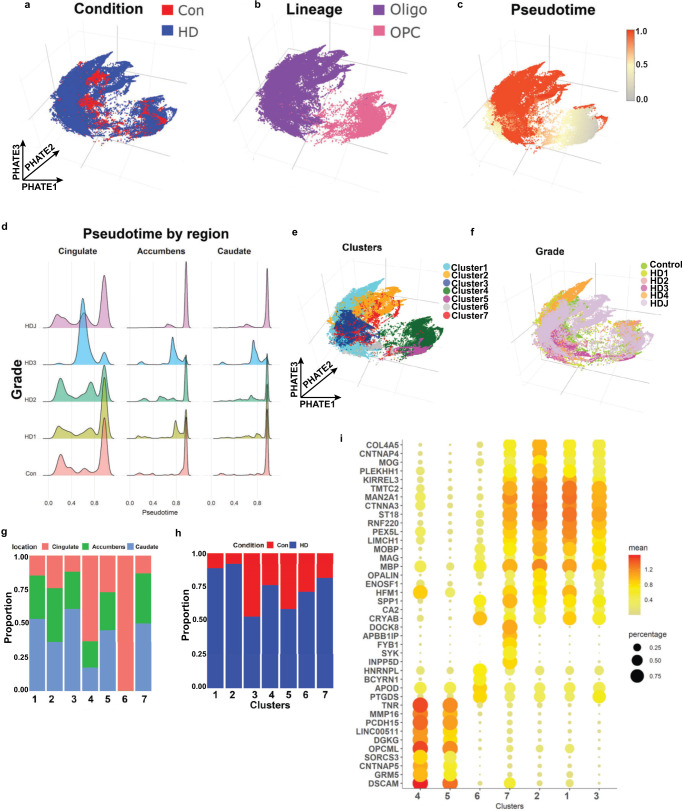
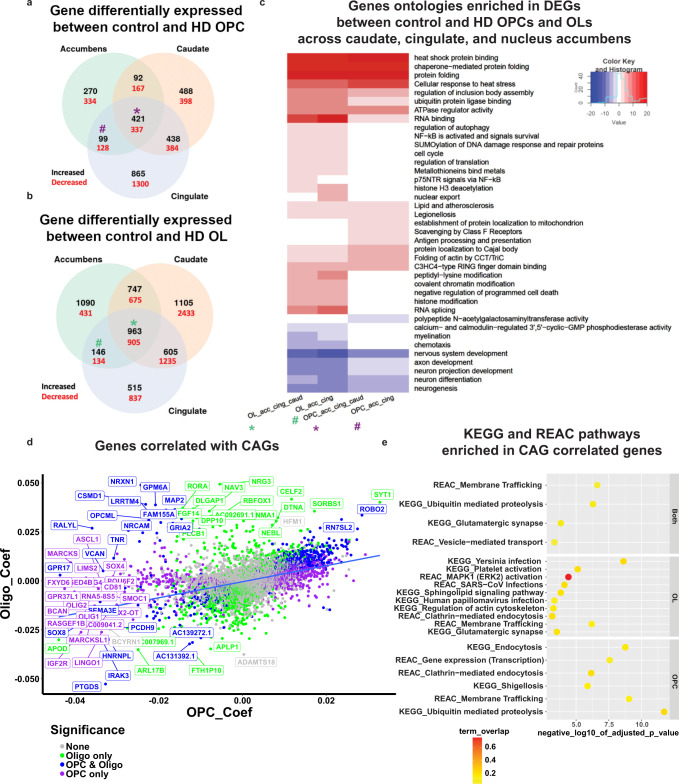
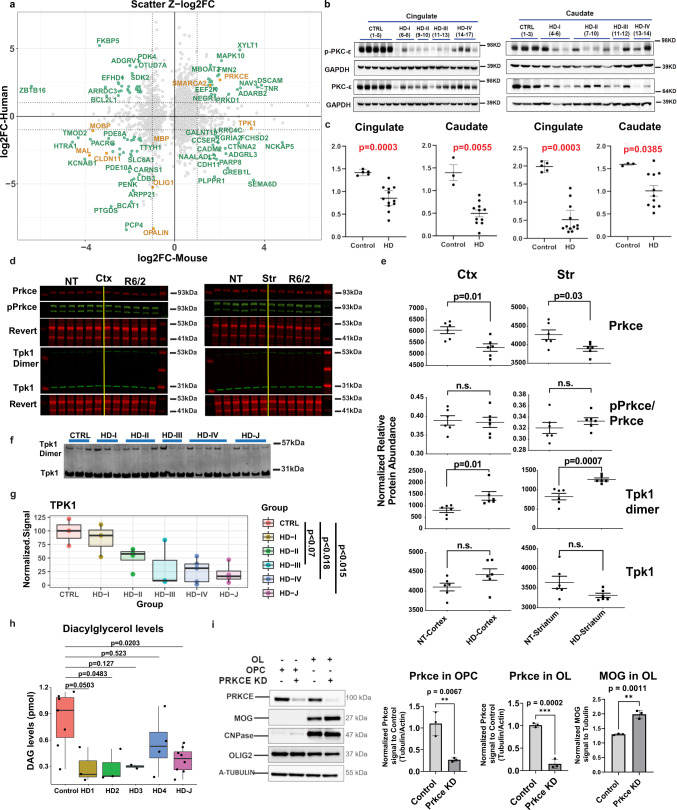
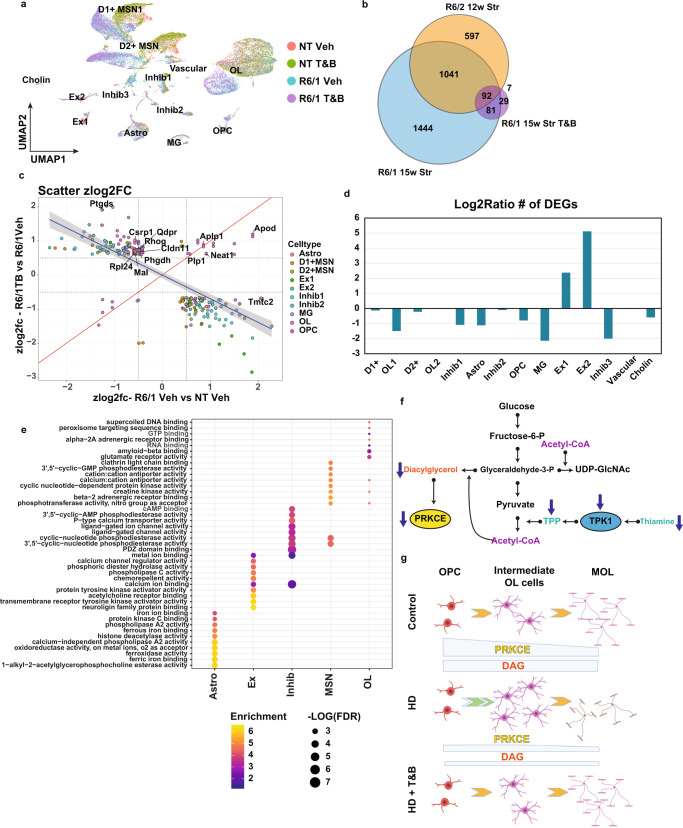
The complexity of affected brain regions and cell types is a challenge for Huntington's disease (HD) treatment. Here we use single nucleus RNA sequencing to investigate molecular pathology in the cortex and striatum from R6/2 mice and human HD post-mortem tissue. We identify cell type-specific and -agnostic signatures suggesting oligodendrocytes (OLs) and oligodendrocyte precursors (OPCs) are arrested in intermediate maturation states. OL-lineage regulators OLIG1 and OLIG2 are negatively correlated with CAG length in human OPCs, and ATACseq analysis of HD mouse NeuN-negative cells shows decreased accessibility regulated by OL maturation genes. The data implicates glucose and lipid metabolism in abnormal cell maturation and identify PRKCE and Thiamine Pyrophosphokinase 1 (TPK1) as central genes. Thiamine/biotin treatment of R6/1 HD mice to compensate for TPK1 dysregulation restores OL maturation and rescues neuronal pathology. Our insights into HD OL pathology spans multiple brain regions and link OL maturation deficits to abnormal thiamine metabolism.


Conflict of interest statement

The authors declare no competing interests.

Figures

Fig. 1
Fig. 1. Single nucleus RNAseq of mouse and human R6/2 and HD samples.
a Illustration of workflow used for this study. After frozen tissue is microdissected from the Cingulate, Caudate, and nucleus Accumbens from 66 samples from 29 human donors (3 grade I, 4 grade II, 4 grade III, 3 grade IV, 5 juvenile-onset HD, and 10 matched controls), or the striatum and cortex of the mice (n = 3), nuclei are isolated, 10× Libraries are prepared followed by next generation sequencing. Created with BioRender.com b Uniform manifold projection and approximation plots (UMAP) of the R6/2 and NT mouse data colored by cluster or genotype. Initial QC and filtering led to the identification of 108,974 nuclei from mouse tissues. General cell type annotations: Astro Astrocytes, OL Oligodendrocyte, OPC Oligodendrocyte progenitors, MSN Medium spiny neurons, Inhib inhibitory neurons, MG Microglia, Ex Excitatory neurons, Inter Interneurons. c Barplot showing the number of up (orange) and down (blue) regulated DEGs per a cell type in the mouse data. b, c Striatal (Str, light blue bar) samples on the left and cortical (Ctx, light green bar) samples on the right, 12w samples marked by yellow bar and 8w marked by purple bar. d Proportion of R6/2 and NT cells within each cluster, red = R6/2 & blue = NT. e UMAP plots of the human snRNAseq results showing color-coded by cell type (Left), condition (Right).
Fig. 2
Fig. 2. Analysis of differentially expressed genes in R6/2 mice and subclustered analysis of OPCs and OL.
a Left: Heatmaps and hierarchical clustering of normalized mean expression values in all glial or neuronal cells of the top cell type-agnostic DEGs. Cell color represents row min (seafoam green) and max (orange). Color bars denote NT glial cells (light blue), R6/2 glial cells (orange), NT neural cells (purple), and R6/2 neuronal cells (yellow). RNA processing and splicing (Ccnl2, Tra2a, ddx5, Celf2, and Taf15) and metabolism (Guf1, Tpk1, and Gpi1) related genes. Glucose super metabolism pathway genes that include glycolysis, the hexosamine biosynthetic pathway, polyol pathway, and diacylglycerol pathways, include Ogt, Tpk1, Gpi1, and Galant18. 8w and 12w Str data shown, cortical data in Supplementary Fig. 3a. Right: violin plot of exemplary gene Tpk1 that show global upregulation in R6/2 mice, across all cell types, from 12w Str. b Network showing all KEGG metabolic genes significantly dysregulated across the 12w Str DEGs from every cell type. 12w Str data shown, 8w Str and cortical data in Supplementary Fig. 3b. Node size is equal to the number of cell types in which the gene is found to be significantly dysregulated, and nodes are colored by up and downregulation (orange = up and blue = down). c UMAPs of subclustered OPCs and OL in the 12w striatum, colored by genotype. Cluster composition: NT cells are mainly MOLs and MFOLs, or OPCs; while R6/2 cells are COP, NFOL, and MOL. Statistical contrasts: R6/2 vs NT for each cluster, cluster comparisons between R6/2 and NT MOLs, NT MFOLs and R6/2 MOL, COP vs OPCs. 8wStr and cortical data show in Supplementary Fig. 3c. d Density plots of cell numbers across pseudotime cell stages, colored by genotype and age.
Fig. 3
Fig. 3. WGCNA analysis of R6/2 mouse snRNAseq data shows cell type-specific changes in network structure.
a Dendrogram and correlation heatmap showing cell type-specific co-expression modules. Heatmap shows modules highly correlated with each cell type, dendrogram shows clustering of neuronal module together and glial together. Cell color represents column min (blue) and max (orange). Any statistically significant trait-module correlations are shown with correlation value. P-values (Supplementary Data 3) are Student asymptotic p-values. b Top five GO terms per module, showing cell type-specific functional relevance. c Circos plots of the top 50 genes with highest kME in NT mice (left) and R6/2 (right). Red lines show connectivity between the top 50 genes. Structural differences can be seen between NT and R6/2.
Fig. 4
Fig. 4. Causal network analysis and ATACseq of glia reveals Prkce, Olig1/2, Sox9/10, and glucose and lipid metabolism as important regulators.
a MSN bnet. b OL bnet. a, b Both causal networks are merged from NT and R6/2. If a node and edge existed in both the NT and R6/2 bnets, the NT data (edge weight) were used for plotting. Each bnets shows nodes that exist only in NT or R6/2 and nodes that exist in both, as well as new edges and edges retained in the R6/2 data. Each bnet was also plotted using a hierarchical structure to show the direction of causal flow. In each plot, genes with a high degree of outward centrality (>10 outward edges) are highlighted by increased gene name size, as well as genes that connect between two genes that have a high degree of outward centrality. We consider these highlighted genes key drivers of the network. Color scheme is as follows: Edge (purple = NT, yellow = R6/2, gray = both), node fill color (green = NT node, pink = R6/2 node, light green = both), node outline color (orange = upregulated, blue = downregulated). MG, Astro, and Ex neuron bnets are in Supplementary Fig. 5b–d. c LISA analysis of OL causal network gene members, showing the top 20 regulatory transcription factors. d Volcano plot showing differential binding scores, and −log(p value) differences of TF binding in open chromatin in 12w NeuN- striatal cells. blue = top20 by differential binding score, orange = p value < 0.05. 8wStr, cortical, and all NeuN+ data can be found in Supplementary Fig. 6b.
Fig. 5
Fig. 5. Huntington disease oligodendrocytes are less mature.
Projection of control and HD nuclei in the PHATE dimension color-coded by condition (a), lineage (b), pseudotime value (c), cluster (using the Levine algorithm) (e), and HD grade (f). Note that OPCs have the lowest pseudotime values in c, as OPCs were set as root nodes, while OLs had high values. d Pseudotime values are shown in histograms across brain region and HD grade. Note that the proportion of nuclei with intermediate pseudotime values is higher in HD, especially grade III. The relative contribution of anatomic region (g) and condition (h) to each cluster is shown in bar plots. i Gene expression dot plots showing normalized expression of select cluster marker genes, with color denoting expression levels and circle size denoting the proportion of nuclei expressing the gene of interest.
Fig. 6
Fig. 6. Differential gene expression analysis of HD and control OPCs and OLs.
Venn diagram analysis of the DEGs in OPCs (a) and OLs (b). The number of DEGs that are increased (black) or decreased (red) in HD nuclei is highlighted per overlap sector. The stars indicate the DEGs that are shared across all regions, and the # indicates the DEGs shared between the Cingulate and Accumbens. c Gene ontology (GO) term analysis of differentially expressed genes in select sectors of the Venn diagrams HD versus control OLs and OPC (from panels a, b). The * and # signs correspond to the DEGs shared across all regions and DEGs shared between accumbens and cingulate OL and OPCs, respectively (purple = OPC DEGs, and green = OL DEGs). The sign of the negative log10 of the adjusted p value indicates the direction of changes; positive sign corresponds to genes increased in HD, and negative sign corresponds to genes decreased in HD. Heat shock protein encoding genes HSPA1A, HSPH1, HSPA4L, HSP90AA1, HSPB1, HSPA4, HSPD1, HSPA1A, HSPA1B, and HSPB1. d Scatter plot of the correlation coefficients of genes that correlate with CAG repeats in OPCs (y-axis) and OLs (x-axis). The graph plots the regression coefficients of each gene in OLs versus OPCs; the upper right quadrant represents genes with positive correlations in both OPCs and OL, the lower left quadrant genes that have negative correlations in both. The color of the genes correspond to whether the coefficient was significant in OLs only (green), OPCs and OLs (blue), or OPCs only (purple). e KEGG and Reactome pathway enrichment analysis of the genes that significantly correlate with CAG repeats in OPCs and OLs (top panel), OLs (middle panel), or OPCs (lower panel). The negative log10 of the adjusted p value is indicated on the x-axis, and the pathways on the y-axis. The color of each circle corresponds to the percentage of overlap between the CAG-correlated genes and the genes in each pathway.
Fig. 7
Fig. 7. Western, lipidomics, and cellular analyses validates HD differences in TPK1 and PRKCE.
a Scatterplots of Z-score log2 fold change values comparing mouse and human data in 12w striatum versus human caudate OL DEGs. Genes with |Z-log2FC| values > 1 are highlighted in seafoam green and OL maturation genes are highlighted in orange, showing concordance between species for PRKCE and OL maturation genes, and discordance of TPK1 expression. b Western blot of PRKCE and phospho-PRKCE in HD and control patient cingulate cortex and caudate. c Quantification of western blot results. Two-tailed Mann Whitney test used for each statistical analysis. Exact p-values: Cingulate: PKCE-0.0003, p-PKCE-0.0003; Caudate: PKCE-0.0055, p-PKCE- 0.0385. n = 3 control and 11–12 HD caudate samples, and 5 control and 11–12 HD cingulate samples. Data shown as mean +/− SEM as error bars. d Licor images of Prkce, pPrkce, TPK1, and respective revert in R6/2 and NT striatum and cortex. e Quantification of licor results. One-way ANOVA used for statistical analysis. n = 6 NT and 6 R6/2, biologically independent samples. Data shown as mean +/− SEM as error bars. f Western blot of TPK1 in human caudate samples from juvenile HD, HD grades 1–4, and control patients. g Quantification of human TPK1. Statistical analysis was done using a one-way ANOVA and Tukey HSD posthoc, comparing control to each adult HD grades (adjusted p = 0.979, 0.221, 0.070, and 0.018) and control to juvenile HD (p = 0.015). Data shown as median (center line), first and third quartile (Inner quartile range, box), and min and max values as whiskers. h DAG levels quantified from HD and control patient brains showing significant decreased DAG levels in HD brains. One-way ANOVA and Tukey’s HSD posthoc used for statistical analysis, comparing control to each adult HD grades. n = 7 control, 3 HD1, 3 HD2, 2 HD3, 4 HD4, 8 HD-J, biologically independent samples. Data shown as median (center line), inner quartile range (box), and min and max values as whiskers. i Western blot of PRKCE, MOG, CNPase, OLIG2, and A-Tubulin in OPC and OLs +/− K/D of PRKCE. Two-tailed Mann Whitney test used for statistical analysis. n = 3 biologically independent samples per group. Data shown as mean +/− SEM as error bars. For western blot results, source data are provided as a Source Data file.
Fig. 8
Fig. 8. Thiamine and biotin study in R6/1 mice shows rescue of OL maturation DEGs and other cell type DEGs.
a UMAP showing the R6/1 and NT mouse data colored by genotype and treatment. b Venn diagram comparing genotype DEGs in 15w R6/1 mice and 12wStr of R6/2 mice against each other and treatment effect DEGs from R6/1T&B treated versus vehicle. c Scatterplot showing Z-score log2FC of all genes overlapping between genotype and treatment effect DEGs. Colored by cell type origin. OL and Inhib1 neurons show the most rescued DEGs. Quadrants 1 and 3 represent rescue of expression and 2 and 4 represent exacerbation. d Barplot showing the log2ratio of the number of significant DEGs comparing R61 vehicle versus NT vehicle to R6/1T&B versus NT vehicle. e Top 10 GO terms of overlapping DEGs per cell type (R61 vehicle versus NT vehicle to R6/1T&B versus NT vehicle). f Illustration of metabolic pathways impacted in HD. g Illustration showing how PRKCE and DAG levels regulate OPC commitment to differentiation and MOL maturation in control and HD, and how T&B treatment rescues maturation impairments. Created with BioRender.com.

References

    1. Vonsattel JP, Keller C, Del Pilar Amaya M. Neuropathology of Huntington’s disease. Handb. Clin. Neurol. 2008;89:599–618. doi: 10.1016/S0072-9752(07)01256-0. - DOI - PubMed
    1. The Huntington’s Disease Collaborative Research Group. A novel gene containing a trinucleotide repeat that is expanded and unstable on Huntington’s disease chromosomes. Cell72, 971–983 (1993). - PubMed
    1. The Huntington’s Disease iPSC Consortium Developmental alterations in Huntington’s disease neural cells and pharmacological rescue in cells and mice. Nat. Neurosci. 2017;20:648–660. doi: 10.1038/nn.4532. - DOI - PMC - PubMed
    1. Hyeon, J. W., Kim, A. H. & Yano, H. Epigenetic regulation in Huntington’s disease. Neurochem. Int.148, 105074 (2021). - PMC - PubMed
    1. Malla B, Guo X, Senger G, Chasapopoulou Z, Yildirim F. A systematic review of transcriptional dysregulation in Huntington’s disease studied by RNA sequencing. Front. Genet. 2021;12:751033. doi: 10.3389/fgene.2021.751033. - DOI - PMC - PubMed

Publication types