. 2022 Dec 21;13(1):7840.
doi: 10.1038/s41467-022-35499-5.

Ocean variability beneath Thwaites Eastern Ice Shelf driven by the Pine Island Bay Gyre strength

Affiliations

Ocean variability beneath Thwaites Eastern Ice Shelf driven by the Pine Island Bay Gyre strength

Tiago S Dotto et al. Nat Commun. .

Abstract

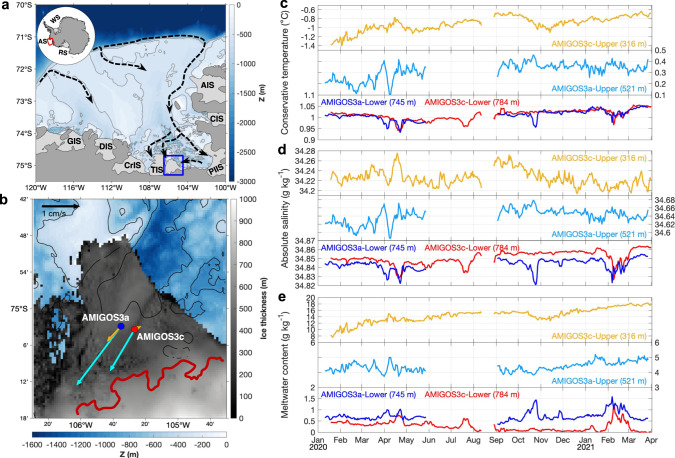
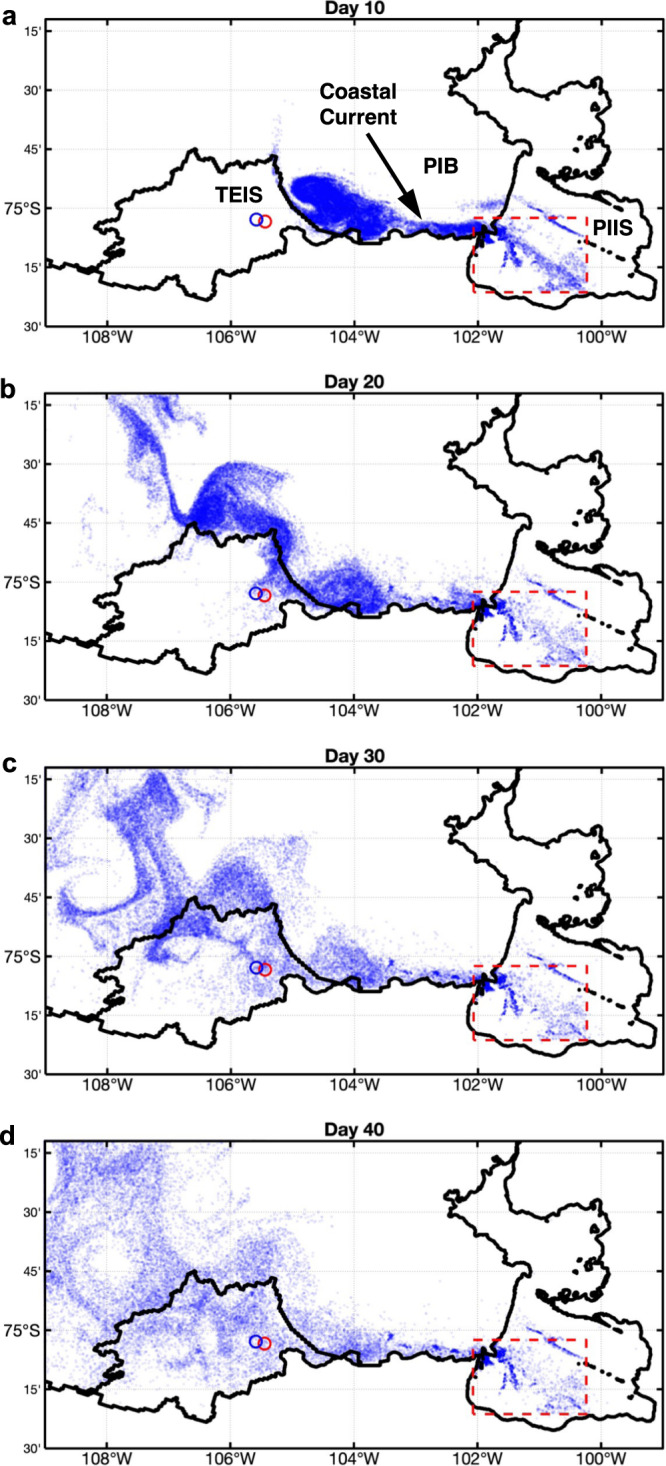
West Antarctic ice-shelf thinning is primarily caused by ocean-driven basal melting. Here we assess ocean variability below Thwaites Eastern Ice Shelf (TEIS) and reveal the importance of local ocean circulation and sea-ice. Measurements obtained from two sub-ice-shelf moorings, spanning January 2020 to March 2021, show warming of the ice-shelf cavity and an increase in meltwater fraction of the upper sub-ice layer. Combined with ocean modelling results, our observations suggest that meltwater from Pine Island Ice Shelf feeds into the TEIS cavity, adding to horizontal heat transport there. We propose that a weakening of the Pine Island Bay gyre caused by prolonged sea-ice cover from April 2020 to March 2021 allowed meltwater-enriched waters to enter the TEIS cavity, which increased the temperature of the upper layer. Our study highlights the sensitivity of ocean circulation beneath ice shelves to local atmosphere-sea-ice-ocean forcing in neighbouring open oceans.


Conflict of interest statement

The authors declare that they have no conflict of interest.

Figures

Fig. 1
Fig. 1. Study region and hydrographic properties variability.
a Bathymetry of the continental shelf of the Amundsen Sea showing a schematic of the main pathways of modified Circumpolar Deep Water (mCDW; back dashed arrows) and ice shelves: Abbot Ice Shelf (AIS), Cosgrove Ice Shelf (CIS), Pine Island Ice Shelf (PIIS), Thwaites Ice Shelf (TIS), Crosson Ice Shelf (CrIS), Dotson Ice Shelf (DIS), and Getz Ice Shelf (GIS). Thwaites Eastern Ice Shelf (TEIS) is delimited by the blue rectangle. b TEIS study region showing the AMIGOS3a (blue dot) and AMIGOS3c (red dot) sites. Ice thickness, bathymetry, and grounding line (dark red) from BedMachine Antarctic v2, ref. . Time-mean (January 2020 to March 2021) velocity vectors are shown for the upper sensors (cyan arrow) and deeper sensors (orange arrow) at the AMIGOS3a and AMIGOS3c sites. c Daily conservative temperature for the different sensors according to the legend. The mean depth of each sensor is shown in the legend. d Daily absolute salinity records. e Daily meltwater content estimated from conservative temperature and absolute salinity.
Fig. 2
Fig. 2. Conservative Temperature-Absolute Salinity-Time diagrams.
a Location of Conductivity-Temperature-Depth (CTD) stations (yellow dots) in Pine Island Bay (PIB) collected in January and February 2020, and the AMIGOS3a (blue dot) and AMIGOS3c (red dot) sites. Thwaites Eastern Ice Shelf (TEIS) and Pine Island Ice Shelf (PIIS) are depicted. Ice thickness and bathymetry from BedMachine Antarctic v2, ref. . Note that BedMachine is not updated to the most recent calving front. b Conservative Temperature-Absolute Salinity diagram for the CTDs (grey dots) and AMIGOS colour-coded by the month that the measurement took place. Red lines are neutral density isopycnals. Magenta dashed is the Gade line and black dashed is the mixing line between modified Circumpolar Deep Water (mCDW) and Winter Water (WW). Zoom-in for c, AMIGOS3c-Upper, d AMIGOS3c-Lower, e AMIGOS3a-Upper, and f AMIGOS3a-Lower.
Fig. 3
Fig. 3. Monthly averaged in situ temperature profiles beneath Thwaites Eastern Ice Shelf (TEIS) measured by fibre-optic cables.
a In situ temperature recorded at AMIGOS3c for April 2020 (light blue), September 2020 (red), and February 2021 (orange). b Same as a, but for AMIGOS3a. The vertical dashed lines are the in situ freezing temperature, assuming absolute salinities of 33.85 g kg−1 for AMIGOS3c and 34.10 g kg−1 for AMIGOS3a taken from the borehole profiles (Supplementary Fig. 2). Note that the y-axis limits are different between the two panels.
Fig. 4
Fig. 4. Ocean current variability and temperature flux.
Current-rose by occurrence for different speeds and directions for a AMIGOS3c-Upper, b AMIGOS3c-Lower, c AMIGOS3a-Upper, and d AMIGOS3a-Lower. The mean depth of each sensor is shown in parentheses. Note that the speed scale varies between Upper (a, c) and Lower (b, d) sensors. The thick grey line depicts the sub-ice shelf channel oriented to North. e Conservative temperature (Θ) flux from the AMIGOS3c-Upper coloured by meltwater content.
Fig. 5
Fig. 5. Trajectories of simulated particles released in the Pine Island Ice Shelf (PIIS) cavity (red rectangle).
A total of 200645 particles were released beneath PIIS in the red rectangle in an offline simulation. For illustration purposes, the particles were restricted to meltwater content of 10–25 g kg−1 and depths 250–400 m, based on day 2 of the simulation (when particles leave the cavity), which reduces the total number of particles to 42521. The snapshots show particle location for days a 10, b 20, c 30, and d 40 of the simulation. Open blue and red circles depict AMIGOS3a and AMIGOS3c sites, respectively. Thwaites Eastern Ice Shelf (TEIS) and Pine Island Bay (PIB) are depicted.
Fig. 6
Fig. 6. Meltwater content at Pine Island Bay (PIB) from seal-tag data.
a Meltwater content at 200 m depth derived from seal-tag data collected between May and October of 2020. The black polygon shows the area used to select the seal-tag data near Thwaites Eastern Ice Shelf (TEIS). Terra MODIS optical imagery for 10 September 2020 is shown. Grey contours show land (dark) and ice shelves (light). Pine Island Ice Shelf (PIIS) is depicted. b Time series of meltwater for AMIGOS3c-Upper (orange, same as in Fig. 1e) and for the seal-tag data at 200 m (blue), 300 m (green), and 400 m (cyan) within the black polygon in “a”. c Conservative temperature-absolute salinity diagram showing the hydrographic properties for AMIGOS3c-Upper (orange) and the seal-tag data (grey). Light grey represents all seal-tag data within PIB. Dark grey represents the seal-tag within the black polygon of “a”, at 200 m (blue), 300 m (green), and 400 m (cyan). Magenta line depicts the Gade line and black line represents the mixing line of and Winter Water (WW) and modified Circumpolar Deep Water (mCDW).
Fig. 7
Fig. 7. Regional ocean simulation showing the variability of the Pine Island Bay (PIB) gyre density structure.
a Location of the section used in panel b and the AMIGOS3a (blue) and AMIGOS3c (red) moorings. Ice thickness and bathymetry from BedMachine Antarctic v2, ref. . Thwaites Eastern Ice Shelf (TEIS) and Pine Island Ice Shelf (PIIS) are identified in the map. Note that BedMachine is not updated to the most recent calving front. A schematic location of the PIB gyre is shown by the arrows. b Vertical section showing the difference in neutral density between August-September 2020 (red lines) and February–March 2020 (blue lines) to illustrate the density variation in the sea-ice-covered and sea-ice-free periods, respectively. During a sea-ice-covered period, the isopycnals deepen at the centre of the PIB gyre and shallow beneath TEIS, representative of spin-down of the gyre in winter. The isopycnals of December 2020 (prolonged sea-ice-cover conditions) are shown in black dashed lines. c Depth difference (ΔZ in m) of the isopycnal of 27.9 kg m−3 between August–September 2020 and February–March 2020. d Neutral density calculated at the 300 m depth from seal-tag data for February-April 2020 (summer, left) and May–October 2020 (winter, right). Terra MODIS optical imagery for 15 March 2020 exemplifies a sea-ice-free condition and 10 September 2020 a sea-ice-covered period. Grey contours represent land (dark) and ice shelves (light).
Fig. 8
Fig. 8. Schematic of the processes identified.
a During sea-ice-free conditions, the Thwaites Eastern Ice Shelf (TEIS) cavity is filled with shallow cold waters due to the strengthening of the Pine Island Bay (PIB) gyre, as depicted by the steepening of the isopycnal (solid line). The density field is shallow in the middle of the gyre and deepens to beneath the TEIS front. b During sea-ice-covered periods, the wind-stress is damped and the isopycnals relax, which characterises a weakening of the gyre (dashed line). Under the TEIS, the isopycnals uplift, which brings warm and salt waters close to the ice base, creating a warm condition beneath the ice shelf. c During prolonged sea-ice-covered periods, the isopycnals flatten (yellow dashed line), the gyre weaken, and meltwater is accumulated in the PIB area, which reduces the density field. The isopycnals near and beneath TEIS deepen, which open space for higher volume of shallow and light meltwater-enriched waters to flood the upper layers of the ice shelf cavity, leading to a warm condition. In all panels the isopycnal of sea-ice-free conditions is depicted for reference. The colour illustrates the temperature field, with red (blue) colour representing warm (cold) waters.
Fig. 9
Fig. 9. Sea-ice concentration during the study period.
a Terra MODIS optical imagery shows the sea-ice coverage in Pine Island Bay (PIB) during two dates in early and late 2019–2020, and 2020–2021 austral summer seasons. Schematic of the cyclonic PIB gyre is shown in upper left panel. Blue polygon in upper right panel delimits the area where the sea-ice concentration was estimated for panel b. Thwaites Eastern Ice Shelf (TEIS) and Pine Island Ice Shelf (PIIS) are depicted. b Daily sea-ice concentration from AMSR-E/AMSR2. The time series were smoothed by a 2-day running-mean window. Yellow shading highlights years of high summertime sea-ice concentration.

References

    1. Mouginot J, Rignot E, Scheuchl B. Sustained increase in ice discharge from the Amundsen Sea Embayment, West Antarctica, from 1973 to 2013. Geophys. Res. Lett. 2014;41:1576–1584. doi: 10.1002/2013GL059069. - DOI
    1. Milillo P, et al. Heterogeneous retreat and ice melt of Thwaites Glacier, West Antarctica. Sci. Adv. 2019;5:eaau3433. doi: 10.1126/sciadv.aau3433. - DOI - PMC - PubMed
    1. Rignot E, et al. Four decades of Antarctic Ice Sheet mass balance from 1979–2017. Proc. Natl Acad. Sci. USA. 2019;116:1095–1103. doi: 10.1073/pnas.1812883116. - DOI - PMC - PubMed
    1. Alley KE, et al. Two decades of dynamic change and progressive destabilization on the Thwaites Eastern Ice Shelf. Cryosphere. 2021;15:5187–5203. doi: 10.5194/tc-15-5187-2021. - DOI
    1. Wild CT, et al. Weakening of the pinning point buttressing Thwaites Glacier, West Antarctica. Cryosphere. 2022;16:397–417. doi: 10.5194/tc-16-397-2022. - DOI

Publication types