. 2023 Jan;55(1):66-77.
doi: 10.1038/s41588-022-01243-4. Epub 2022 Dec 21.

A spatially resolved atlas of the human lung characterizes a gland-associated immune niche

Affiliations

A spatially resolved atlas of the human lung characterizes a gland-associated immune niche

Elo Madissoon et al. Nat Genet. 2023 Jan.

Abstract

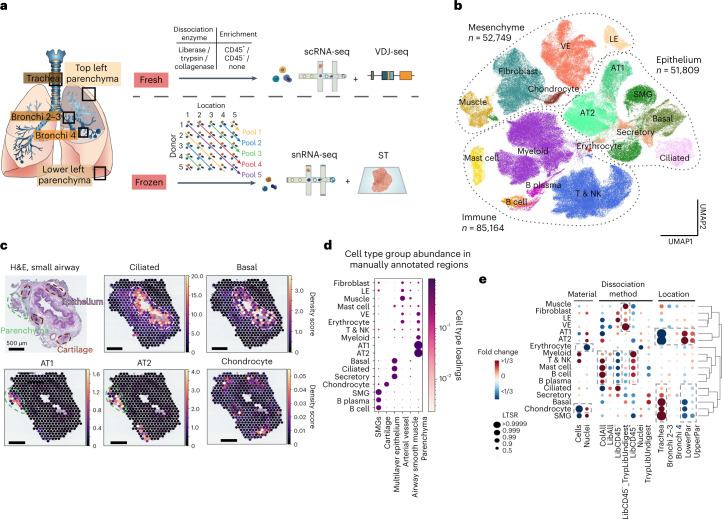
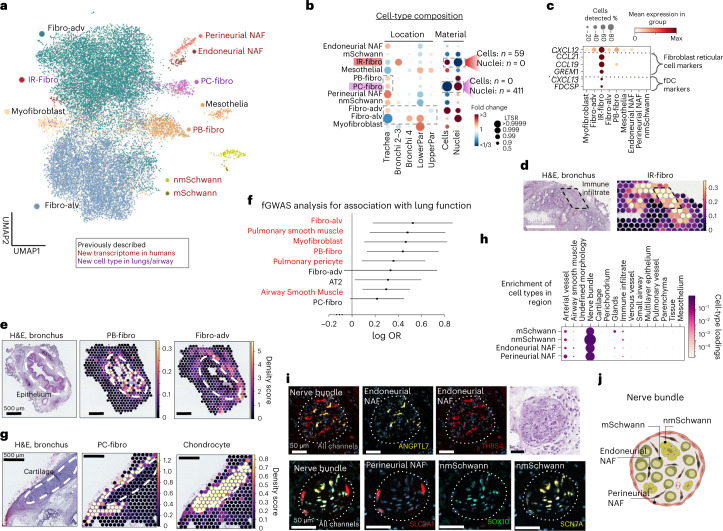
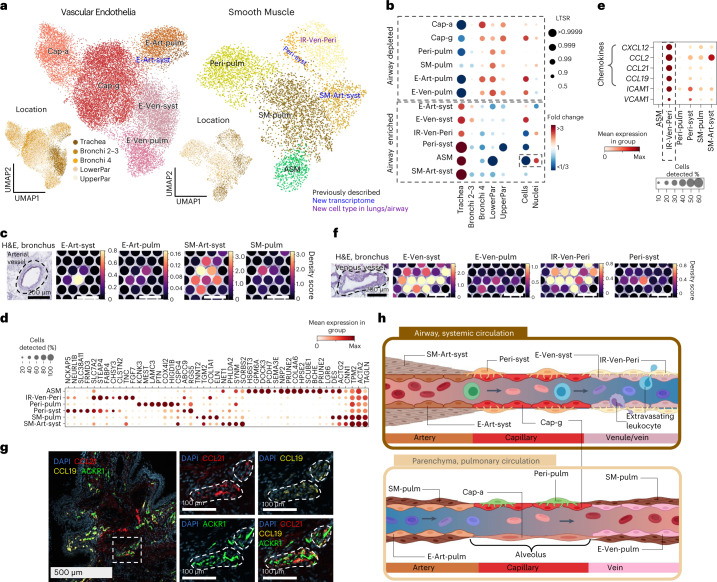
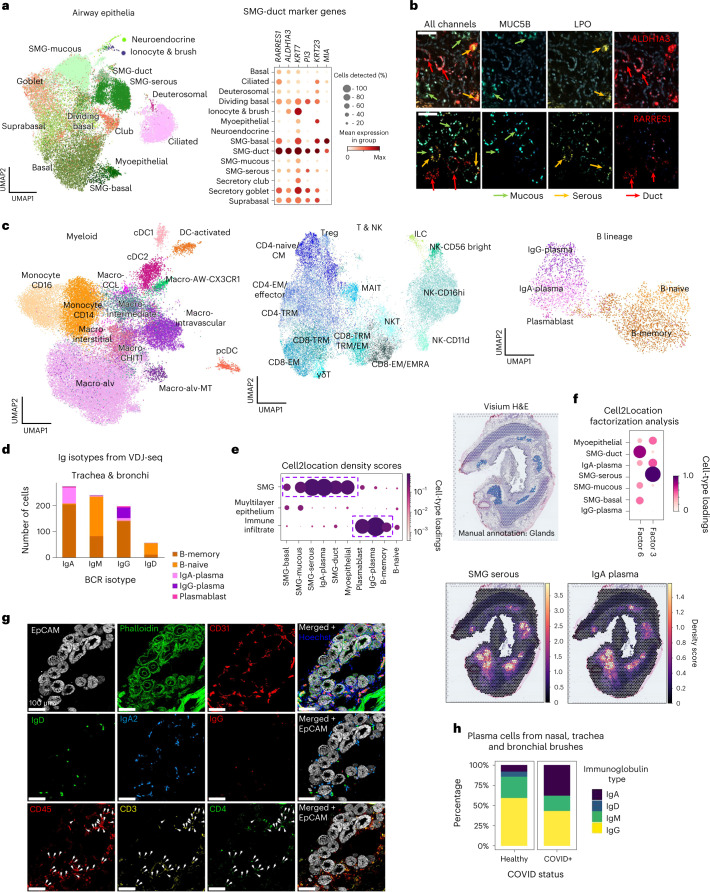
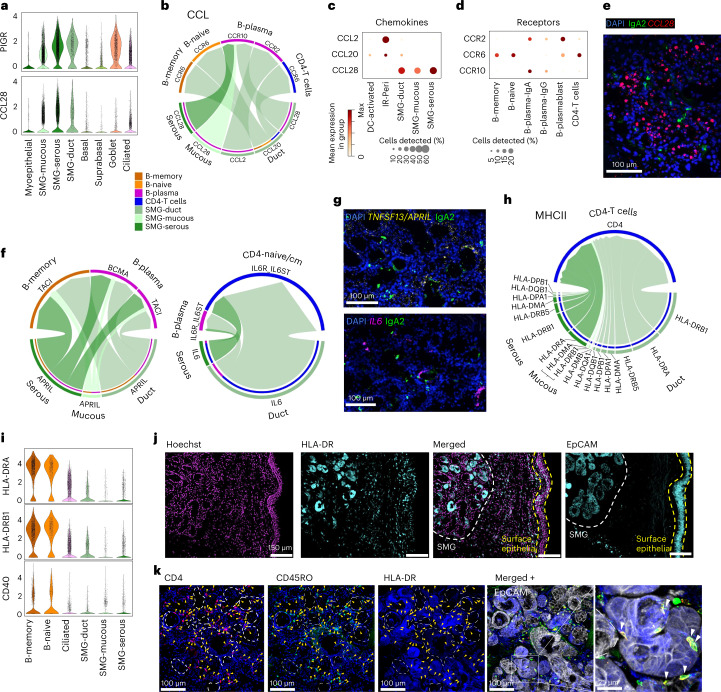
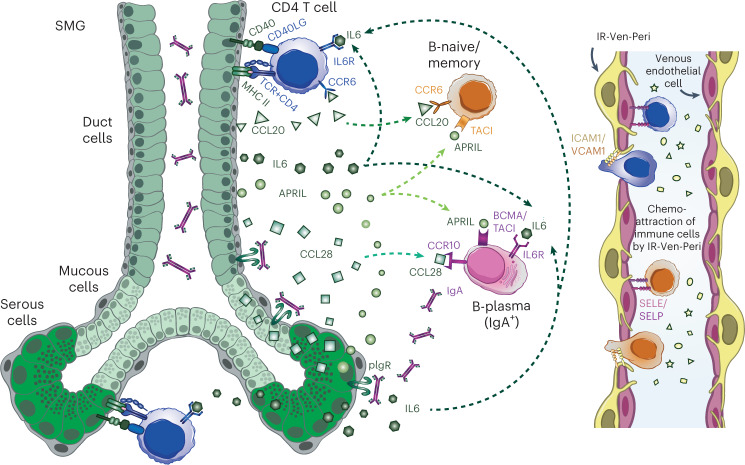
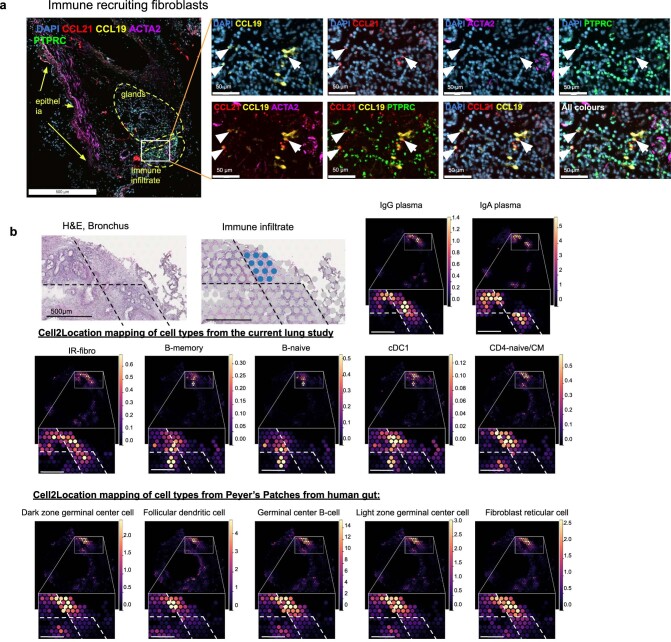
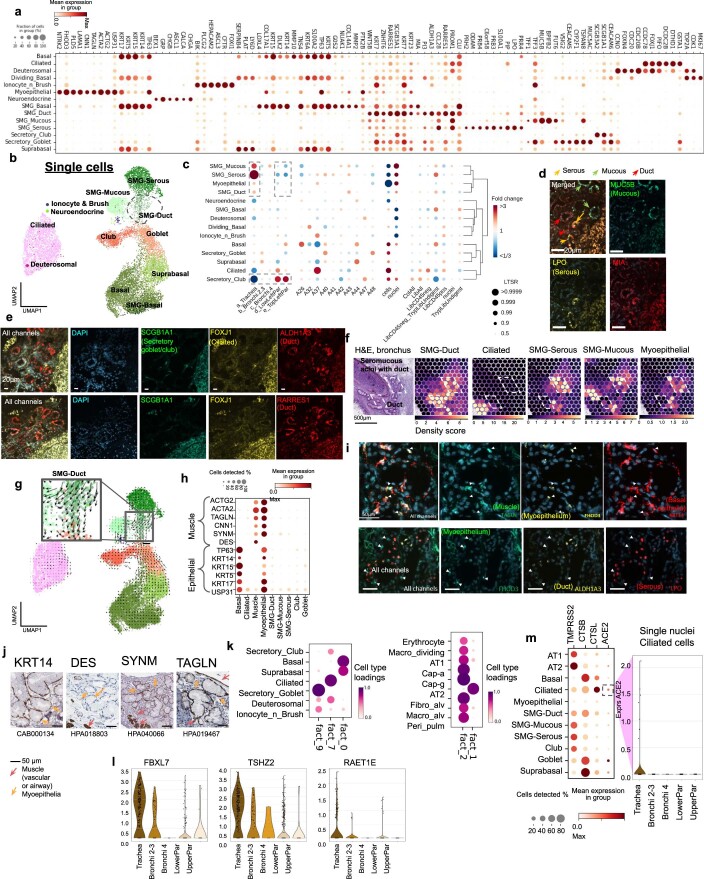
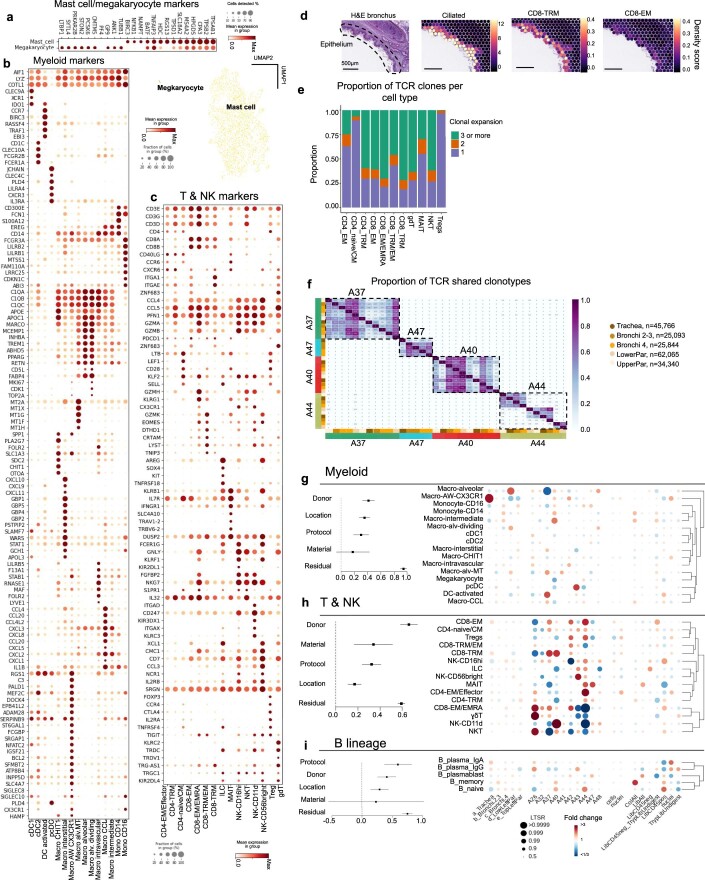
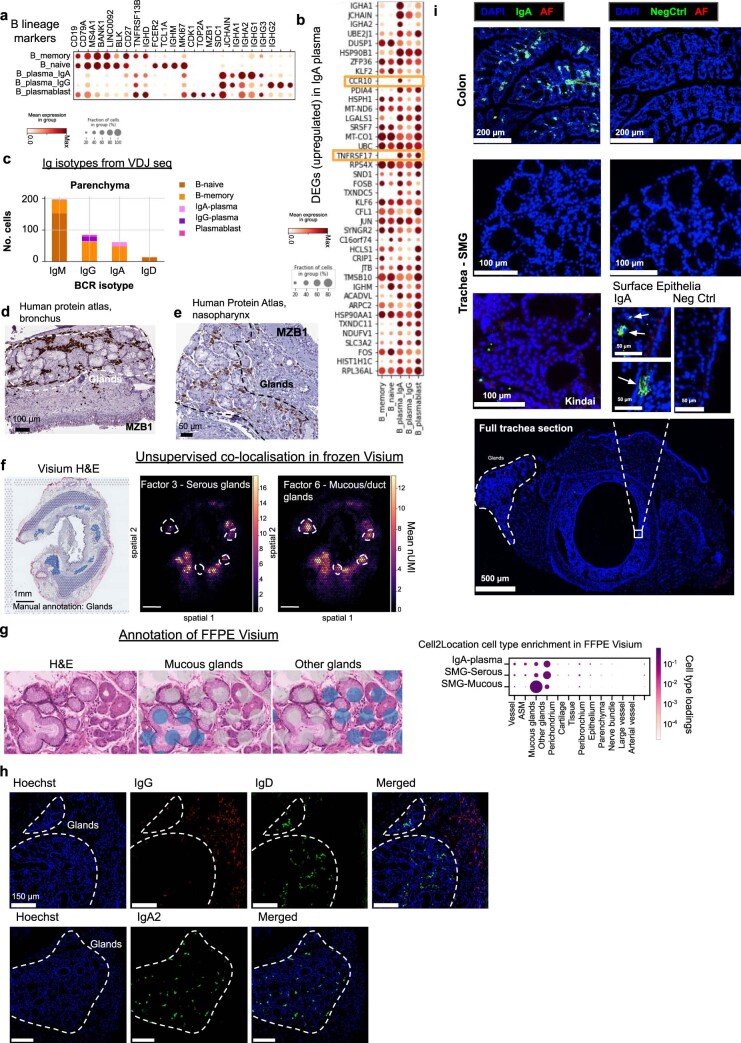
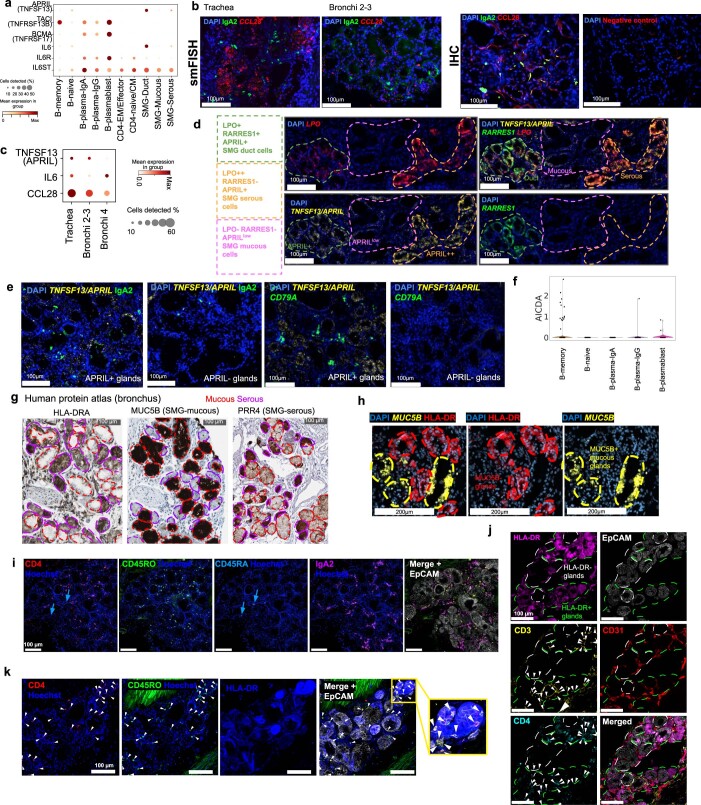
Single-cell transcriptomics has allowed unprecedented resolution of cell types/states in the human lung, but their spatial context is less well defined. To (re)define tissue architecture of lung and airways, we profiled five proximal-to-distal locations of healthy human lungs in depth using multi-omic single cell/nuclei and spatial transcriptomics (queryable at lungcellatlas.org ). Using computational data integration and analysis, we extend beyond the suspension cell paradigm and discover macro and micro-anatomical tissue compartments including previously unannotated cell types in the epithelial, vascular, stromal and nerve bundle micro-environments. We identify and implicate peribronchial fibroblasts in lung disease. Importantly, we discover and validate a survival niche for IgA plasma cells in the airway submucosal glands (SMG). We show that gland epithelial cells recruit B cells and IgA plasma cells, and promote longevity and antibody secretion locally through expression of CCL28, APRIL and IL-6. This new 'gland-associated immune niche' has implications for respiratory health.


Conflict of interest statement

In the past three years, SAT has received remuneration for consulting and Scientific Advisory Board Membership from Genentech, Roche, Biogen, GlaxoSmithKline, Foresite Labs and Qiagen. SAT is a cofounder, board member and holds equity in Transition Bio. OS is a paid member of the Scientific Advisory Board of Insitro. The remaining authors declare no competing interests.

Figures

Fig. 1
Fig. 1. Spatial multi-omics atlas of the human lung allows the identification of cell types and their location.
a, Multi-omics spatial lung atlas experimental design included fresh and frozen sampling from five locations for scRNA-seq (seven donors), sc VDJ-seq (four donors), snRNA-seq (seven donors) and Visium ST (seven donors). Five donors (D) from the frozen samples were pooled into five reactions, each containing different locations (Loc) from donors. b, UMAP of all scRNA-seq/snRNA-seq from 193,108 cells/nuclei in total from ten donors. Cells from all major subsets were captured. c, cell2location mapping on Visium ST from a bronchi section shows matching of cell types to expected structures. H&E staining and cell abundance estimated by cell2location (density score) for ciliated, basal epithelium, AT1, AT2 and chondrocyte cell types with histology image in the background. Dotted lines circle the epithelium (pink), parenchyma (green) and cartilage (brown). d, Cell type groups are enriched in expected micro-anatomical tissue environments on Visium ST across sections from five donors. Cell type loadings are represented by both dot size and color for cell types annotated in b across the manually annotated micro-environments in the Visium data. e, Cell type capture is affected by protocol and location. Cell type proportion analysis with fold changes and LTSR score for all cell type groups with regard to the material, protocol and location. Dashed boxes highlight the greatest changes. AT1, alveolar type 1; AT2, alveolar type 2; LE, lymphatic endothelium; VE, vascular endothelium. The number of cells in each cell type group is shown in Supplementary Table 7 and online: https://www.lungcellatlas.org as variable Celltypes_master_high.
Fig. 2
Fig. 2. Lung and airway fibroblasts and their spatial location.
a, Sequential clustering reveals 11 fibroblast populations in airways and lungs on UMAP, colored by novelty as shown. b, Sample collection location and processing method affect cell type proportions. Poisson linear mixed model analysis of cell type composition within the fibroblast compartment, accounting for location, material, dissociation protocol and donor in the model. Cell type numbers are shown in Supplementary Table 7 and in online portal. c, Dot plot of IR-fibro marker genes that overlap with Fibroblast reticular cell and fDC markers. d,e, Cell2location density scores demonstrate that (d) IR-fibro colocalizes with a manually annotated immune infiltrate microenvironment in the airways, and (e) PB-fibro localizes around the airway epithelium. f, PB-fibro are associated with lung function (FEV1/FVC) in fGWAS analysis (logOR, 0.53; FDR, 0.014). Shown are the log odds ratios (logOR) obtained from fGWAS and their Wald confidence intervals (n = 19,414 genes) for several cell types. Substantially enriched cell types are marked in red (Wald test, BH multiple testing correction over 76 cell types, FDR < 0.1). g, Visium ST mapping of PC-fibro around the airway cartilage showing cell2location density scores. h, Schwann cells and NAF colocalize with peripheral nerve bundles in annotated Visium ST sections by cell2location. Cell type loadings are represented by both dot size and color. i, Nerve-associated cell type markers have distinct locations in the airway nerve bundles identified by smFISH staining. Donors used for replicas are shown in Supplementary Table 9. The marker gene probes for each cell type are given in each panel. Dashed lines surround the nerve bundles. j, Schematic representation of the described nerve-associated populations in the peripheral nerves of the airway. Fibro-alv, alveolar fibroblasts; fibro-adv, adventitial fibroblasts.
Fig. 3
Fig. 3. Cell types of systemic and pulmonary circulation.
a, UMAP visualization of scRNA-seq data from the vascular endothelia and smooth muscle compartments. Color of the dots shows cell type or location. Color of the text reflects novelty. b, Cell type proportion analysis with fold changes and LTSR score for the cell types with regard to the location and material. Cell type numbers are shown in Supplementary Table 7 and lungcellatlas.org. c, E-Art-syst colocalize with arterial vessel and SM-Art-syst in the airway in Visium ST. Cell2location density scores are shown for arterial endothelial and smooth muscle cell types localizing at arterial vessel. d, Marker gene dot plot of the smooth muscle compartment. e, IR-Ven-Peri expresses immune recruiting chemokines and cell–cell adhesion molecules shown by marker gene dot plot. f, E-Ven-syst and IR-Ven-Peri colocalize at a venous vessel in the airway in Visium ST sections shown by cell2location density scores at venous vessel. g, IR-Ven-Peri markers CCL21 and CCL19 localize adjacent to the venous vessel marker ACKR1 in the airway. Donors used for replicas are shown in Supplementary Table 9. Dashed lines in c, f and g represent vessel structures as relevant for each figure panel. h, Schematic of transcriptionally defined vascular cells in the systemic and pulmonary circulation. Created with BioRender. E = endothelial, SM = smooth muscle, Cap = capillary, Ven = venous, Art = arterial, Syst = systemic, Pulm = pulmonary, Peri = pericyte, ASM = airway smooth muscle, IR = immune recruiting.
Fig. 4
Fig. 4. IgA plasma cells in human airways colocalize with SMGs.
a, UMAP of scRNA-seq and snRNA-seq data from epithelial cells (excluding alveolar AT1 and AT2) colored by cell type, with a dot plot for the marker genes of SMG duct cells. b, smFISH staining of mucous (MUC5B), serous (LPO) and duct (ALDH1A3/RARRES1) cells in human bronchus. c, UMAP plots of myeloid, T/NK and B lineage cells, colored by cell type. d, Number of B lineage cells with different Ig isotypes in airway (trachea and bronchi) from the analysis of VDJ amplified libraries. e, Visium ST results show IgA plasma cells specifically localize in the glands. Normalized average cell abundance (dot size and color) are shown from cell2location for SMG and B lineage cell types across the manually annotated micro-anatomical tissue environments. H&E section of bronchi with manually annotated glands shown in blue (top panel), cell2location density scores for IgA plasma cells and SMG serous cells shown in lower panels. Cell type loadings are represented by both dot size and color. f, Unsupervised NMF analysis of Visium ST cell2location results for 11 factors, showing NMF factor loadings normalized per cell type (dot size and color). Factors 3 and 6 identify two separated factors in the SMG colocalizing IgA plasma cells, specifically with SMG serous cells (factor 3), but less with other SMG cell types (factor 6). Other factors and cell types are shown in Supplementary Fig. 4. g, Multiplex IHC staining of human trachea for the SMG structure (Hoechst for nuclei, EpCAM for epithelium, Phalloidin for actin, CD31 for vessels), B lineage markers (IgD, IgA2 and IgG) and CD4 T cells (CD45, CD3 and CD4). Arrowheads point to CD45+ CD3+ CD4+ cells. Scale bar 100 µm. h, Percentages of different isotypes of 470 B plasma cells from nasal, tracheal and bronchial brushes of two COVID-19 positives and three healthy control patients. Patients with over 20 plasma cells were considered. Donors used for replicas in b and g are shown in Supplementary Table 9. Macro, macrophage; CM, central memory; EM, effector memory; EMRA, effector memory re-expressing CD45RA.
Fig. 5
Fig. 5. Cell–cell signaling at the SMG for B cell recruitment and survival.
a, Expression of PIGR and CCL28 in epithelial cells by violin plot. b, CellChat cell–cell interaction analysis pathways for CCL chemokines produced by SMG epithelial cells and received by B cells (memory, naive and IgA/IgG/plasmablast combined) or CD4 T cells (CD4-naive/CM, CD4-EM/Effector and CD4-TRM combined) within airway tissue (trachea and bronchi). Arrow direction denotes chemokine-receptor pairs on specific cell types, arrowhead thickness reflects the relative expression of chemokine signal from each cell type. c,d, Expression dot plot of relevant chemokines and corresponding receptors as shown in b. e, smFISH (CCL28) and IHC (IgA2) staining in tracheal SMG. f, CellChat analysis as in b showing signaling of TNFSF13/APRIL and IL-6 from SMG epithelial cells to relevant B cell subsets and CD4-naive/CM. The proportion of the circle for each gene/cell type reflects the relative expression. g, smFISH (IL-6, TNFSF13/APRIL) and IHC (IgA2) staining in tracheal SMG. h, CellChat analysis as in f showing signaling from HLA genes expressed by SMG epithelial cells, signaling to CD4 on CD4 T cells. i, RNA expression of HLA-DRA, HLA-DRB1 and CD40 in B cells (as professional antigen-presenting cells for comparison) on violin plot, ciliated and SMG epithelial cells from scRNA-seq/snRNA-seq. j, IHC of HLA-DR and EpCAM in human airways showing strong expression of HLA-DR in the SMG (white dashed line) compared to the surface epithelium (yellow dashed line). k, IHC staining of CD4, CD45RO, HLA-DR and EpCAM, as indicated, in the airway SMG showing localization and close contact of CD4+ CD45RO+ T cells with HLA-DR+ glands as shown in the enlargement. Dotted lines enclose HLA-DR negative or low regions of glands, yellow arrowheads denote CD4+ CD45RO+ T cells, white arrowheads in the zoom-in show CD4+ CD45RO+ cells interacting with HLA-DR+ gland epithelial cells. Donors used for replicas in e, g, j and k are shown in Supplementary Table 9.
Fig. 6
Fig. 6. Schematic of the human airway GAIN.
Schematic of the GAIN showing immune cell recruitment and extravasation facilitated by venous endothelial cells and IR-Ven-Peri (immune recruiting venous perivascular cells) and signaling patterns between SMG epithelial cells, CD4 T cells, B naive/B memory cells and B plasma cells to attract immune cells and promote antigen-specific T cell-dependent and T cell-independent pathways, leading to IgA secretion at the SMG.
Extended Data Fig. 1
Extended Data Fig. 1. Overview of human lung dataset across five locations.
(a) H&E sections of full depth human tissue samples from multiple regions showing all major structures of the lungs and airways. (b) Expression of cell type marker genes in the master cell type groups, from both single cell and single nuclei RNA-seq combined. Color represents maximum normalised mean expression of marker genes in each cell group, and size indicates the proportion of cells expressing marker gene. Dashed box highlights chondrocyte marker genes. (c) Variance of gene expression explained by metadata variables in the combined sc/snRNA-seq dataset, scRNA-seq and snRNA-seq datasets. The whiskers correspond to 95% confidence intervals and the number of genes tested was 8,666 in cells/nuclei combined, 7,977 in cells, 7,260 in nuclei. 129,340 cells and 63,768 nuclei were analysed. (d) Protein staining of chondrocyte markers in the cartilage of human bronchus from the HPA. (e) Proportion of mesenchyme cell type groups in the airways from cells and nuclei. Numbers indicate chondrocytes in single cells versus single nuclei. (f) UMAP of sequencing material (cells or nuclei) and location (trachea, bronchi, parenchyma).
Extended Data Fig. 2
Extended Data Fig. 2. Novel fibroblast subsets.
(a) Dot plot of marker gene expression for indicated cell types. (b) UMAP of location and sequencing material from fibroblasts. (c) Heatmap showing annotated cell types to the predicted labels for fibroblasts from Travaglini et al. (Travaglini et al. 2020) by the Azimuth tool, coloured by proportion. Labels by the proportion of annotated cells and the total number of cells mapping to the reference. (d) Violin plots with predicted annotation score for each of the annotated cell types to the reference. Small dots represent cells, circles represent mean values and bars show standard deviation. (e) Dot plot showing the cell type cross-validation by transferring cell type labels from our single cell dataset (row) to cell types from Travaglini et al. 2020 (column). For each column (each cell type from the Travaglini et al. 2020), size of a dot denotes the proportion of cells assigned to a given cell type in our dataset and colour denotes the average probability. Highlighting marks the airway-enriched cell types.
Extended Data Fig. 3
Extended Data Fig. 3. Validation of immune recruiting fibroblasts and their tissue localisation.
(a) smFISH staining in human bronchi tissue for IR-Fibro markers (CCL21, CCL19) showing independent localisation from immune cells (PTPRC) and smooth muscle cells (ACTA2) marked by arrows. (b) H&E staining on Visium ST with manually annotated immune infiltrate in blue. cell2location mapping density scores with zoom into the region of interest, showing density values for IR-Fibro and relevant immune cells from the current lung study as well as for germinal centre cell types from a gut. Dashed lines are added for better visual comparison between the cell types and regions.
Extended Data Fig. 4
Extended Data Fig. 4. Peribronchial and perichondrial fibroblasts.
(a) Protein staining of PB-Fibro markers (COL15A and ENTPD1) in human bronchus sections from the HPA. (b) Marker genes for PB-fibro and PC-fibro. (c) Upregulated genes in COPD patient’s PB-fibro cells (74 cells, 12 donors) compared to controls (20 cells, 9 donors) from scRNAseq data9. Selected upregulated genes associated with COPD or emphysema by GWAS (RGCC, DGKH, NTM, SULF1, NPC2, RPL5, LMCD1, MRTFA, DENND5A, KLF4) or in other studies (NFATC2, MT2A and SIK2). Wilcoxon rank sum test p < 0.05 (two sided), exact P values and full list is in Supplementary Table 10. (d) Cell type proportion analysis using PLMM to compare fibroblasts in the extended HLCA across disease conditions with fold changes and Local True Sign Rate (LTSR). Covariates are listed in the methods. Cell abundances were analysed in Adams et al. 2020 dataset only, and validated in the extended HLCA (minus Adams et al. 2020). (e) Milo cell type abundance analysis of fibroblasts from the HLCA comparing IPF patients and healthy controls. UMAP of fibroblast clusters, neighbourhood enrichment UMAP showing log fold change in IPF compared to healthy, and violin plot of log fold change of the neighbourhood for each cell, grouped by cell type. Dashed line highlights the region of PB fibros on the UMAPs. (f) Protein staining of PC-Fibro marker (COL12A1) in human bronchus from the HPA mapping to cartilage. (g) UMAP of adventitial fibroblasts, PC-fibro and chondrocytes from single nuclei data coloured by monocle 3 pseudotime and cell type. (h) Expression of genes associated with bone/cartilage function, markers of PC-fibro and cartilage genes in the nuclei as shown on (g), ordered by pseudotime. (i) PC-fibro marker gene enrichment in Human Phenotype Ontology by g:Profiler.
Extended Data Fig. 5
Extended Data Fig. 5. Schwann cells and nerve-associated fibroblasts (NAF).
(a) Marker dot plot for myelinating, non-myelinating Schwann cells and for epi- and endoneurial NAF-s. (b, c) g:Profiler gene set enrichment results using g:GOSt method and g:SCS threshold and multiple testig correction with flat list as input for myelinating Schwann cell markers with detailed results for myelination and transcription factor EVX1 (b) and for non-myelinating Schwann cell markers (c). (d) Expression of neuropathy associated genes in Schwann and NAF cell types. Previously unknown cell type specific expression shown in colour: light green for novel expression pattern, light blue for distinguishing expression for nmSchwann cells. (e) Expression in Transcript per million (TPM) of NAF markers in GTEx bulk RNA-seq data. (f) Visium ST H&E staining of human bronchi, with zoom in on nerve bundle and cell2location cell type mapping density scores for Schwann and NAF cell types. (g-i) HPA antibody staining of (g) non-myelinating Schwann cell markers (CADM, GRIK2, NCAM1, ITGB4 and L1CAM) (h) endoneurial NAF marker (USP54) and (i) perineurial NAF markers (SLC22A3 and SORBS1) within the nerve bundles in human bronchus. Arrows indicate nerve bundles. (j) RNAscope staining for myelinating (MLIP) and non-myelinating (SCN7A, SOX10) Schwann cell and perineurial (SLC2A1) NAF specific genes in bronchial nerves.
Extended Data Fig. 6
Extended Data Fig. 6. Vascular and smooth muscle cell types.
(a) Markers dot plot for vascular endothelia. (b) cell2location density scores of pulmonary and vascular endothelium for parenchyma and bronchi Visium ST sections. (c) Bronchi section with H&E and cell2location analysis density score for airway smooth muscle population on a Visium ST slide. (d) NPR2 staining in oesophagus and bronchus from the HPA. Black arrows indicate the airway and oesophagus surrounding non-vascular smooth muscle. (e) ASM marker expression in all GTEx tissues. Tissues are ordered by unsupervised clustering based on expression similarity. The dotted line highlights tissues which are surrounded by a thick smooth muscle layer. The orange rectangle shows muscular tissues from oesophagus, and the blue rectangle shows the non-muscular mucous layer of oesophagus tissue. (f) IR-Ven-peri markers localise at the venous vessels in the airway. smFISH staining for IR-Ven-peri (CCL21, CCL19), venous endothelia (ACKR1) and smooth muscle (ACTA2) markers. (g) Leukocyte rolling and homing genes, and chemokines expressed in Endothelia and SM/Perivascular cells together with their interaction partners expression in immune cell groups. Interaction partners are indicated with blue shades.
Extended Data Fig. 7
Extended Data Fig. 7. Epithelial cell annotations and location specific ciliated cell gene expression.
(a) Marker gene expression dot plot for airway epithelial cells. (b) UMAP of airway epithelial cells from scRNA-seq data. (c) Cell type proportion analysis with fold changes and Local True Sign Rate (LTSR) score for all cell type groups with regards to variables shown. Cell numbers are in Supplementary Table 7. (d) smFISH staining for mucous (MUC5B), serous (LPO) and duct (MIA) cell markers in human bronchi sections. (e) smFISH staining of secretory goblet/club (SCGB1A1), ciliated (FOXJ1) and duct (ALDH1A3/RARRES1) in human bronchus section. (f) Visium ST H&E from bronchial section and cell2location density values for mapping duct, mucous, serous, ciliated and myoepithelial cells. (g) RNA velocity results on UMAP from scRNAseq of airway epithelia. Colours indicate cell types as in (b). (h) Myoepithelial marker gene expression dot plot. (i) smFISH staining for muscle (TAGLN), basal epithelia (KRT14), duct (ALDH1A3) and myoepithelium (FHOD3) in human bronchi sections. (j) HPA staining for muscle and epithelial marker proteins in human bronchial glands. (k) Unsupervised non-negative matrix factorisation (NMF) analysis of Visium ST cell2location results for 11 factors showing NMF factor loadings normalised per cell type (dot size and colour). Other factors/cell types are shown in Supplementary Fig. 4. (l) Violin plots of normalised log-transformed expression separated by location in the single nuclei RNA-seq data for 3 genes upregulated (methods) in nasopharyngeal carcinoma gene set from GSEA database with LTSR>0.9 consistently higher expressed in the trachea. (m) SARS-CoV-2 receptor and viral entry gene (ACE2) expression in ciliated cells from snRNA-seq data shown by location in a violin plot.
Extended Data Fig. 8
Extended Data Fig. 8. Immune cell type groups.
(a) Marker gene expression plot along with UMAP for Megakaryocytes and Mast cells. (b) Marker genes dot plot for Myeloid cells. (c) Marker genes dot plot for T & NK cells. (d) cell2location density scores for CD8-TRM, Ciliated and CD8-EM cell types in human bronchi sections and corresponding H&E. (e) Fraction of clonally expanded cells in T & NKT cell types from VDJ data. (f) Proportion of shared TCR clonotypes between samples from VDJ data. Colour bars indicate location and donor. (g-i) Effects of location, donor, material and protocol on immune cell type proportions (assessed by PLMM) are shown by forest plots. Each square dot with an error bar shows the square root of variance explained by each factor and its 95% confidence interval, respectively. Dotplots show point estimates of fold changes and Local True Sign Rate (LTSR) for myeloid cell types (g), T & NK cell types (h) and B lineage cell types (i). The number of cells in each cell type group are in Supplementary Table 7.
Extended Data Fig. 9
Extended Data Fig. 9. Additional data on B lineage and IgA plasma cell localisation.
(a) Marker gene expression dot plot for B-lineage cells. (b) Gene expression dot plot for top differentially expressed genes between IgA and IgG plasma cells. (c) Number of B lineage cells with different Ig isotypes in parenchyma from the analysis of VDJ amplified libraries. (d, e) HPA staining for B plasma marker MZB1 in the bronchus.(d) and nasopharyngeal glands.(e). (f) Spatial localisation of selected NMF factors (total N=11, Figure 4f, Supplementary Fig. 4) from unsupervised NMF analysis of Visium ST cell2location results. The total cell abundance of constituent cell types for factors 3 and 6 are shown on a bronchi section, with H&E and manual gland annotations shown for reference. White dashed lines highlight mucous/duct (factor 6) specific areas. (g) An example of FFPE Visium slide region with mucous and non-mucous glands annotated per voxel, and enrichment of cell types by cell2location in the micro-anatomical tissue environments across 2 FFPE sections (trachea and bronchi 2-3) from 1 donor. (h) Multiplex IHC of human trachea for Ig isotypes (IgA, IgG, IgD) showing distinction between glands (dashed lines) and non-gland regions of tissue. (i) IgA staining in mouse colon and trachea from wild type C57/BL6 mice from Charles River, USA or Kindai University, Japan (where specified). Representative staining from 2 experiments, 3 sections per experiment. AF = autofluorescence (shown in red). Arrows showing clusters of IgA plasma cells at the epithelial surface in tracheal sections.
Extended Data Fig. 10
Extended Data Fig. 10. Additional gland associated immune niche data - interactions of gland epithelial cells with immune cells.
(a) Expression dot plot of genes relevant for Figure 5h. (b) Co-staining of CCL28 RNA/protein and IgA2 protein in airway submucosal glands, left: smFISH; right: IHC for CCL28. (c) Expression of TNFSF13, IL-6 and CCL28 in SMG-Serous and Duct cell sc/snRNAseq data along the tracheobronchial tree. Change in CCL28 in serous cells was statistically significant with two-sided Spearman’s rank correlation (methods) (p-values 1.6 × 10-8, 0.0034 and 1.3 × 10-5 for donors A37, A41 and A42 correspondingly). (d) smFISH on the human trachea with DAPI, TNFSF13/APRIL, RARRES1 and LPO. Dashed lines show regions of duct, mucous and serous glands. (e) smFISH (TNFSF13/APRIL, and CD79A) and IHC (IgA2) of human tracheal SMG showing APRIL+ and APRIL- glands annotated. (f) Violin plot for expression of AICDA in B cell subsets. (g) IHC from the HPA showing HLA-DR, MUC5B and PRR4 staining with HLA-DR+ regions corresponding with non-mucous areas of gland. Red/purple dashed lines indicate mucous/serous cells respectively based on morphology and/or marker gene expression. (h) smFISH (MUC5B) plus IHC (HLA-DR) staining in human airway SMG. (i) IHC staining of CD4, CD45RO (memory marker), CD45RA (naive marker), IgA2 and EpCAM in the SMG. Blue arrows indicate CD4+CD45RA+ cells. (j) IHC staining of HLA-DR, EpCAM, CD3, CD31 and CD4 in the airway SMG. Arrows point to CD3+CD4+ cells. (k) IHC staining of CD4, CD45RO, HLA-DR and EpCAM in the airway SMG showing close interactions between CD4+CD45RO+ T cells with HLA-DR+ glands. Arrows point to CD4+CD45RO+ cells.

Comment in

References

    1. Angelidis, I. et al. An atlas of the aging lung mapped by single cell transcriptomics and deep tissue proteomics. Nat. Commun.10, 963 (2019). - PMC - PubMed
    1. Kato, A., Hulse, K. E., Tan, B. K. & Schleimer, R. P. B-lymphocyte lineage cells and the respiratory system. J. Allergy Clin. Immunol.131, 933–957 (2013). - PMC - PubMed
    1. Schiller, H. B. et al. The human lung cell atlas: a high-resolution reference map of the human lung in health and disease. Am. J. Respir. Cell Mol. Biol.61, 31–41 (2019). - PMC - PubMed
    1. Ardini-Poleske, M. E. et al. LungMAP: the molecular atlas of lung development program. Am. J. Physiol. Lung Cell. Mol. Physiol.313, L733–L740 (2017). - PMC - PubMed
    1. Wilbrey-Clark, A., Roberts, K. & Teichmann, S. A. Cell atlas technologies and insights into tissue architecture. Biochem. J.477, 1427–1442 (2020). - PMC - PubMed

Publication types

Substances