. 2023 Jan;25(1):20-29.
doi: 10.1038/s41556-022-01027-2. Epub 2022 Dec 21.

Sphingolipid subtypes differentially control proinsulin processing and systemic glucose homeostasis

Affiliations

Sphingolipid subtypes differentially control proinsulin processing and systemic glucose homeostasis

Kerstin Griess et al. Nat Cell Biol. 2023 Jan.

Abstract

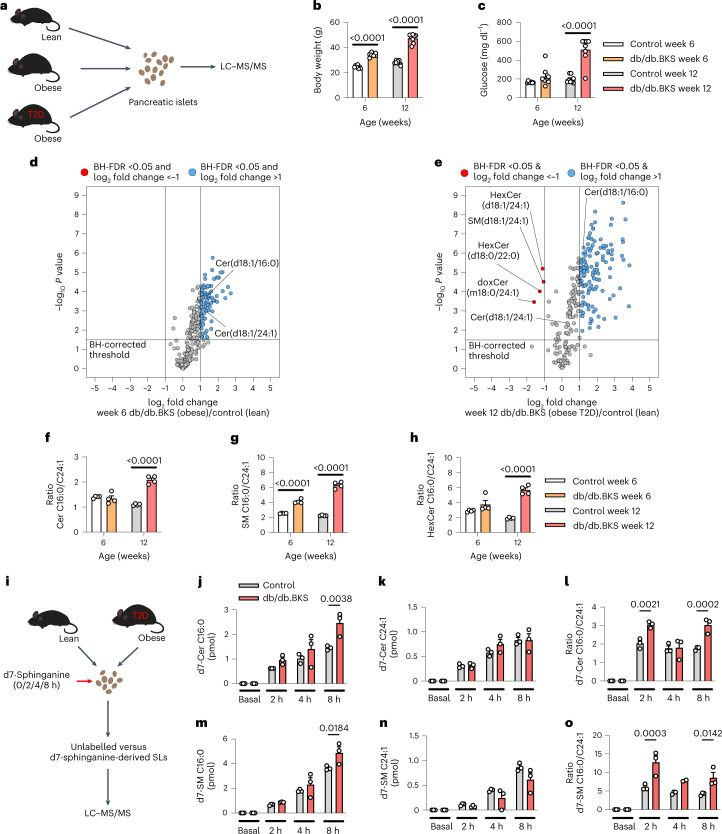
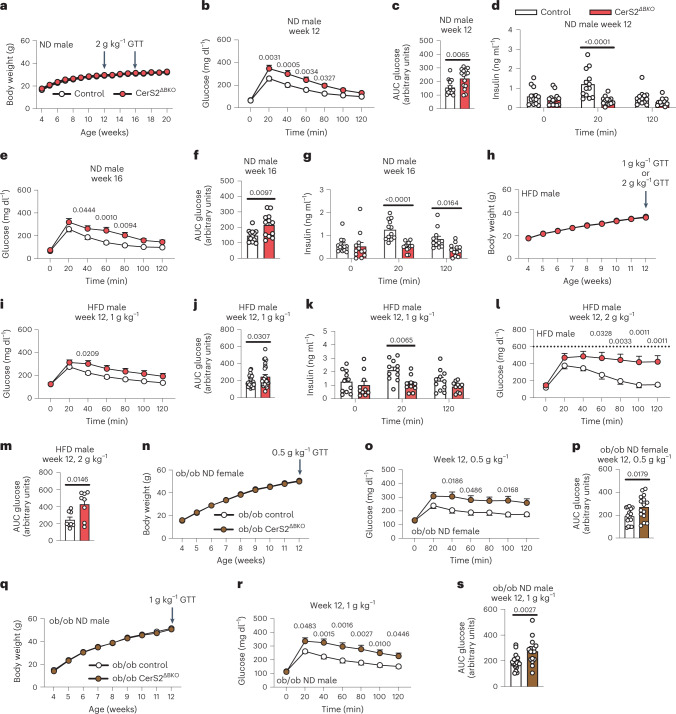
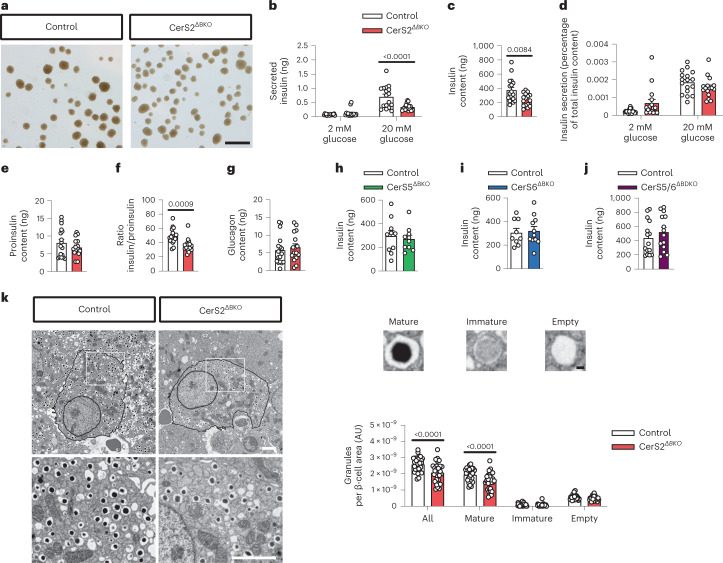
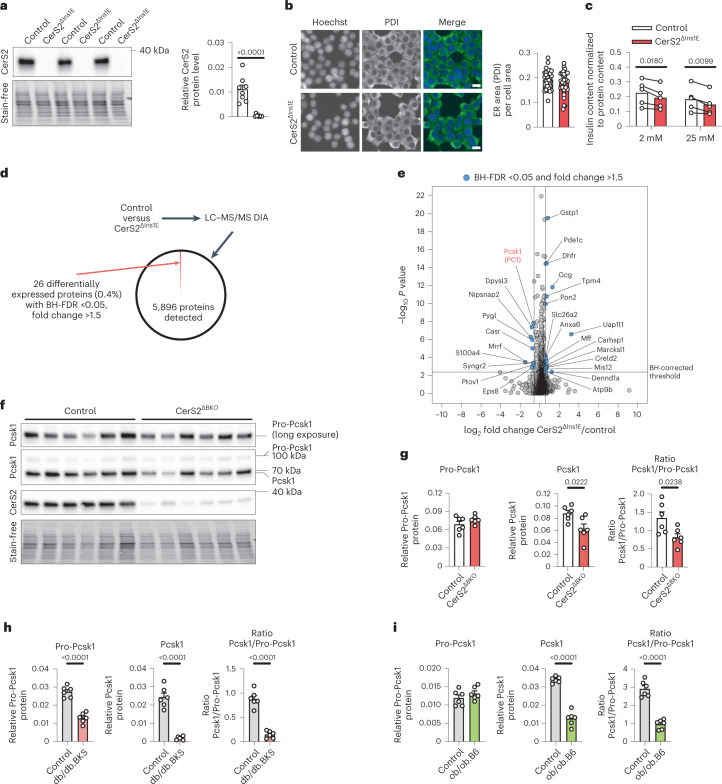
Impaired proinsulin-to-insulin processing in pancreatic β-cells is a key defective step in both type 1 diabetes and type 2 diabetes (T2D) (refs. 1,2), but the mechanisms involved remain to be defined. Altered metabolism of sphingolipids (SLs) has been linked to development of obesity, type 1 diabetes and T2D (refs. 3-8); nonetheless, the role of specific SL species in β-cell function and demise is unclear. Here we define the lipid signature of T2D-associated β-cell failure, including an imbalance of specific very-long-chain SLs and long-chain SLs. β-cell-specific ablation of CerS2, the enzyme necessary for generation of very-long-chain SLs, selectively reduces insulin content, impairs insulin secretion and disturbs systemic glucose tolerance in multiple complementary models. In contrast, ablation of long-chain-SL-synthesizing enzymes has no effect on insulin content. By quantitatively defining the SL-protein interactome, we reveal that CerS2 ablation affects SL binding to several endoplasmic reticulum-Golgi transport proteins, including Tmed2, which we define as an endogenous regulator of the essential proinsulin processing enzyme Pcsk1. Our study uncovers roles for specific SL subtypes and SL-binding proteins in β-cell function and T2D-associated β-cell failure.


Conflict of interest statement

The authors declare no competing interests.

Figures

Fig. 1
Fig. 1. A lipid signature of T2D-associated β-cell failure.
a, Experimental design for lipidomics of T2D islets. b,c, Body weight and blood glucose levels of control and db/db.BKS mice at weeks 6 and 12 (n = 8 control versus 8 db/db.BKS mice per age). d,e, Volcano plot showing log2 fold change of lipids in islets between lean control and obese but normoglycaemic db/db.BKS mice at 6 weeks of age (d) or in islets of lean control and obese and diabetic db/db.BKS mice at 12 weeks of age (e) plotted against the −log10 P value of a two-sided equal variance t-test. Log2 fold change >1 and BH-FDR <0.05 was used as cut-off for significance (n = 4 control versus 4 db/db.BKS islet replicates per age). Only lipids detected in all samples were used for calculation. Full dataset can be found in Supplementary Tables 1 and 2. fh, Ratio of C16:0/C24:1 ceramides (f), SM (g) and hexosylceramides (h) in control and db/db.BKS islets at the age of 6 and 12 weeks (n = 4 control versus 4 db/db.BKS islet replicates per age; same dataset as in d and e). i, Experimental design for investigating de novo sphingolipogenesis in islets from 12-week-old male db/db.BKS and control mice using d7-sphinganine. j,k, Comparison of de novo synthesized d7-C16:0 (j) and d7-C24:1(k) ceramides in islets from db/db.BKS and control mice after 0, 2, 4 and 8 h of pulsing with d7-sphinganine. l, Ratio of de novo synthesized d7-C16:0/d7-C24:1 ceramides in islets from db/db.BKS and control mice after 0, 2, 4 and 8 h of pulsing with d7-sphinganine. m,n, Comparison of de novo synthesized d7-C16:0 (m) and d7-C24:1 (n) SMs in islets from db/db.BKS and control mice after 0, 2, 4 and 8 h of pulsing with d7-sphinganine. o, Ratio of de novo synthesized d7-C16:0/d7-C24:1 SMs in islets from db/db.BKS and control mice after 0, 2, 4 and 8 h of pulsing with d7-sphinganine. For jo, n = 3 control versus 3 db/db.BKS islet replicates. Statistical analysis in b, c and fh was performed using two-way ANOVA with uncorrected Fisher’s least significant difference test. Two-way ANOVA with Sidak’s multiple comparisons test was used in jo. P values are stated in each figure. Data points in b and c indicate individual mice. Data points in fh represent islet replicates; one replicate equals 65 islets picked from one to two pools of islets from four to eight individual mice, respectively. Data points in jo represent islet replicates; one replicate equals 60 islets picked from one islet pool from nine to ten individual mice, respectively. Bar graphs represent mean ± s.e.m. Source numerical data are available in source data. Source data
Fig. 2
Fig. 2. Impaired GSIS and glucose tolerance in CerS2ΔBKO mice.
a, Body weight of male control and CerS2ΔBKO mice fed ND (n = 16-17 control versus 16-17 CerS2ΔBKO mice). b, Glucose levels during intra-peritoneal GTT in ND-fed control and CerS2ΔBKO mice at week 12 (n = 16 control versus 14 CerS2ΔBKO mice). c, Area under the curve (AUC) for glucose levels depicted in b. d, Plasma insulin levels before injection, 20 min and 120 min after glucose injection in GTT depicted in b (n = 13 control versus 13 CerS2ΔBKO mice). e, Glucose levels during GTT in ND-fed control and CerS2ΔBKO mice at week 16 (n = 12 control versus 12 CerS2ΔBKO mice). f, AUC for GTT depicted in e. g, Plasma insulin levels before injection, 20 min and 120 min after glucose injection in GTT depicted in e (n = 13 control versus 13 CerS2ΔBKO mice). h, Body weight of male HFD-fed control and CerS2ΔBKO mice (n = 33 control versus 30-32 CerS2ΔBKO mice). i, GTT glucose levels after 1 g kg−1 glucose bolus injection in male HFD-fed control and CerS2ΔBKO mice at week 12 (n = 30 control versus 27 CerS2ΔBKO mice). j, AUC during GTT depicted in i. k, Plasma insulin levels before injection, 20 min and 120 min after glucose injection in GTT depicted in i (n = 11 control versus 10 CerS2ΔBKO mice). l, GTT glucose levels after 2 g kg−1 glucose bolus injection in male HFD-fed control and CerS2ΔBKO mice at week 12 (n = 8 control versus 8 CerS2ΔBKO mice). Dashed line indicates detection limit of glucometer. m, AUC of GTT depicted in l. n, Body weight of female ob/ob control and ob/ob CerS2ΔBKO mice (n = 15 ob/ob control versus 15 ob/ob CerS2ΔBKO mice). o, Glucose levels during GTT of female ob/ob control and ob/ob CerS2ΔBKO mice at week 12 (n = 15 ob/ob control versus 15 ob/ob CerS2ΔBKO mice). p, AUC of glucose levels during GTT depicted in o. q, Body weight of male ob/ob control and ob/ob CerS2ΔBKO mice (n = 11–19 ob/ob control versus 11-19 ob/ob CerS2ΔBKO mice). r, Glucose levels during GTT of male ob/ob control and ob/ob CerS2ΔBKO mice at week 12 (n = 19 ob/ob control versus 17 ob/ob CerS2ΔBKO mice). s, AUC of glucose levels during GTT depicted in r. Statistical analysis was performed using a two-sided Student’s t-test (c, f, j, m, p and s), two-way ANOVA with Sidak’s multiple comparisons test (b, d, e, g, i, k, l, n, o and r) or mixed-effects models with Sidak’s multiple comparisons test (a, h and q). P values are stated in each figure. Data points in c, d, f, g, j, k, m, p and s represent individual mice. Bar graphs and data points in a, b, e, h, i, l, n, o, q and r represent mean ± s.e.m. Source numerical data are available in source data. Source data
Fig. 3
Fig. 3. Proinsulin processing and insulin content is CerS2 dependent.
a, Representative images of control and CerS2ΔBKO islets. A lighter colour of CerS2ΔBKO islets is noticeable, indicating reduced insulin content. Scale bar, 500 μm. b, Insulin secretion during low (2 mM) and high (20 mM) glucose static incubation of islets from male ND-fed control and CerS2ΔBKO mice. Age of mice, 26 ± 2 weeks (mean ± s.d.). c, Insulin content of islets from male ND-fed control and CerS2ΔBKO mice. d, Insulin secretion of islets from male ND-fed control and CerS2ΔBKO mice normalized to insulin content. e, Proinsulin content of islets from male ND-fed control and CerS2ΔBKO mice. f, Ratio of insulin and proinsulin content in islets from male ND-fed control and CerS2ΔBKO mice. g, Glucagon content in islets from male ND-fed control and CerS2ΔBKO mice. h, Insulin content of islets from male ND-fed control and CerS5ΔBKO mice. Age of mice, 20 ± 2 weeks. i, Insulin content of islets from male ND-fed control and CerS6ΔBKO mice. Age of mice, 22 ± 3 weeks. j, Insulin content of islets from male ND-fed control and CerS5/6ΔBDKO mice. Age of mice, 18 ± 3 weeks. k, Representative electron microscopic pictures of isolated islets from adult male ND-fed control and CerS2ΔBKO mice. Scale bars, 2 µm (β-cell) and 100 nm (magnified vesicles). Mature, immature and empty vesicles were counted and quantified by normalization to total β-cell area. n = islets of 17 control versus 16 CerS2ΔBKO mice from four independent experiments (bg), islets of 10 control versus 10 CerS5ΔBKO mice from three independent experiments (h), islets of 9 control versus 11 CerS6ΔBKO mice from three independent experiments (i) and islets of 15 control versus 14 CerS5/6ΔBDKO mice from four independent experiments (j). For k, islets from four control and four CerS2ΔBKO mice were pooled, respectively, and 29 individual β-cells from each pool were quantified. Statistical analysis was performed using a two-sided Student’s t-test (c and ej) or two-way ANOVA with Sidak’s multiple comparisons test (b, d and k). P values are stated in each figure. Each data point in bj represents the mean of three replicates of seven islets, respectively, from one individual animal. Data points in k represent individual β-cells. Bar graphs represent mean ± s.e.m. Source numerical data are available in source data. Source data
Fig. 4
Fig. 4. Abundance of the proinsulin processing enzyme Pcsk1 is CerS2 dependent.
a, Verification of loss of CerS2 in CerS2ΔIns1E cells by immunoblot. Left: representative immunoblot. Right: quantification of Cers2 signals (n = 8 independent experiments). b, Representative immunostaining (left) and quantification (right) of ER marker PDI in control and CerS2ΔIns1E cells (n = 36 control versus 28 CerS2ΔIns1E well sites from one experiment). Scale bar, 10 μm. c, Quantification of insulin content in control and CerS2ΔIns1E cells at low (2 mM) and high (25 mM) glucose levels (n = 5 independent experiments). d, Experimental design and results for proteome analyses in control and CerS2ΔIns1E cells. e, Volcano plot showing log2 fold change of proteins between CerS2ΔIns1E and control cells plotted against the −log10 P value of a two-sided paired Student’s t-test. BH-FDR <0.05 and fold change >1.5 was used as significance cut-offs (n = 3 control versus 3 CerS2ΔIns1E samples collected in three independent experiments). f,g, Immunoblot detection of Pro-Pcsk1 and Pcsk1 protein levels in islets of control and CerS2ΔBKO mice. f, Representative immunoblot. Each lane represents islets of one individual mouse. g, Quantification of Pro-Pcsk1 (left) and Pcsk1 (middle) protein levels and ratio of Pcsk1/Pro-Pcsk1 (right; n = islets of six control versus six CerS2ΔBKO mice). h, Immunoblot detection of Pro-Pcsk1 and Pcsk1 protein levels in islets of 12-week-old control and db/db.BKS mice. Quantification of Pro-Pcsk1 (left) and Pcsk1 (middle) protein levels and ratio of Pcsk1/Pro-Pcsk1 (right; n = islets of six control versus six db/db.BKS mice). Representative immunoblot is shown in Extended Data Fig. 4d. i, Immunoblot detection of Pro-Pcsk1 and Pcsk1 protein levels in islets of 12-week-old control and ob/ob.B6 mice. Quantification of Pro-Pcsk1 (left) and Pcsk1 (middle) protein levels and ratio of Pcsk1/Pro-Pcsk1 (right; n = islets of six control versus six ob/ob.B6 mice). Representative immunoblot is shown in Extended Data Fig. 4e. Statistical analysis was performed using a two-sided Student’s t-test (a, b, g, h and i) and two-way ANOVA with Sidak’s multiple comparisons test (c). P values are stated in each figure. Bar graphs represent mean (c) or mean ± s.e.m. (a, b, g, h and i). Connecting lines indicate both samples are from one experiment. Data points in b represent individual well sites. Data points in a and c represent independent experiments. Data points in gi represent islets from individual mice. Stain-free signal was used for normalization of all immunoblots. Source numerical data and unprocessed blots are available in source data. Source data
Fig. 5
Fig. 5. SL–protein interactomics reveals a role for Tmed2 in proinsulin processing.
a, Experimental setup for identification of SBPs in a SILAC-based approach. pacSph treatment of Sgpl1ΔIns1E and CerS2:Sgpl1ΔIns1E cells differentially labelled with stable isotopes allows crosslinking of SL-protein complexes by UV irradiation (with omission of UV irradiation as a control condition), followed by cell lysis and conjugation of biotin to the SL-protein complexes. After Streptavidin-based pull-down, SBPs can be identified and quantified in the same MS run by the differing peptide mass due to SILAC isotope labelling. b, Volcano plot showing log2 fold change of proteins pulled down from pacSph-treated Sgpl1ΔIns1E (+UV) versus Sgpl1ΔIns1E (−UV) cells plotted against the −log10 P values of a one-sample two-sided t-test against 0. Proteins with log2 fold change >1 and a BH-FDR <0.05 are regarded as SBPs (n = 4 independent experiments). c, Volcano plot showing log2 fold change of SBPs identified in b (Supplementary Fig. 3e) and pulled down from pacSph-treated CerS2:Sgpl1ΔIns1E (+UV) versus Sgpl1ΔIns1E (+UV) cells plotted against the −log10 P values of a two-sample two-sided equal variance t-test (n = 4 independent experiments). SBPs with a fold change >1.5 and a BH-FDR <0.05 were regarded as Cers2-dependent SBPs. Fold enrichment was 6.55 and FDR-corrected P value was 3.12−10 for GO term ‘endoplasmic reticulum’. d, pacSph pull-down of endogenous Tmed2 in SgplΔIns1E and Sgpl1:CerS2ΔIns1E cells (n = 4 independent experiments); exemplary immunoblot (right) and quantification (left). Eluate intensities were normalized to respective input intensities. e, Relative mRNA expression of Tmed1, Tmed2 and Pcsk1 in murine pseudoislets transfected with control siRNA or siRNA against Tmed1, Tmed2 or both. n = 4 independent experiments. fi, Immunoblot detection of Pro-Pcsk1 and Pcsk1 protein levels in pseudoislets transfected with siRNA as described in Extended Data Fig. 8e; n = 3 independent experiments. f, Representative immunoblot. g, Quantification of Pcsk1. h, Quantification of Pro-Pcsk1. i, Ratio of Pcsk1 to Pro-Pcsk1. jl, Insulin content (j), proinsulin content (k) and ratio of insulin to proinsulin (l) in pseudoislets transfected with siRNA as described in Extended Data Fig. 8e determined via ELISA (n = 8 independent experiments). Statistical analyses were performed using one-way ANOVA with Tukey’s multiple comparisons test (d) and repeated measures one-way ANOVA with Tukey’s multiple comparisons test (e and gl). In e, ANOVA was performed for each mRNA target individually. P values are stated in each figure. Data points in d, e and gl represent individual experiments. Bar graphs represent mean ± s.e.m. For one experiment in jl, the mean of five replicates, consisting of nine pseudoislets, respectively, was plotted per condition. Stain-free signal was used for normalization of immunoblots in gi. Source numerical data and unprocessed blots are available in source data. Source data
Extended Data Fig. 1
Extended Data Fig. 1. Additional data of islet lipidomics from a T2D model.
a, Graphical overview of CerS2, CerS5 and CerS6 and their major ceramide products, respectively. b, Structures of all four SLs with significantly reduced abundance identified in (Fig. 1e). c-e, Comparison of Ceramide (c), sphingomyelin (d) and hexosylceramide (e) species of different side chain lengths in islets of lean control mice, obese and normoglycemic and obese type 2 diabetic mice (n = 4 control vs. 4 db/db.BKS islet replicates per age; same dataset as in Fig. 1d-h). Statistical analysis on selected lipid species was performed using two-way ANOVA with uncorrected Fisher’s LSD test. Data points in (c-e) represent islet replicates. One replicate equals 65 islets picked from 1-2 pools of islets from 4-8 individual mice, respectively. Bar graphs represent means + s.e.m. To ensure readability, only p-values for selected comparisons are stated in each figure. Source numerical data are available in source data. Source data
Extended Data Fig. 2
Extended Data Fig. 2. The islet sphingolipidome of Akita and ob/ob.B6 mice.
a, b, Body weight (a) and blood glucose levels (b) of 13 male control and 14 ob/ob.B6 mice at week 12. c-h, Ceramide (c), sphingomyelin (e) and hexosylceramide (g) species and ratios of C16:0/C24:1 ceramides (d), sphingomyelins (f) and hexosylceramides (h) in islets of 8 male control and 8 ob/ob.B6 mice at week 12. i, j, Body weight (i) and blood glucose levels (j) of 12 female control and 11 Akita mice at week 7. k-p, Sphingolipid measurements as described in (c-h) in islets of 8 female control and 6 Akita mice at week 7. q, Percent increase in the C16:0/C24:1 ratio of specific sphingolipids in islets of male db/db.BKS, female Akita and male ob/ob mice to their respective controls (calculations based on lipidomics analyses shown in Fig. 1 and Extended Data Fig. 1). r, s, Body weight (r) and blood glucose levels (s) of 9 male control and 10 db/db.BKS mice at week 12 which were used for analyses shown in Fig. 1j-o. t, Volcano plot showing log2 fold change of baseline lipid measurements (shown in Fig. 1j-o) plotted against the –log10 p-value of a two-sided equal variance t-test. Cutoffs for significance as in Fig. 1d, e (n = 3 control vs. 3 db/db.BKS islet replicates). Only lipids detected in all samples were used for calculation. Statistics were performed using a two-sided Student’s t-test in (a, b, d, f, h-j, l, n, p, r, s) and multiple two-sided t-tests with Holm-Sidak correction in (c, e, g, k, m, o). Data points in (a-p, r, s) represent individual mice. Bar graphs in (a-p, r, s) represent means + s.e.m. Bar graphs in (q) represent values based on mean calculations of the respective groups presented in Fig. 1 and in this Figure. Source numerical data are available in source data. Source data
Extended Data Fig. 3
Extended Data Fig. 3. Additional phenotyping of pancreata and islets of ND-fed CerS2ΔBKO mice.
a, Pancreas weight of 16 adult male control and 16 adult male CerS2ΔBKO mice. Mean age of mice, 5 months. b, Insulin content of pancreatic extracts of 9 adult male control and 8 adult male CerS2ΔBKO mice. Mean age of mice, 8 months. c, Pancreas weight of 17 adult female control and 17 adult female CerS2ΔBKO mice. Mean age of mice, 5 months. d, Insulin content of pancreatic extracts of 9 adult female control and 8 adult female CerS2ΔBKO mice. Mean age of mice, 7 months. e, Ratio of insulin and proinsulin content in islets from 4 adult male control and 4 adult male CerS2ΔBKO mice, as detected in H.L.´s laboratory after shipment of live islets from B-F.B.´s laboratory. Mean age of mice, 4 months. f-h, Relative mRNA expression of different CerS and beta cell identity genes in islets of control and CerS5ΔBKO (f), CerS6ΔBKO (g) and CerS5/6 ΔBKO (h) mice. n = islets of 4 control vs. 4 CerS5ΔBKO mice (f); 3 control vs. 5 CerS6ΔBKO mice (g); 5 control vs. 4 CerS5/6ΔBKO mice (h). i, Beta cell granularity reflected by mean SSC-A signal of beta cells from control and CerS2ΔBKO mice (n = 6 control vs. 6 CerS2ΔBKO mice, both expressing a TdTomato reporter protein in a Cre-dependent manner). Statistical analysis was performed using unpaired two-sided Student’s t-test (a-e, i) or multiple two-sided t-tests with Holm-Sidak correction (f-h). Data points depict pancreata from unique mice (a-d), islets from individual mice (f-i) or the mean of three replicates of 15 islets, respectively, from four individual animals per genotype (in e). Bar graphs represent mean + s.e.m. p-values are stated in each figure. SSC-A, side scatter-area. Source numerical data are available in source data. Source data
Extended Data Fig. 4
Extended Data Fig. 4. Pro-Pcsk1 and Pcsk1 protein abundance in CerS2-deficient cells and islets of metabolically impaired mouse models.
a, Quantification of Pcsk1 levels in control and CerS2ΔIns1E cells by CrispR-verified antibody (Supplementary Fig. 2o, Cell Signaling #11914, discontinued). Left, representative immunoblot. Right, quantification of Pcsk1 signals (n = 5 independent experiments). b, Quantification of Pcsk1 protein levels in control and CerS2BKO islets by CrispR-verified antibody (Supplementary Fig. 2o, Cell Signaling #11914, discontinued). Left, representative immunoblot. Right, quantification of Pcsk1 signals (n = 8 independent experiments). c, Quantification of Pcsk1 mRNA levels in islets from male control and CerS2BKO mice by qPCR (n = 5 independent experiments). d, Representative immunoblots to Fig. 4h. e, Representative immunoblots to Fig. 4i. f, g, Quantification of mRNA levels of Pcsk1 and various CerS in islets of 12 week old control and db/db.BKS mice (f, n = 4 control and 4 db.db/BKS islet samples) and islets of 12 week old control and ob/ob.B6 mice (g, n = 4 control and 6 ob/ob.B6 islets samples). Statistical analysis was performed using a paired two-sided Student’s t-test (a, b), two-sided Student’s t-test (c) and two-sided multiple t-tests with Holm-Sidak correction (f, g). P-values are stated in each figure. Bar graphs represent means (a, b) or means + s.e.m. (c, f, g). Connecting lines indicate both samples are from one experiment. Data points represent independent experiments (a), islets from individual mice (c) or individual islet samples (f, g). Stain-Free signal was used for normalization of all immunoblots. Source numerical data and unprocessed blots are available in source data. Source data
Extended Data Fig. 5
Extended Data Fig. 5. Adenoviral CerS6 overexpression does not affect Pcsk1 levels.
a, Immunoblot detection of human CerS6 (hCerS6) and Tmed2 protein levels in INS1E cells after overexpression of hCerS6 via adenovirus for 48 h (representative immunoblot). b, Ins1E cell counts after 48 hours of infection with a control adenovirus or hCerS6-expressing adenovirus (n = 3 independent experiments). A reduction of cell counts is in line with the ability of CerS6 overexpression to induce apoptosis in several cell types. c, Immunoblot detection of Pro-Pcsk1 and Pcsk1 protein levels (Cell Signaling #18030) in Ins1E cells infected with a control adenovirus or hCerS6-expressing adenovirus for 48 h (representative immunoblot). d-g, Quantification of Tmed2 (d), Pcsk1 (e), Pro-Pcsk1 signals (f) and Pcsk1/ Pro-Pcsk1 ratio (g) from 4 independent experiments. Statistical analysis was performed using two-way ANOVA with Sidak’s multiple comparisons test (b, d-g). Data points in (b, d-g) represent independent experiments. Bar graphs in (b, d-g) represent means + s.e.m. Stain-Free signal was used for normalization of all immunoblots. Source numerical data and unprocessed blots are available in source data. Source data
Extended Data Fig. 6
Extended Data Fig. 6. pacSph incorporation into sphingolipids during PACS interactomics.
a-c, Thin layer chromatography (TLC) analyses of pacSph incorporation in Sgpl1ΔIns1E and CerS2:Sgpl1ΔIns1E cells. a, Exemplary TLC image. b, Quantification of pacSphingosine (pacSph), pacSph-derived Ceramides (pacCer) and pacSph-derived sphingomyelins (pacSM) in SgplΔIns1E and CerS2:Sgpl1ΔIns1E cells treated with Fumonisin B1 (FB1) or vehicle, respectively, and 5 µM pacSph for 1 h (n = 6 independent experiments). c, Relative quantification of all pacSLs shown in (b). The sum of all pacSLs per sample was set to 100%. d-n, MS-based quantification of pacSph incorporation in Sgpl1ΔIns1E and CerS2:Sgpl1ΔIns1E cells. d, e, Absolute (d) and relative (e) quantification of endogenous (white dots) and pacSph-derived ceramides (black dots) in cells treated with 5 µM pacSph for 1 h (n = 4 independent experiments). f, g, Absolute (f) and relative (g) quantification of endogenous sphingosine (Sph) and pacSph as described for (d) and (e). h, i, Absolute (h) and relative (i) quantification of endogenous and pacSph-derived sphingomyelins as described for (d) and (e). j, k, Absolute (j) and relative (k) quantification of endogenous and pacSph-derived hexosylceramides as described for (d) and (e). l, Sum of all measured endogenous sphingoid bases (SB = sphingosine and sphinganine), ceramides (Cer), sphingomyelins (SM) and hexosylceramides (HexCer). m, Sum of all measured pacSph-derived ceramides, sphingomyelins, hexosylceramides (pacHexCer) and pacSph in cells described in (l). n, Relative amounts of pacSph-derived SLs in pacSph-treated cells described in (l) and (m). The sum of all pacSLs per sample was set to 100%. Statistical analysis in (d-k) was performed separately for endogenous SLs and pacSph SLs using two-sided multiple t-tests with Holm-Sidak correction. For VLSLs, no statistical test was performed due to ablation of CerS2. Data points represent independent experiments. Bar graphs represent means + s.e.m. Pac-, photoactivatable and clickable-; MS, mass spectrometry. Source numerical data and unprocessed blots are available in source data. Source data
Extended Data Fig. 7
Extended Data Fig. 7. SBP confirmation and Tmed2 abundance.
a, Top 20 SBPs identified in Fig. 5b according to p-values and a log2 fold change > 3. b, Verification of Bst2 and Fxyd6 as SBPs by overexpression of DDK-tagged variants in Sgpl1ΔIns1E cells followed by pacSph-pulldown; representative immunoblots (left) and quantification (right). Eluate band intensities were normalized to input bands and +UV samples were set to 1 (n = 4 independent experiments). c, Verification of Tmed1 as SBP as described in (b); representative immunoblot (left) and quantification (right). n = 3 independent experiments. d, Immunoblot detection of Tmed2 protein levels in Sgpl1ΔIns1E and Cers2:Sgpl1ΔIns1E cells. Representative immunoblot showing 3 replicates per genotype (left) and quantification (right). n = 3 independent experiments with 3 replicates per genotype, respectively. e, Immunoblot detection of Tmed2 protein levels in islets of 6 control and 6 Cers2ΔBKO mice. Representative immunoblot (left) and quantification (right). f, Immunoblot detection of Tmed2 protein levels in islets of 6 control and 6 ob/ob.B6 mice at week 12. Representative immunoblot (left) and quantification (right). g, Immunoblot detection of Tmed2 protein levels in islets of 6 control and 6 db/db.BKS mice at week 12. Representative immunoblot (left) and quantification (right). Statistical analysis was performed using a one sample t-test against 1 (b, c) or Student’s t-test (d-g). P-values are stated in each figure. Bar graphs represent means + s.e.m. Data points in (b, c and d) represent individual experiments. Data points in (e-g) represent islets from individual mice. Stain-Free signal was used for normalization of all immunoblots, except for (b) and (c). Stain-Free images of (e), (f) and (g) were reproduced from Fig. 4f, Extended Data Fig. 4e, d, as the same PVDF membranes were used for detection of Pro-Pcsk1, Pcsk1 and Tmed2, respectively. Source numerical data and unprocessed blots are available in source data. Source data
Extended Data Fig. 8
Extended Data Fig. 8. Tmed2:SL interaction upon CerS1 deficiency.
a, Double cut CrispR/Cas9 knockout strategy for CerS1 in Ins1E cells. b, Relative mRNA expression of Sgpl1 and various CerS in wildtype Ins1E cells, Sgpl1ΔIns1E and CerS1:Sgpl1ΔIns1E cells. n = 3 independent experiments. Wildtype Ins1E cDNA was also used for qPCR in Supplementary Fig. 3c. c, Quantification of ceramides of various acyl chain lengths in Sgpl1ΔIns1E and CerS1:Sgpl1ΔIns1E cells by targeted lipidomics (n = 4 independent experiments). Lipid amounts were normalized to cell pellet weights. d, pacSph pull-down of endogenous Tmed2 in Sgpl1ΔIns1E and CerS1:Sgpl1ΔIns1E cells (n = 3 independent experiments); exemplary immunoblot (left) and quantification (right). Eluate intensities were normalized to respective input intensities. e, Experimental setup for knock-down of Tmed1, Tmed2 and both in murine pseudoislets. Statistical analysis was performed using one-way ANOVA with Tukey’s multiple comparisons test for each individual mRNA target in (b), multiple two-sided t-tests with Holm-Sidak correction in (c) and repeated measures one-way ANOVA with Tukey’s multiple comparisons test in (d). Data points represent independent experiments. Bar graphs represent means + s.e.m. The Sgpl1ΔIns1E and CerS1:Sgpl1ΔIns1E cells are pools of 3 individual monoclonal cell lines, respectively. Source numerical data and unprocessed blots are available in source data. Source data
Extended Data Fig. 9
Extended Data Fig. 9. Reduced insulin levels in Tmed2-deficient Ins1E cells.
a, Double cut CrispR/Cas9 knockout strategy for Tmed2 in Ins1E cells. b, c, Relative mRNA expression of various Tmed family members (b) and beta cell identity markers (c) in wildtype Ins1E, control and Tmed2ΔIns1E cells. Wildtype Ins1E samples were set to 1 (dotted line). n = 3 independent experiments. Note that potentially as a sign of attempted compensation, Pcsk1 mRNA levels are increased in Tmed2-deficient Ins1E cells. d, Representative immunoblot analysis of Tmed2 protein expression in 3 control vs. 3 Tmed2ΔIns1E replicate lysates. e, Insulin content in control and Tmed2ΔIns1E cells determined via ELISA. n = 3 independent experiments with 3 replicates per genotype, respectively. Statistical analysis was performed using multiple two-sided t-tests with Holm-Sidak correction (b and c) and a two-sided Student’s t-test (e). Data points represent independent experiments. Bar graphs represent means + s.e.m. The control and Tmed2ΔIns1E cells are pools of individual monoclonal cell lines, respectively (8 monoclonal control cell lines and 3 monoclonal Tmed2ΔIns1E cell lines were used for pooling). Source numerical data and unprocessed blots are available in source data. Source data
Extended Data Fig. 10
Extended Data Fig. 10. Interaction and localization of overexpressed Tmed2 and Pcsk1 in Ins1E cells.
a, Co-immunoprecipitation (Co-IP) of co-overexpressed Tmed2-V5 and Pro-Pcsk1/Pcsk1-DDK in Ins1E cells. Representative immunoblot (left) and quantification of three replicate experiments (right). As Ctrl-plasmid, the promotorless pNL1.3 from Promega (N1021) was used. b, Representative confocal images for co-localization of overexpressed Tmed2-V5 and Pro-/Pcsk1-DDK in Ins1E cells. Green, SytoxGreen as nucleus marker; red, Pro-/Pcsk1-DDK; blue, Tmed2-V5. Scale bar, 5 µm. c, d, Quantification of overlap of Pro-/Pcsk1-DDK with Tmed2-V5 (c) and Tmed2-V5 with Pro-/Pcsk1-DDK (d) in control and CerS2ΔIns1E cells. n = 2 independent experiments; only one experiment shown. e-j, Overlap of ER-marker PDI and Golgi-Marker TGN46 with Tmed2-V5, Pro-/Pcsk1-DDK (allowing detection of both Pro-Pcsk1 as well as mature Pcsk1) and Pro-Pcsk1 (only allowing detection of the immature Pro-Pcsk1 protein) after overexpression in control and CerS2ΔIns1E cells. n = 3 independent experiments. Statistical analysis was performed using a paired two-sided Student’s t-test (a) and unpaired two-sided Students t-tests (c-j). Data points represent replicate experiments (a) and individually quantified cells (c-d) or well sites (e-j). Bar graphs represent means + s.e.m. Source numerical data and unprocessed blots are available in source data. Source data

References

    1. Vasiljevic J, Torkko JM, Knoch KP, Solimena M. The making of insulin in health and disease. Diabetologia. 2020;63:1981–1989. doi: 10.1007/s00125-020-05192-7. - DOI - PMC - PubMed
    1. Ashcroft FM, Rorsman P. Diabetes mellitus and the beta cell: the last ten years. Cell. 2012;148:1160–1171. doi: 10.1016/j.cell.2012.02.010. - DOI - PMC - PubMed
    1. Turpin-Nolan SM, Bruning JC. The role of ceramides in metabolic disorders: when size and localization matters. Nat. Rev. Endocrinol. 2020;16:224–233. doi: 10.1038/s41574-020-0320-5. - DOI - PubMed
    1. Chaurasia, B. & Summers, S. A. Ceramides—lipotoxic inducers of metabolic disorders. Trends Endocrinol. Metab.26, 538–550 (2015). - PubMed
    1. Turpin SM, et al. Obesity-induced CerS6-dependent C16:0 ceramide production promotes weight gain and glucose intolerance. Cell Metab. 2014;20:678–686. doi: 10.1016/j.cmet.2014.08.002. - DOI - PubMed

MeSH terms