. 2023 Jan;613(7942):187-194.
doi: 10.1038/s41586-022-05545-9. Epub 2022 Dec 21.

R-loop-derived cytoplasmic RNA-DNA hybrids activate an immune response

Affiliations

R-loop-derived cytoplasmic RNA-DNA hybrids activate an immune response

Magdalena P Crossley et al. Nature. 2023 Jan.

Erratum in

Abstract

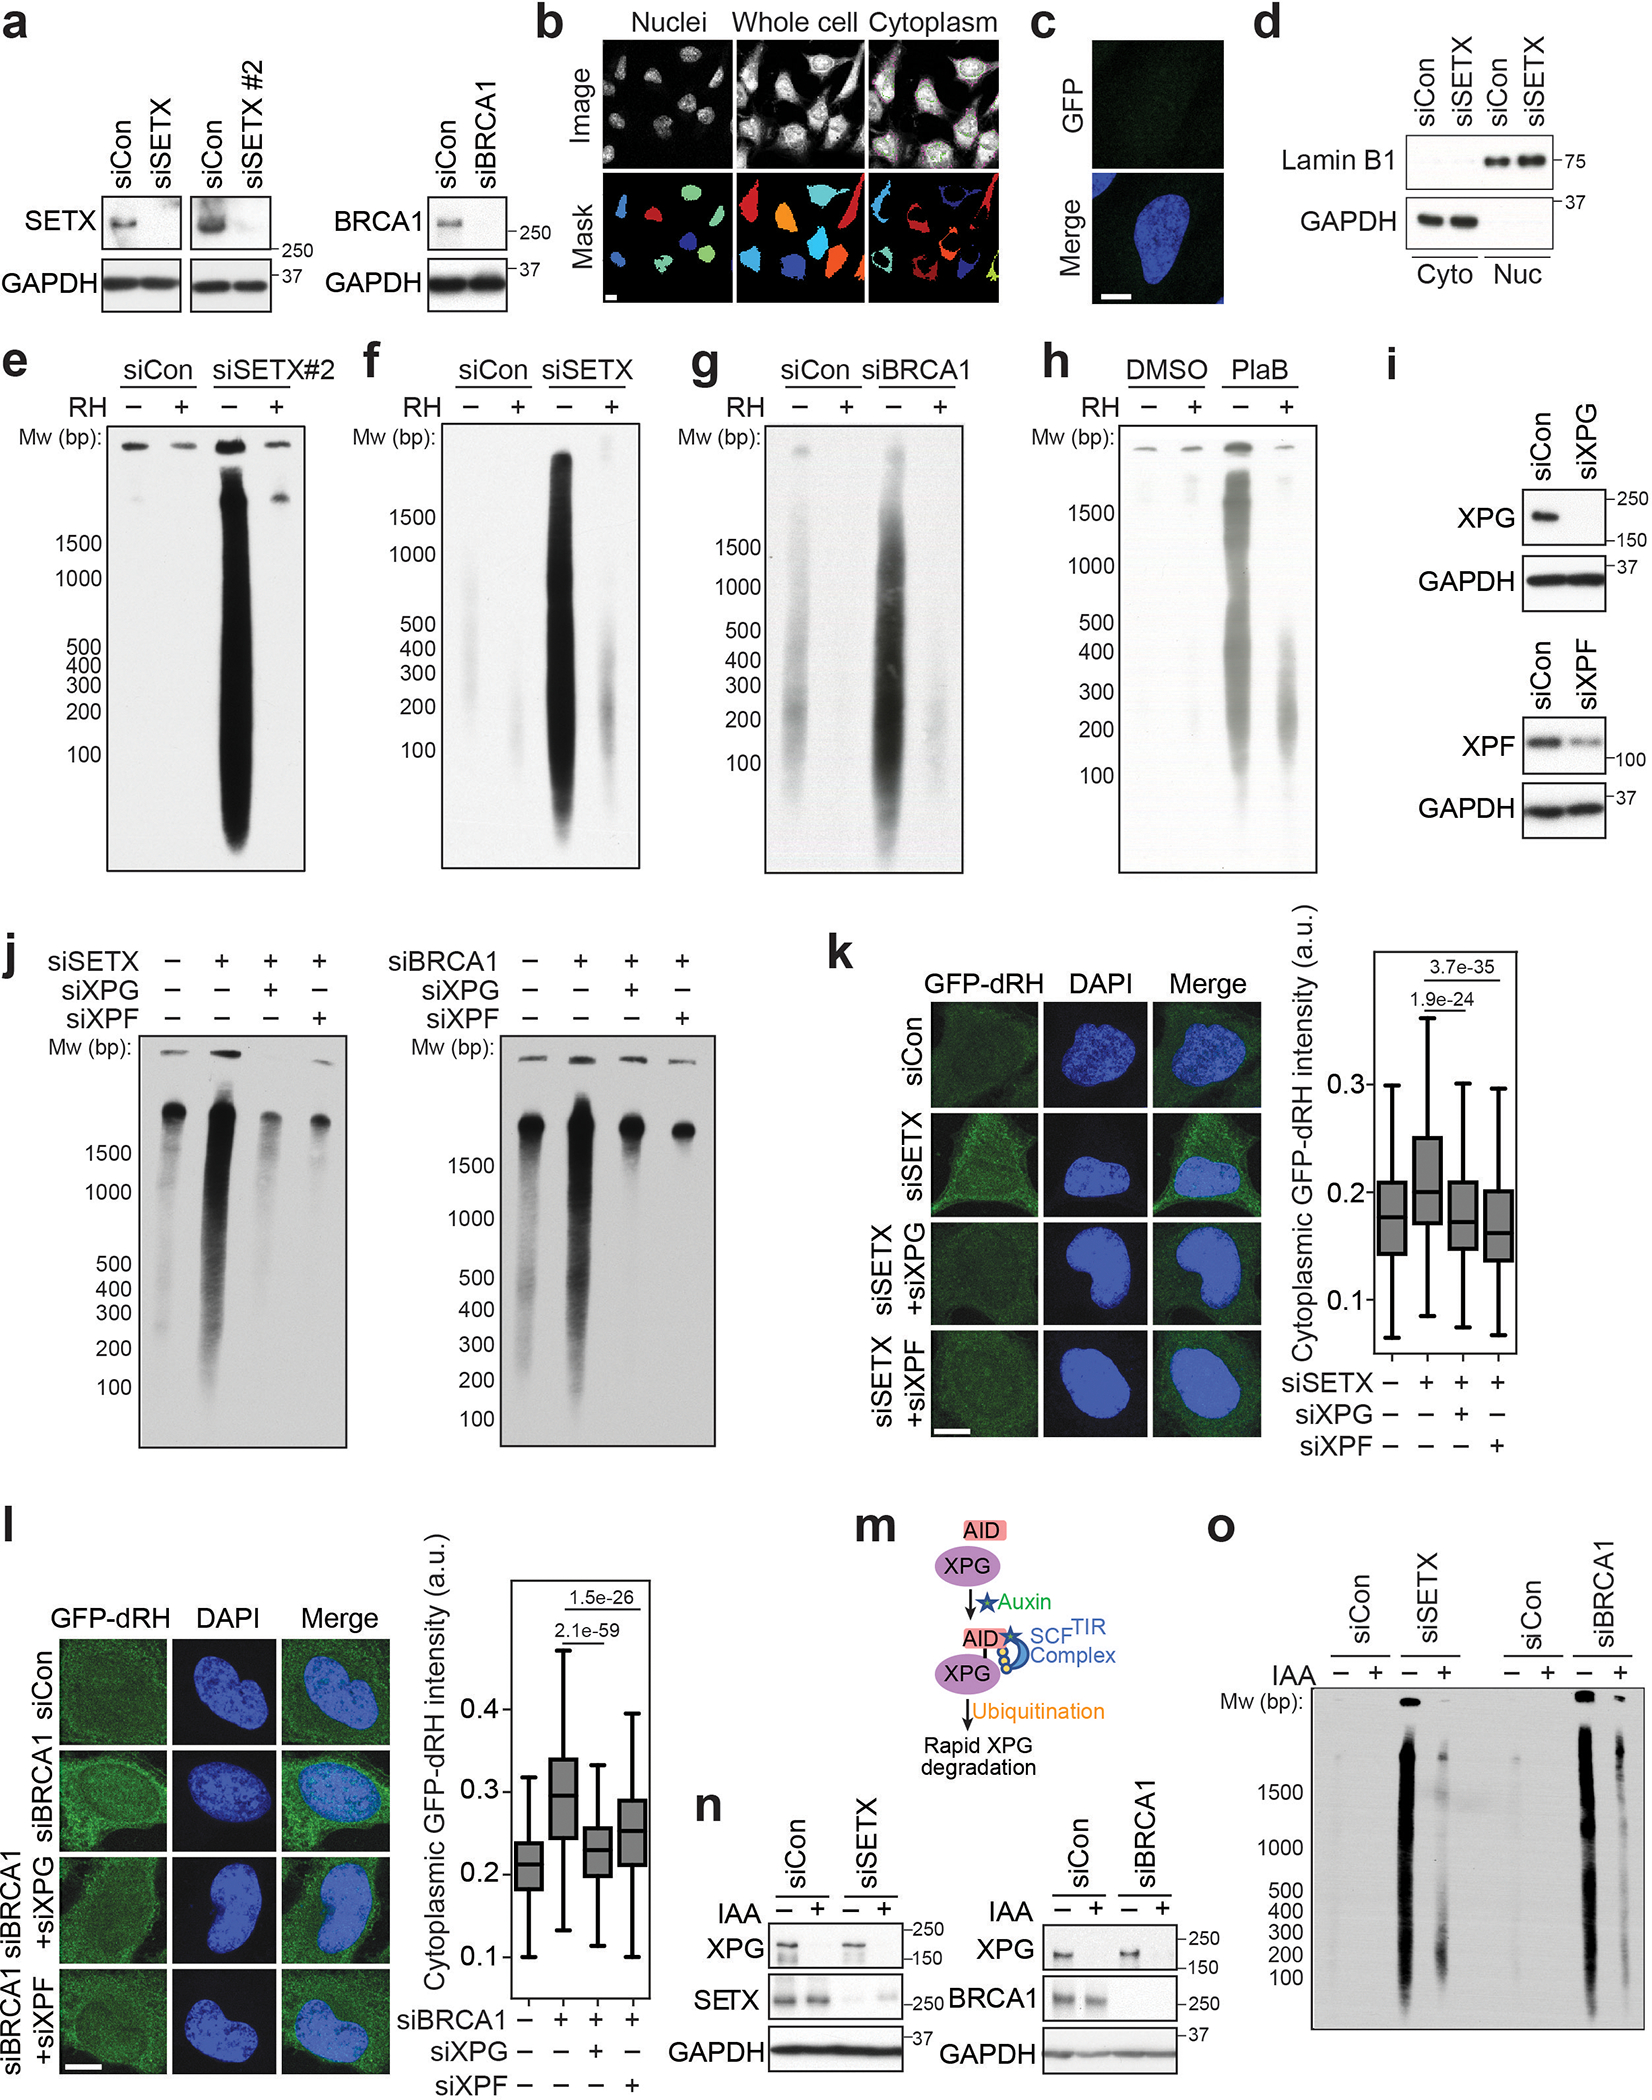
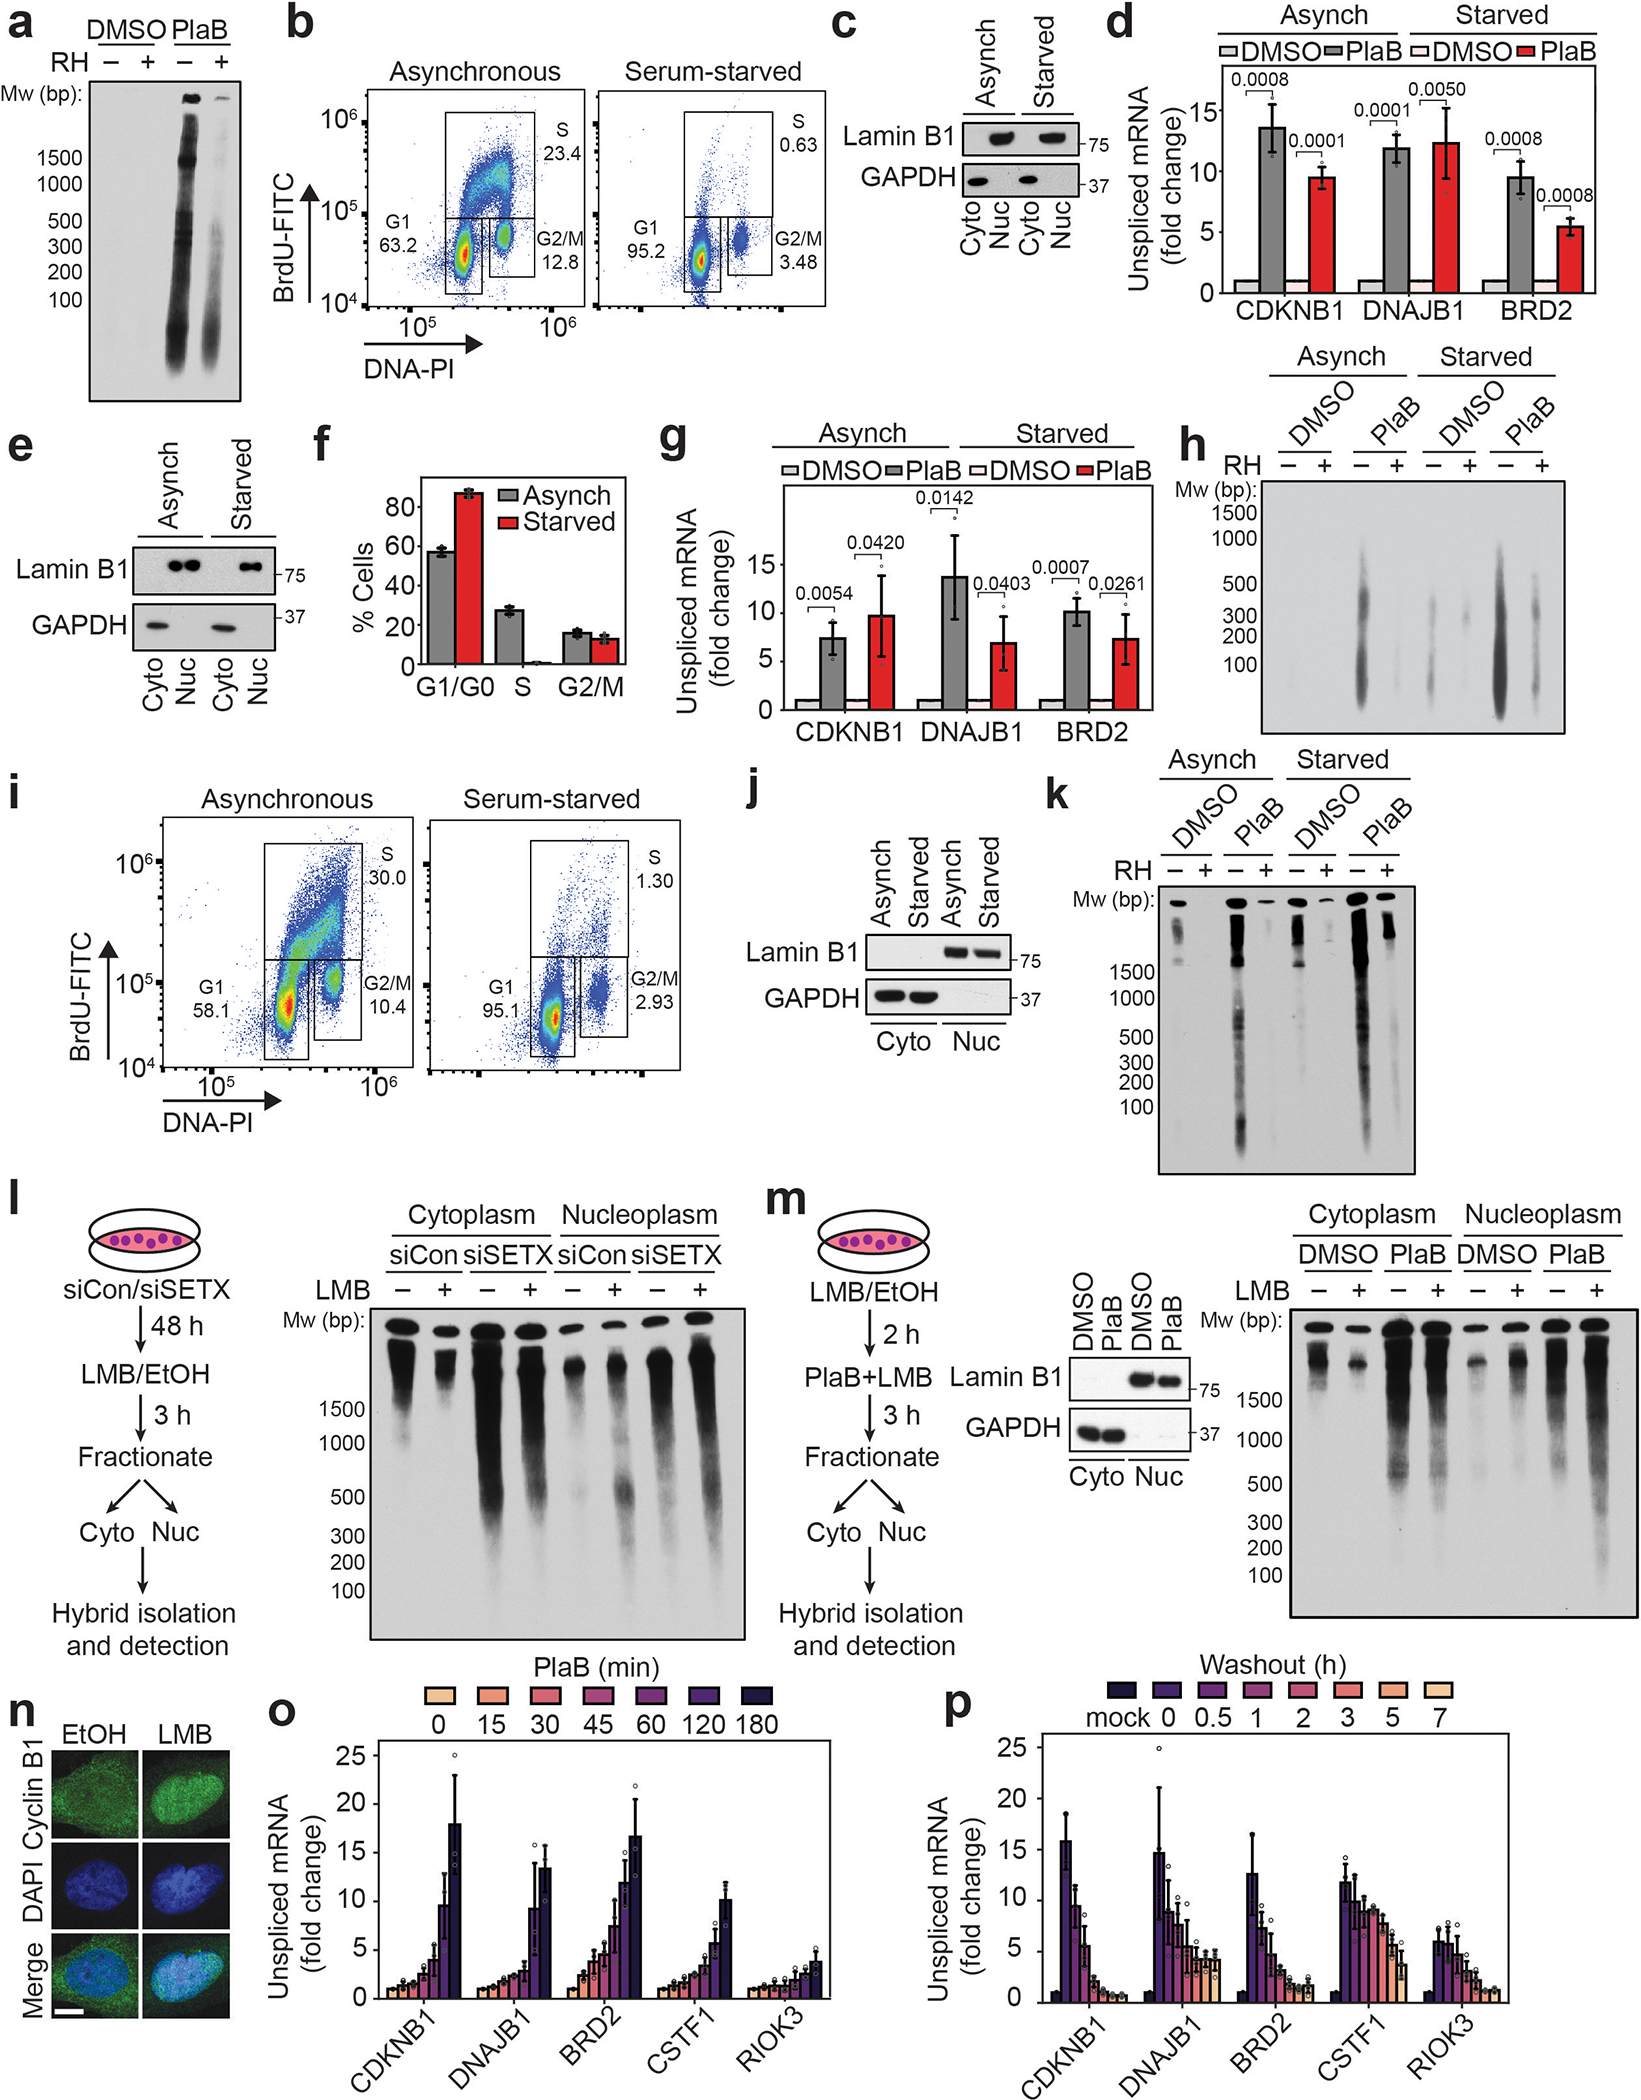
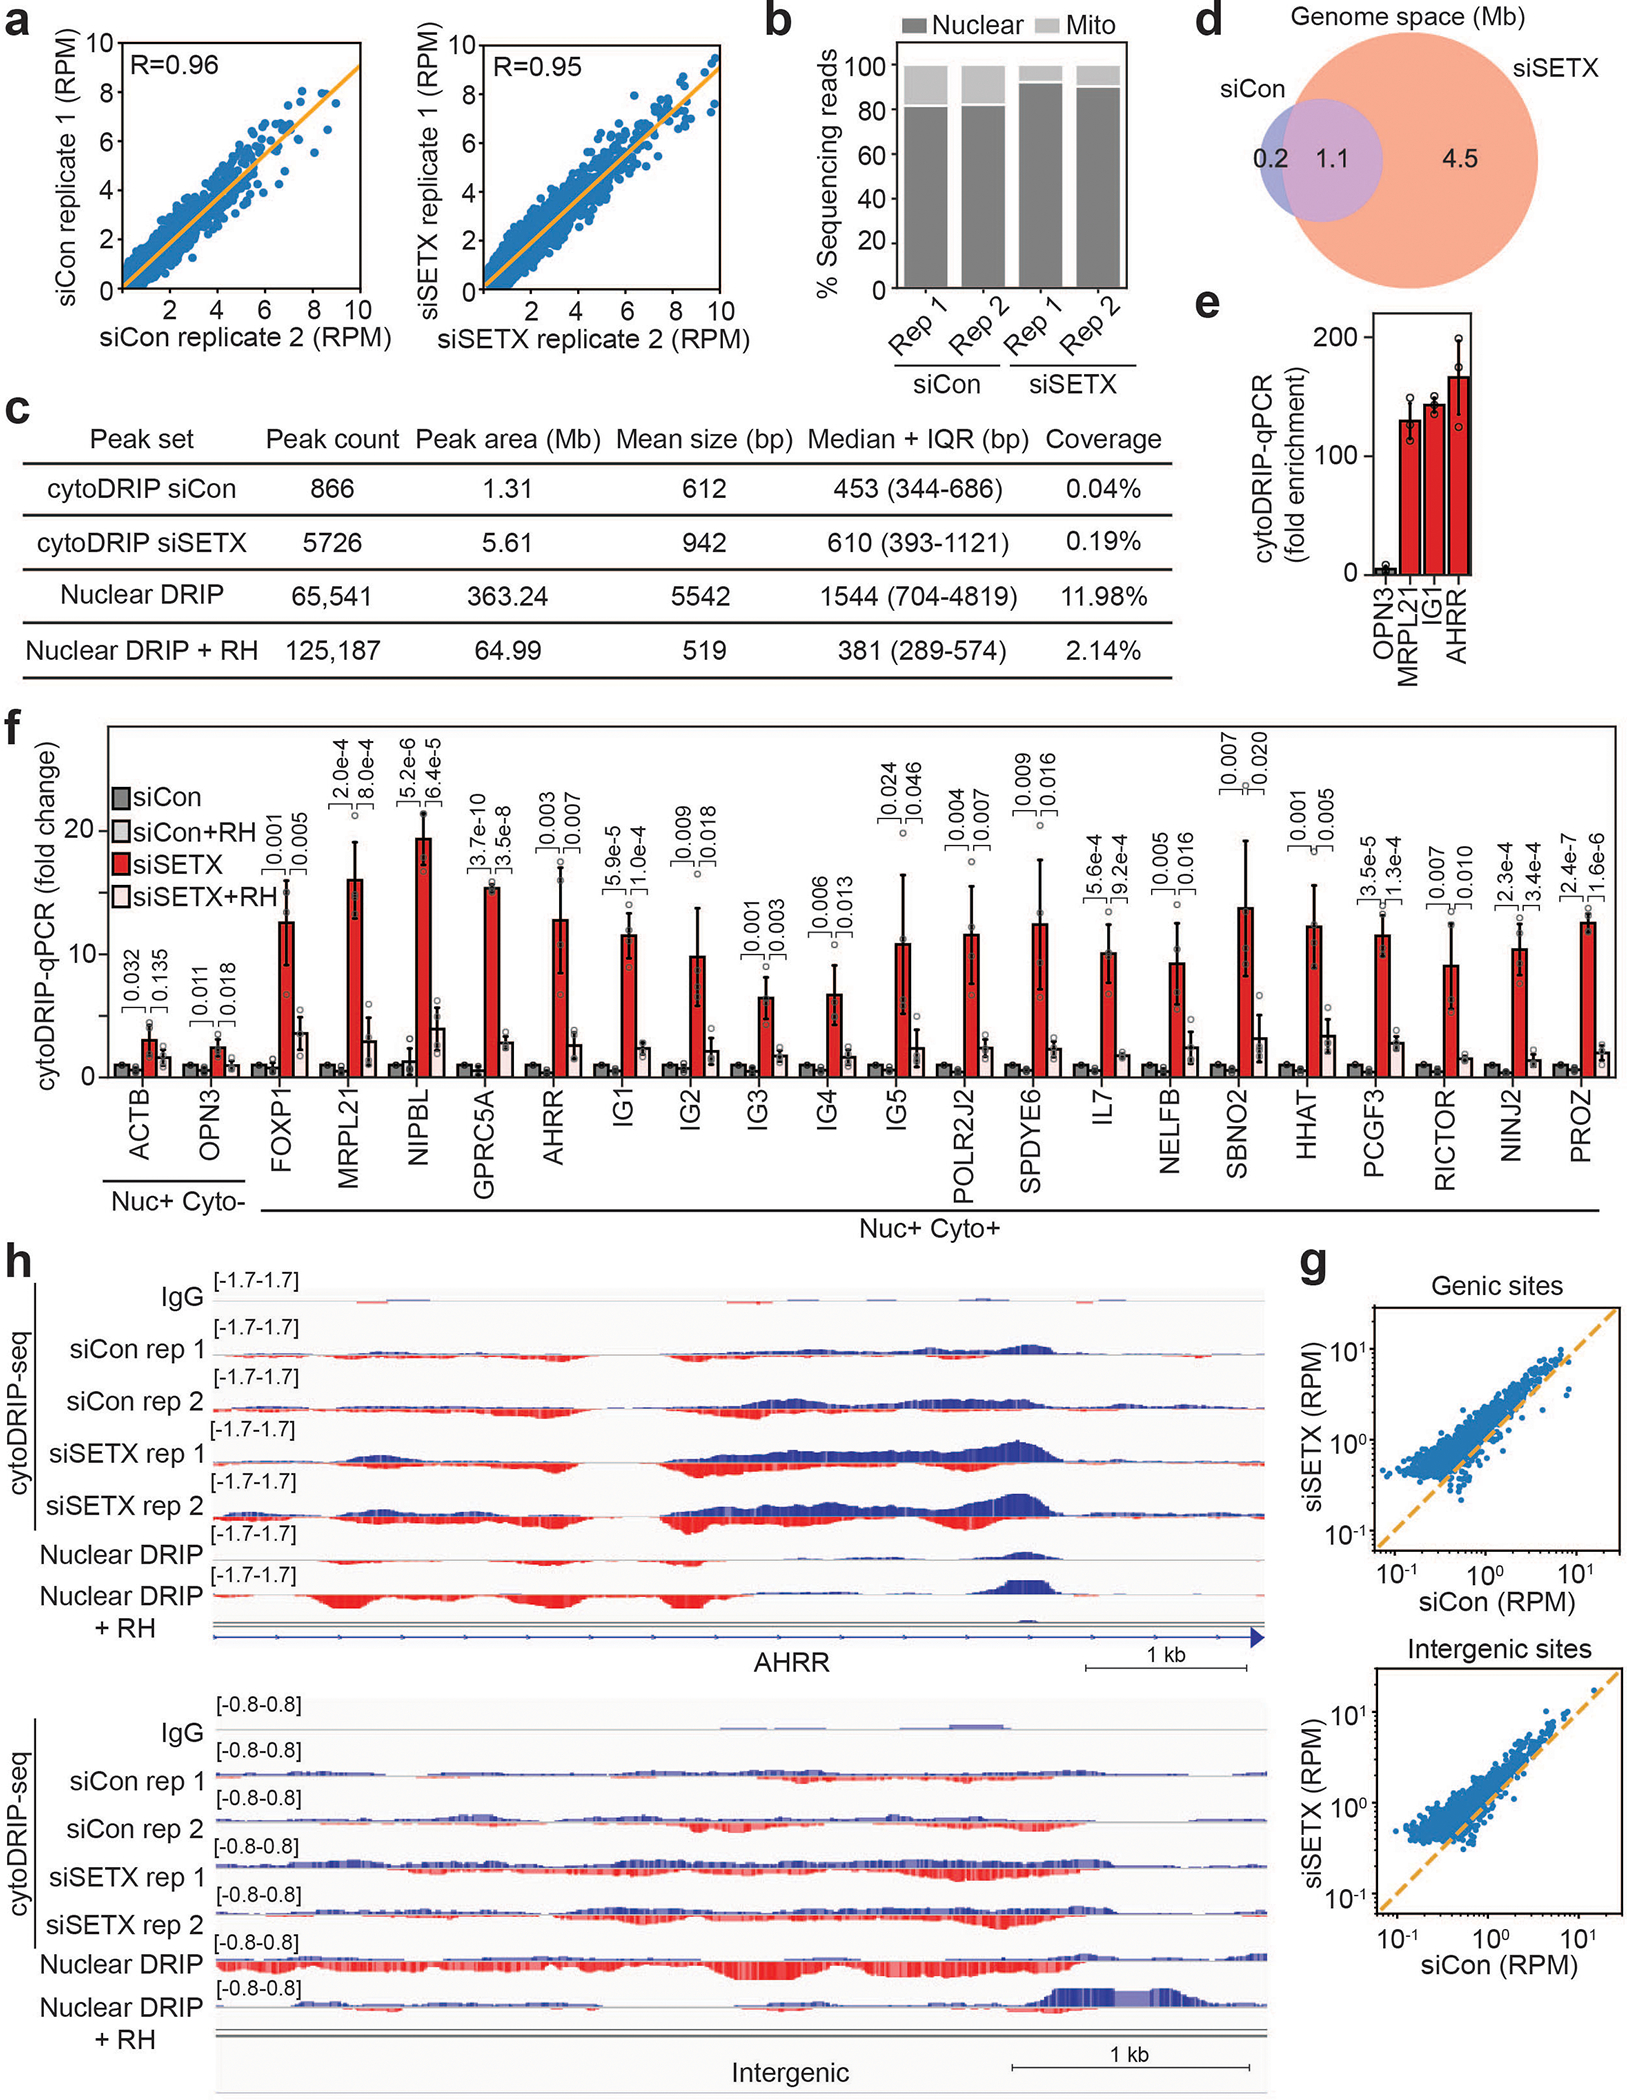
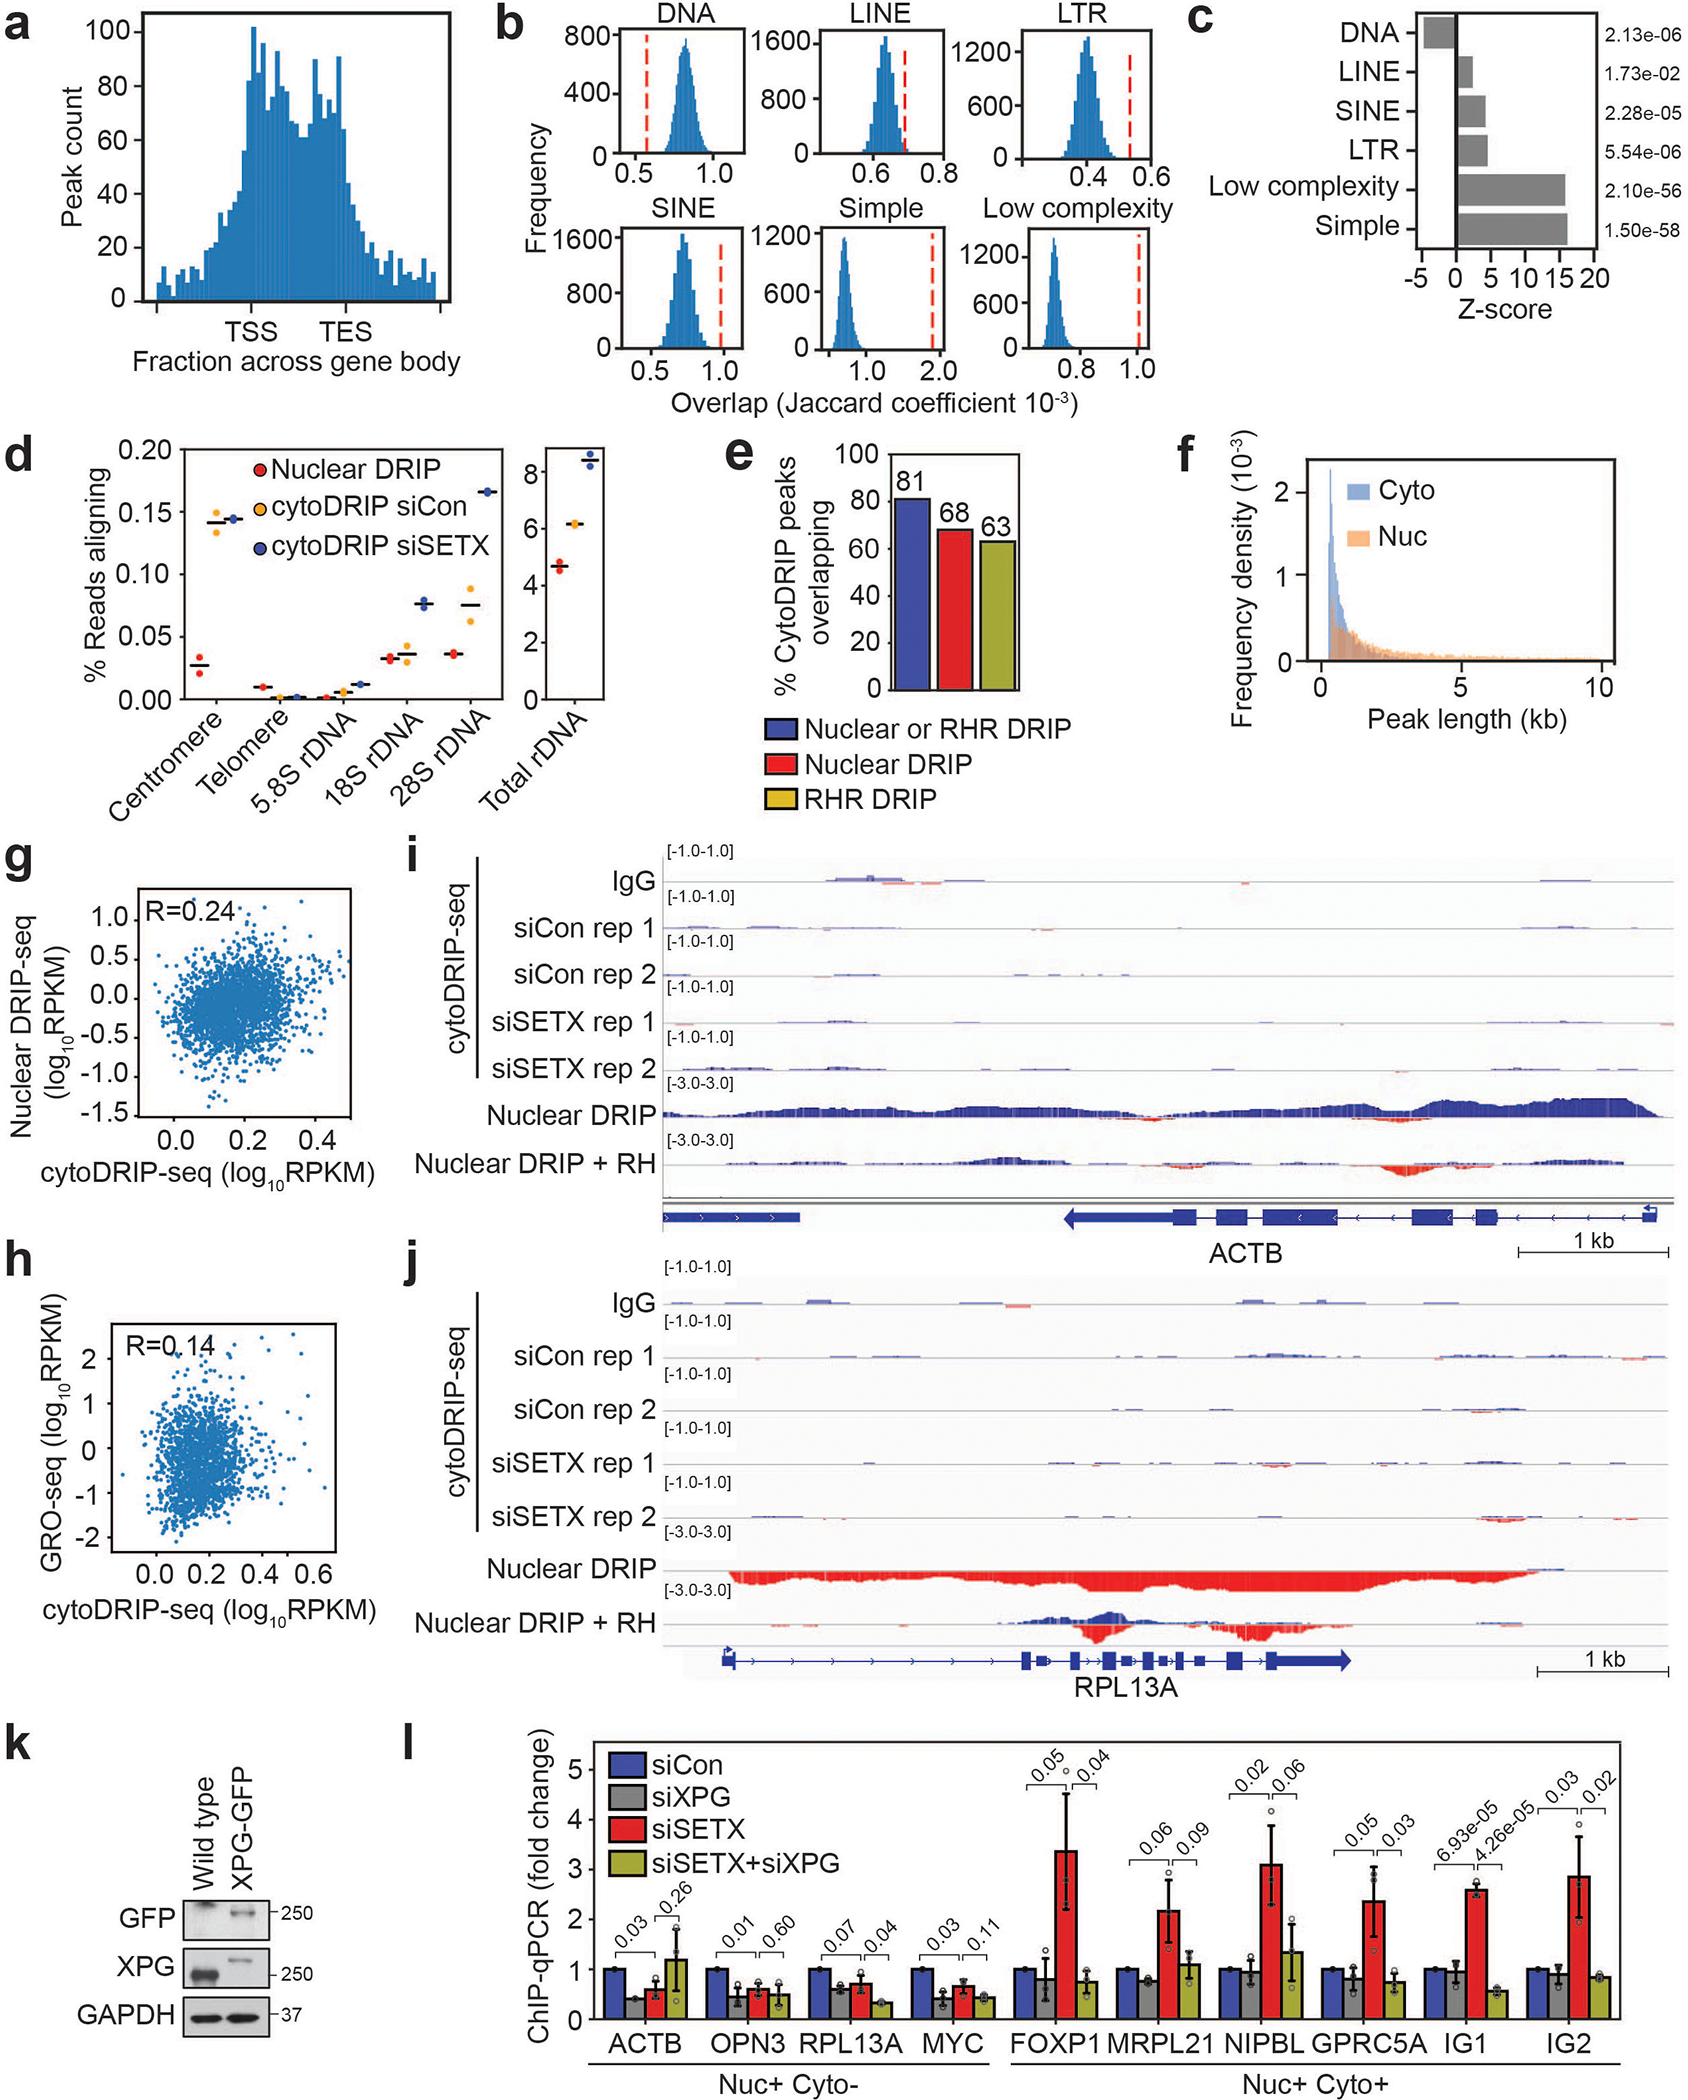
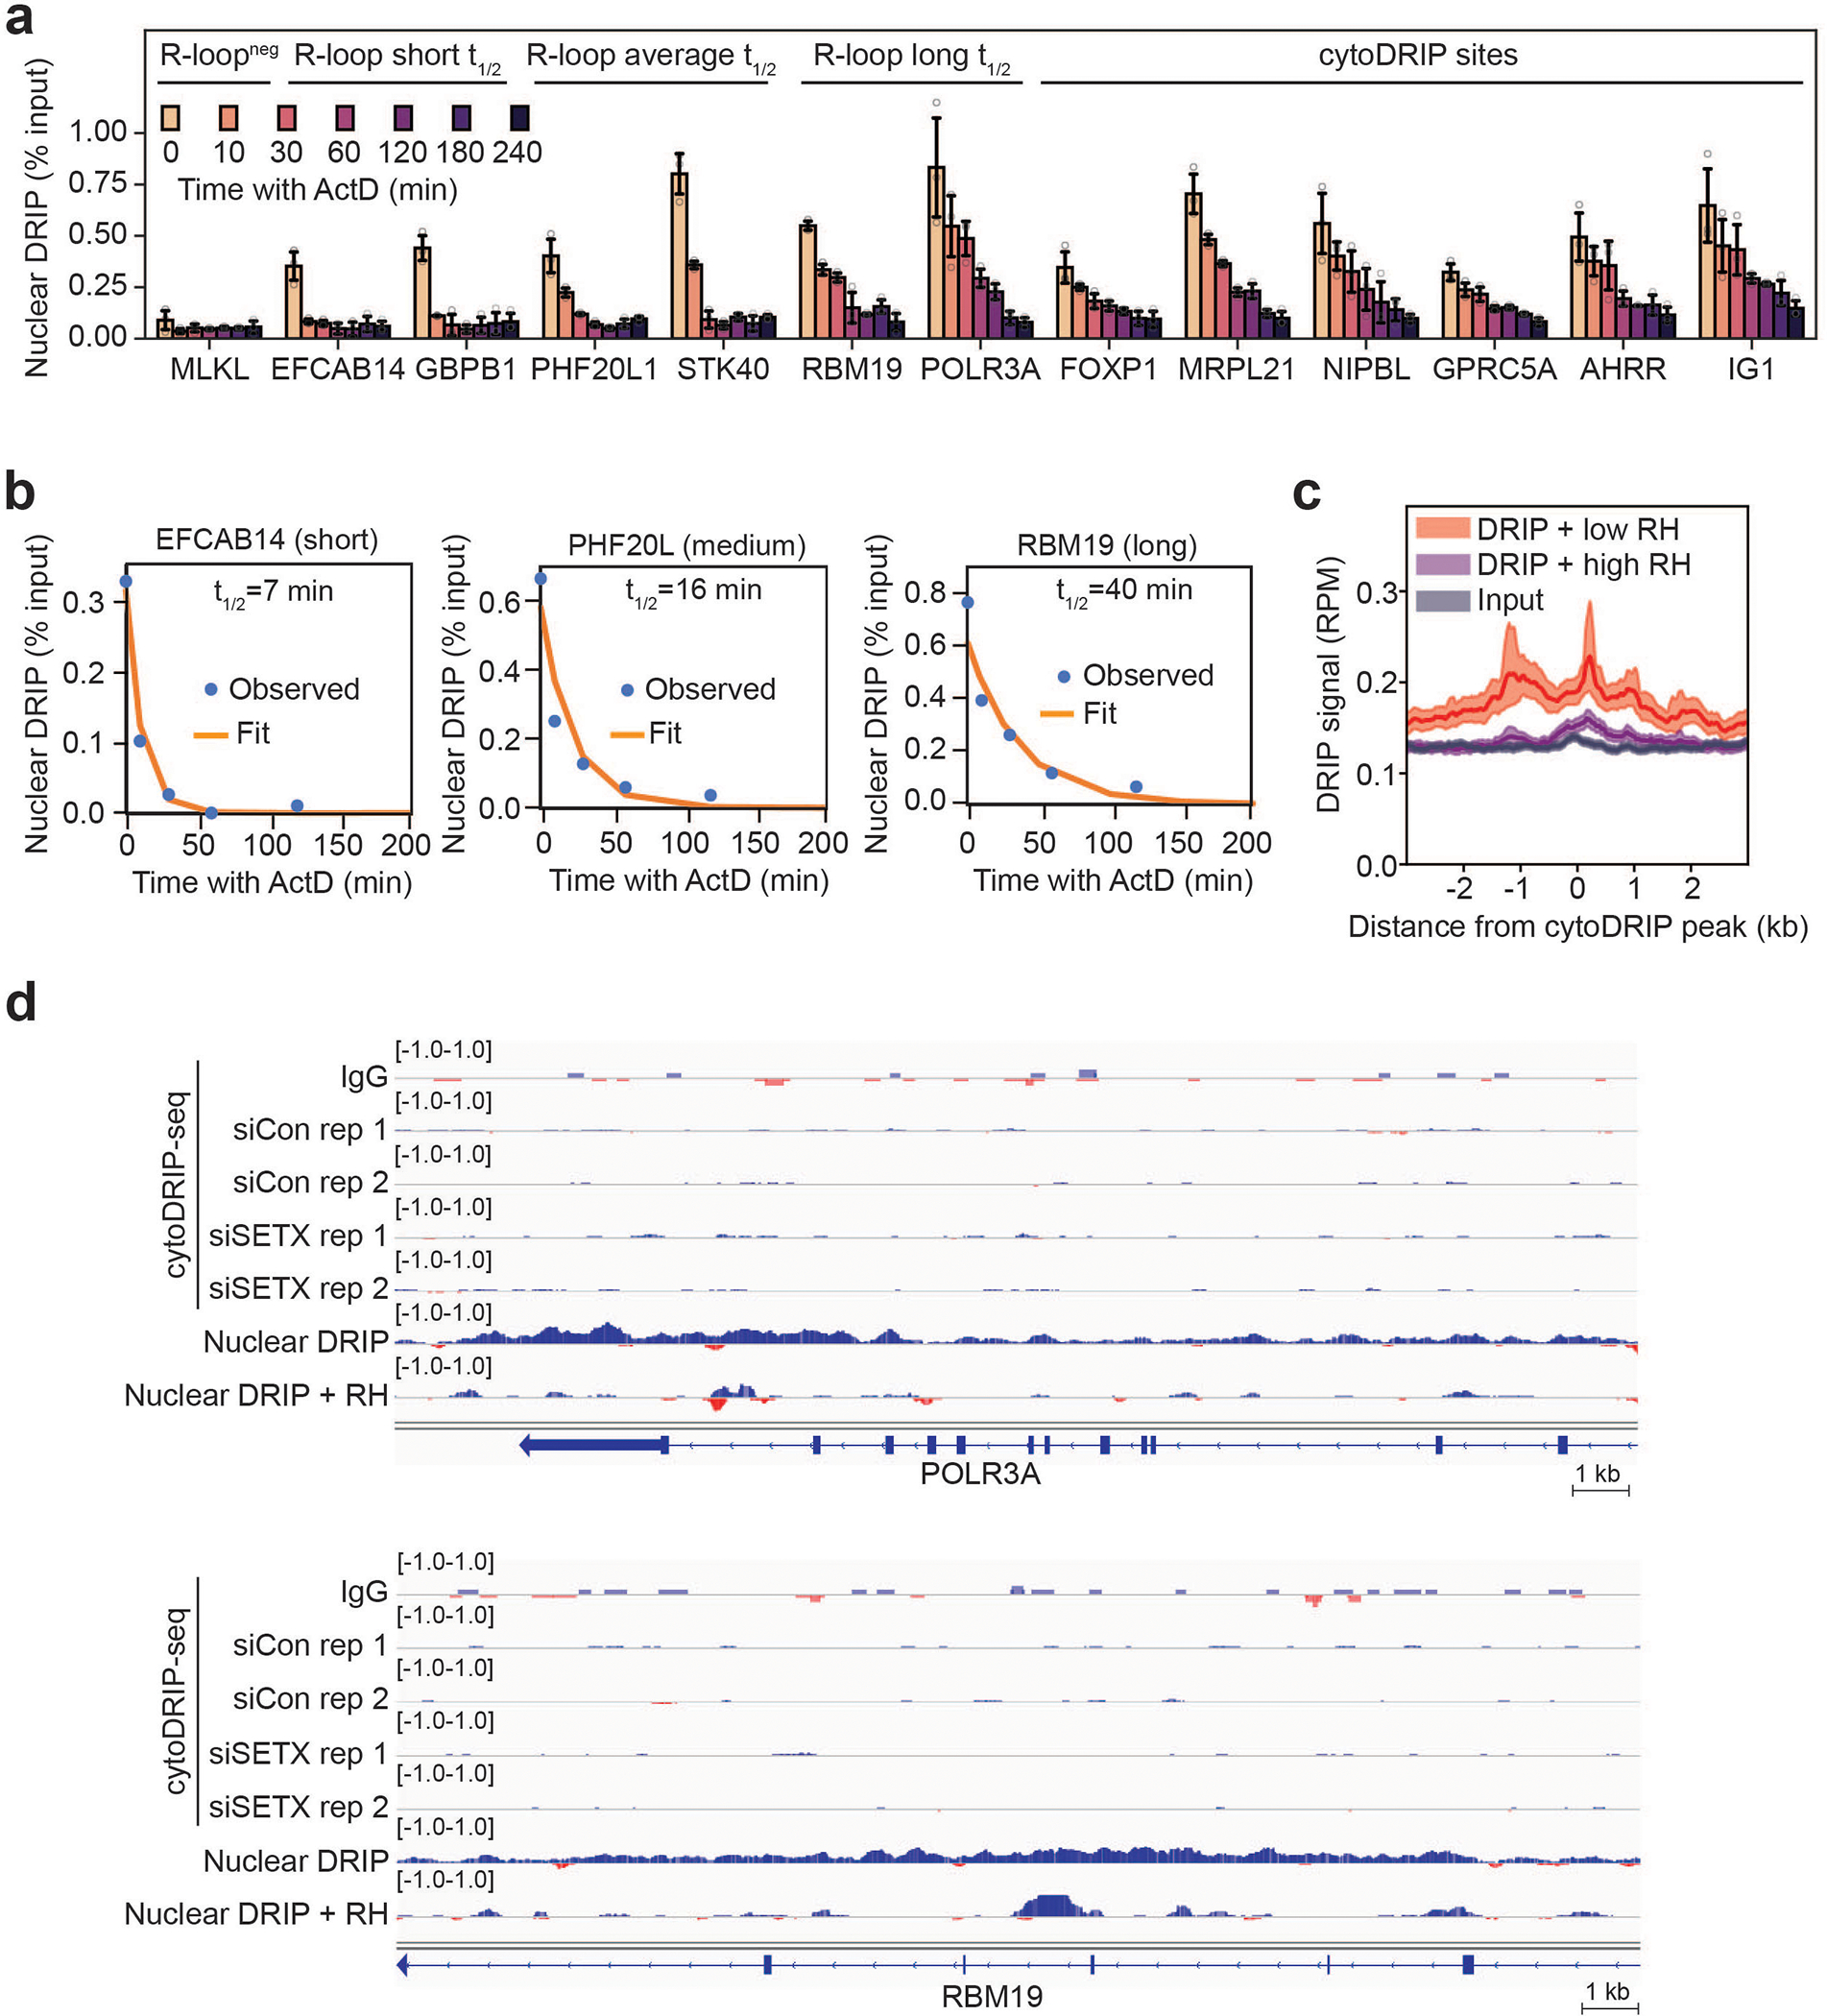
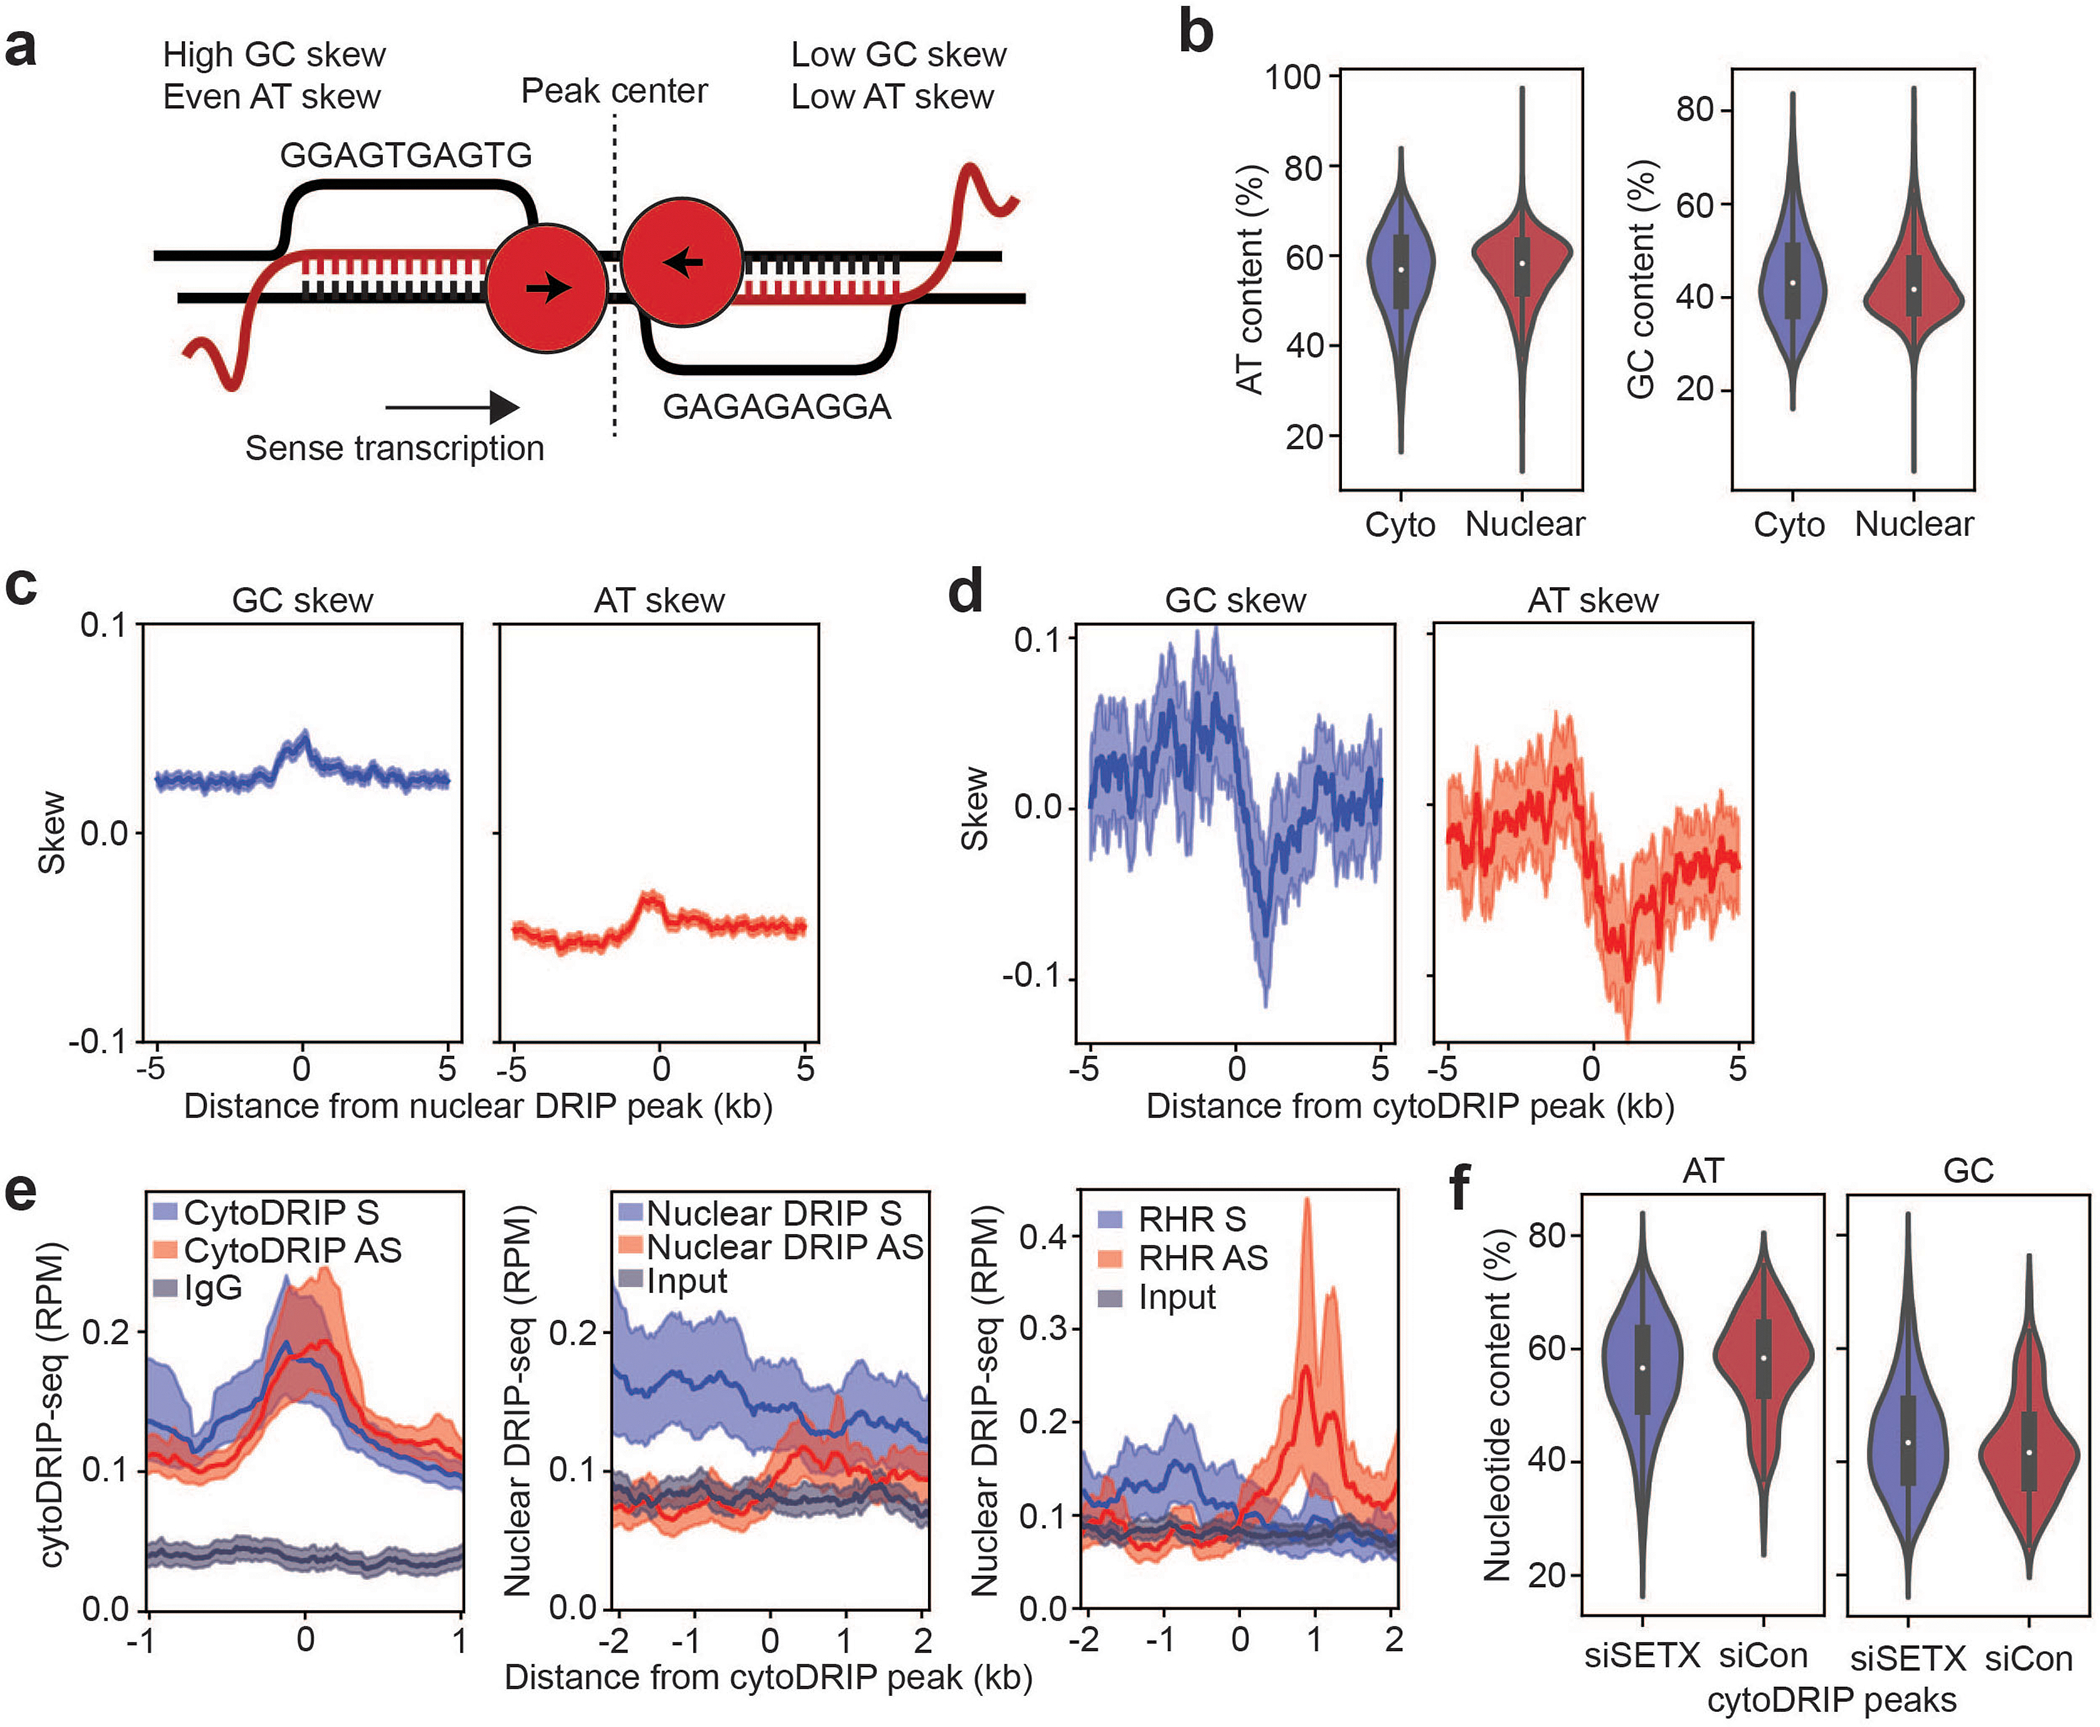
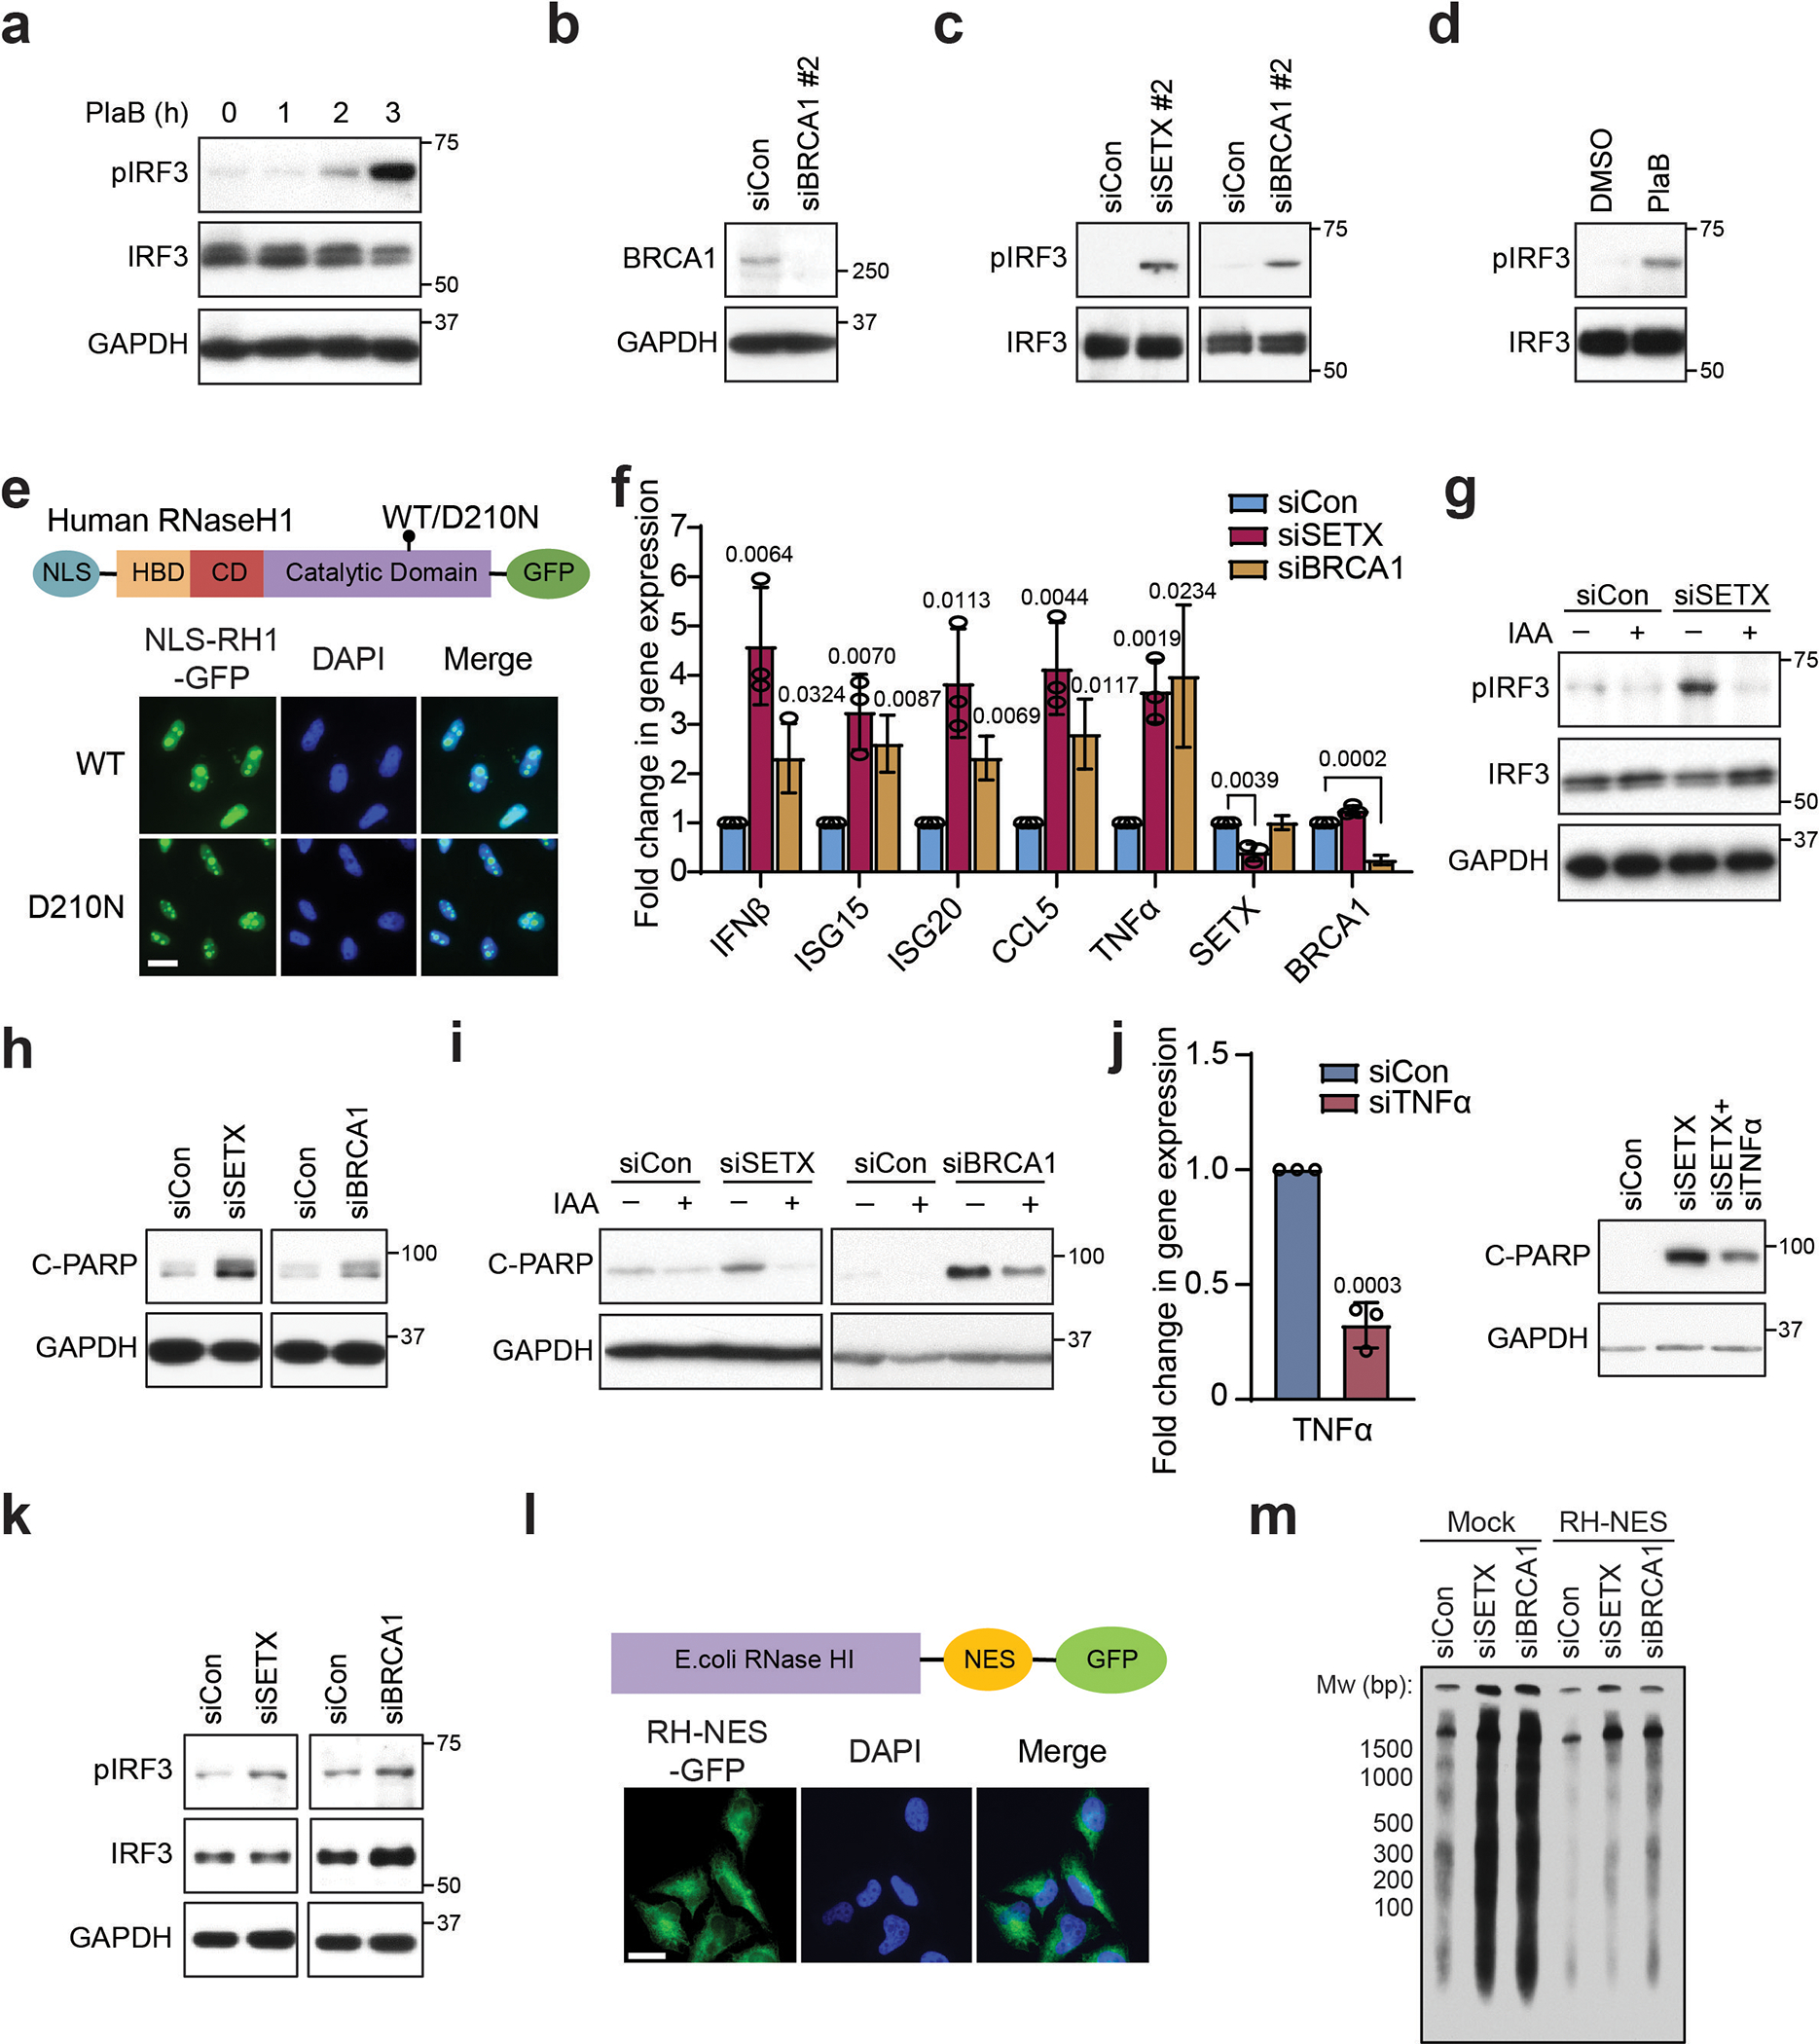
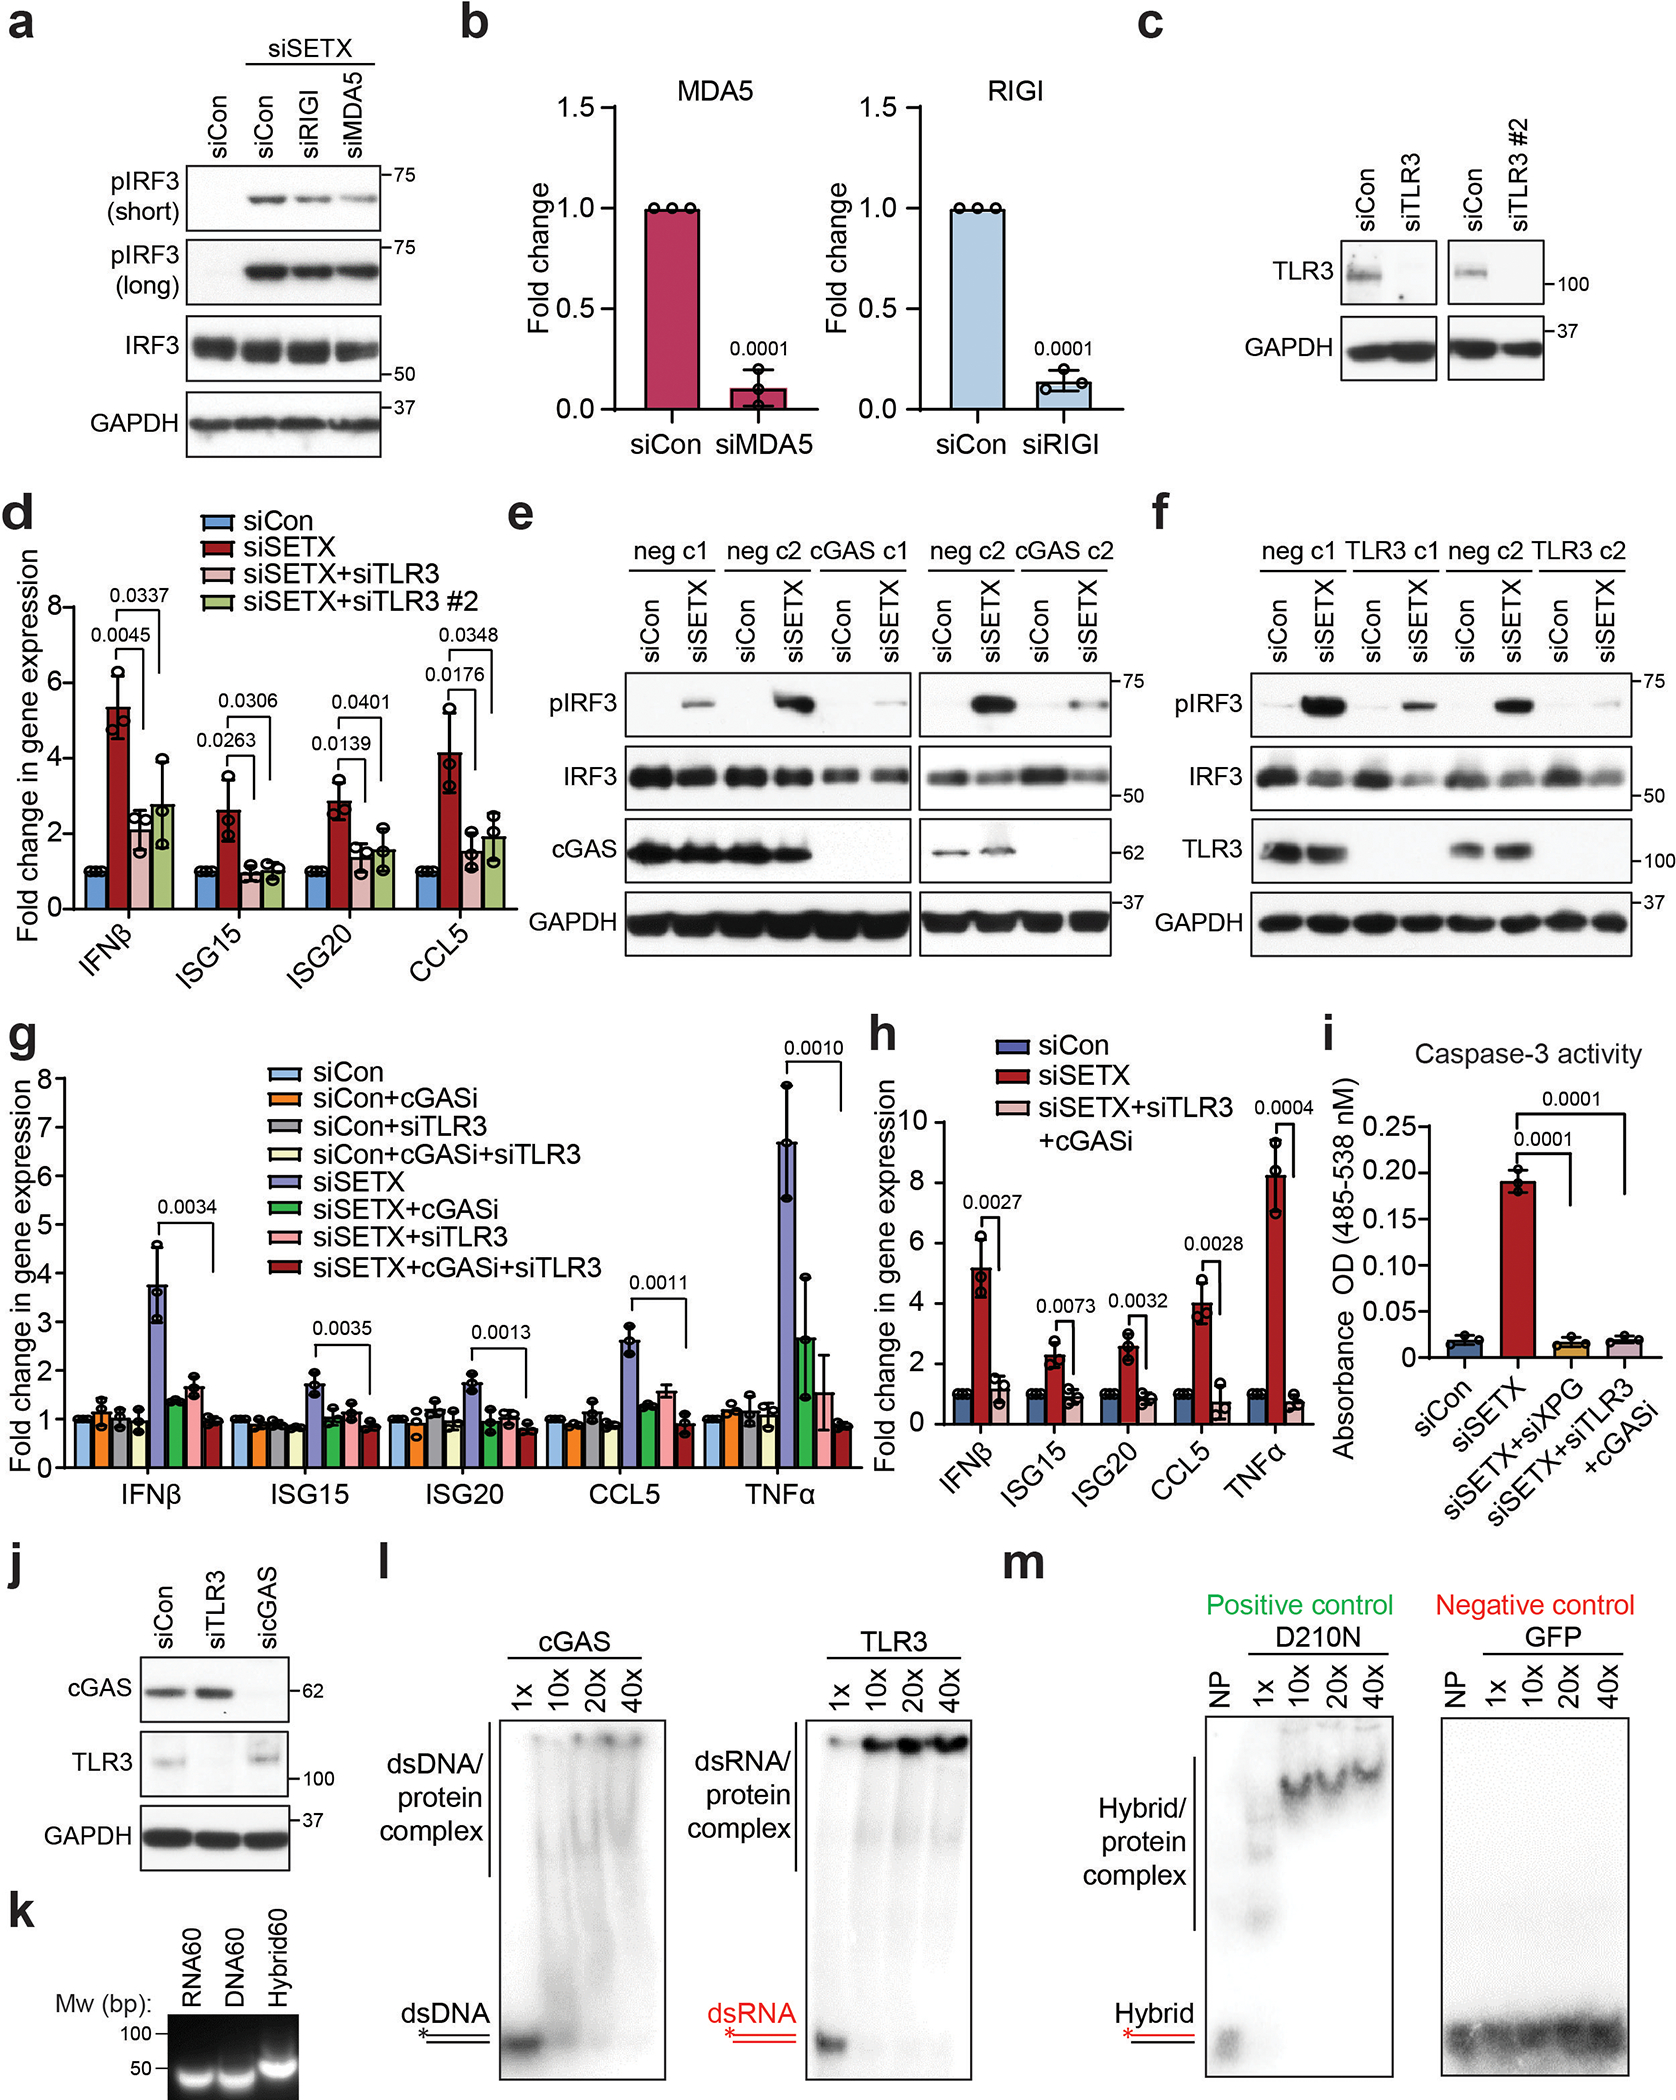
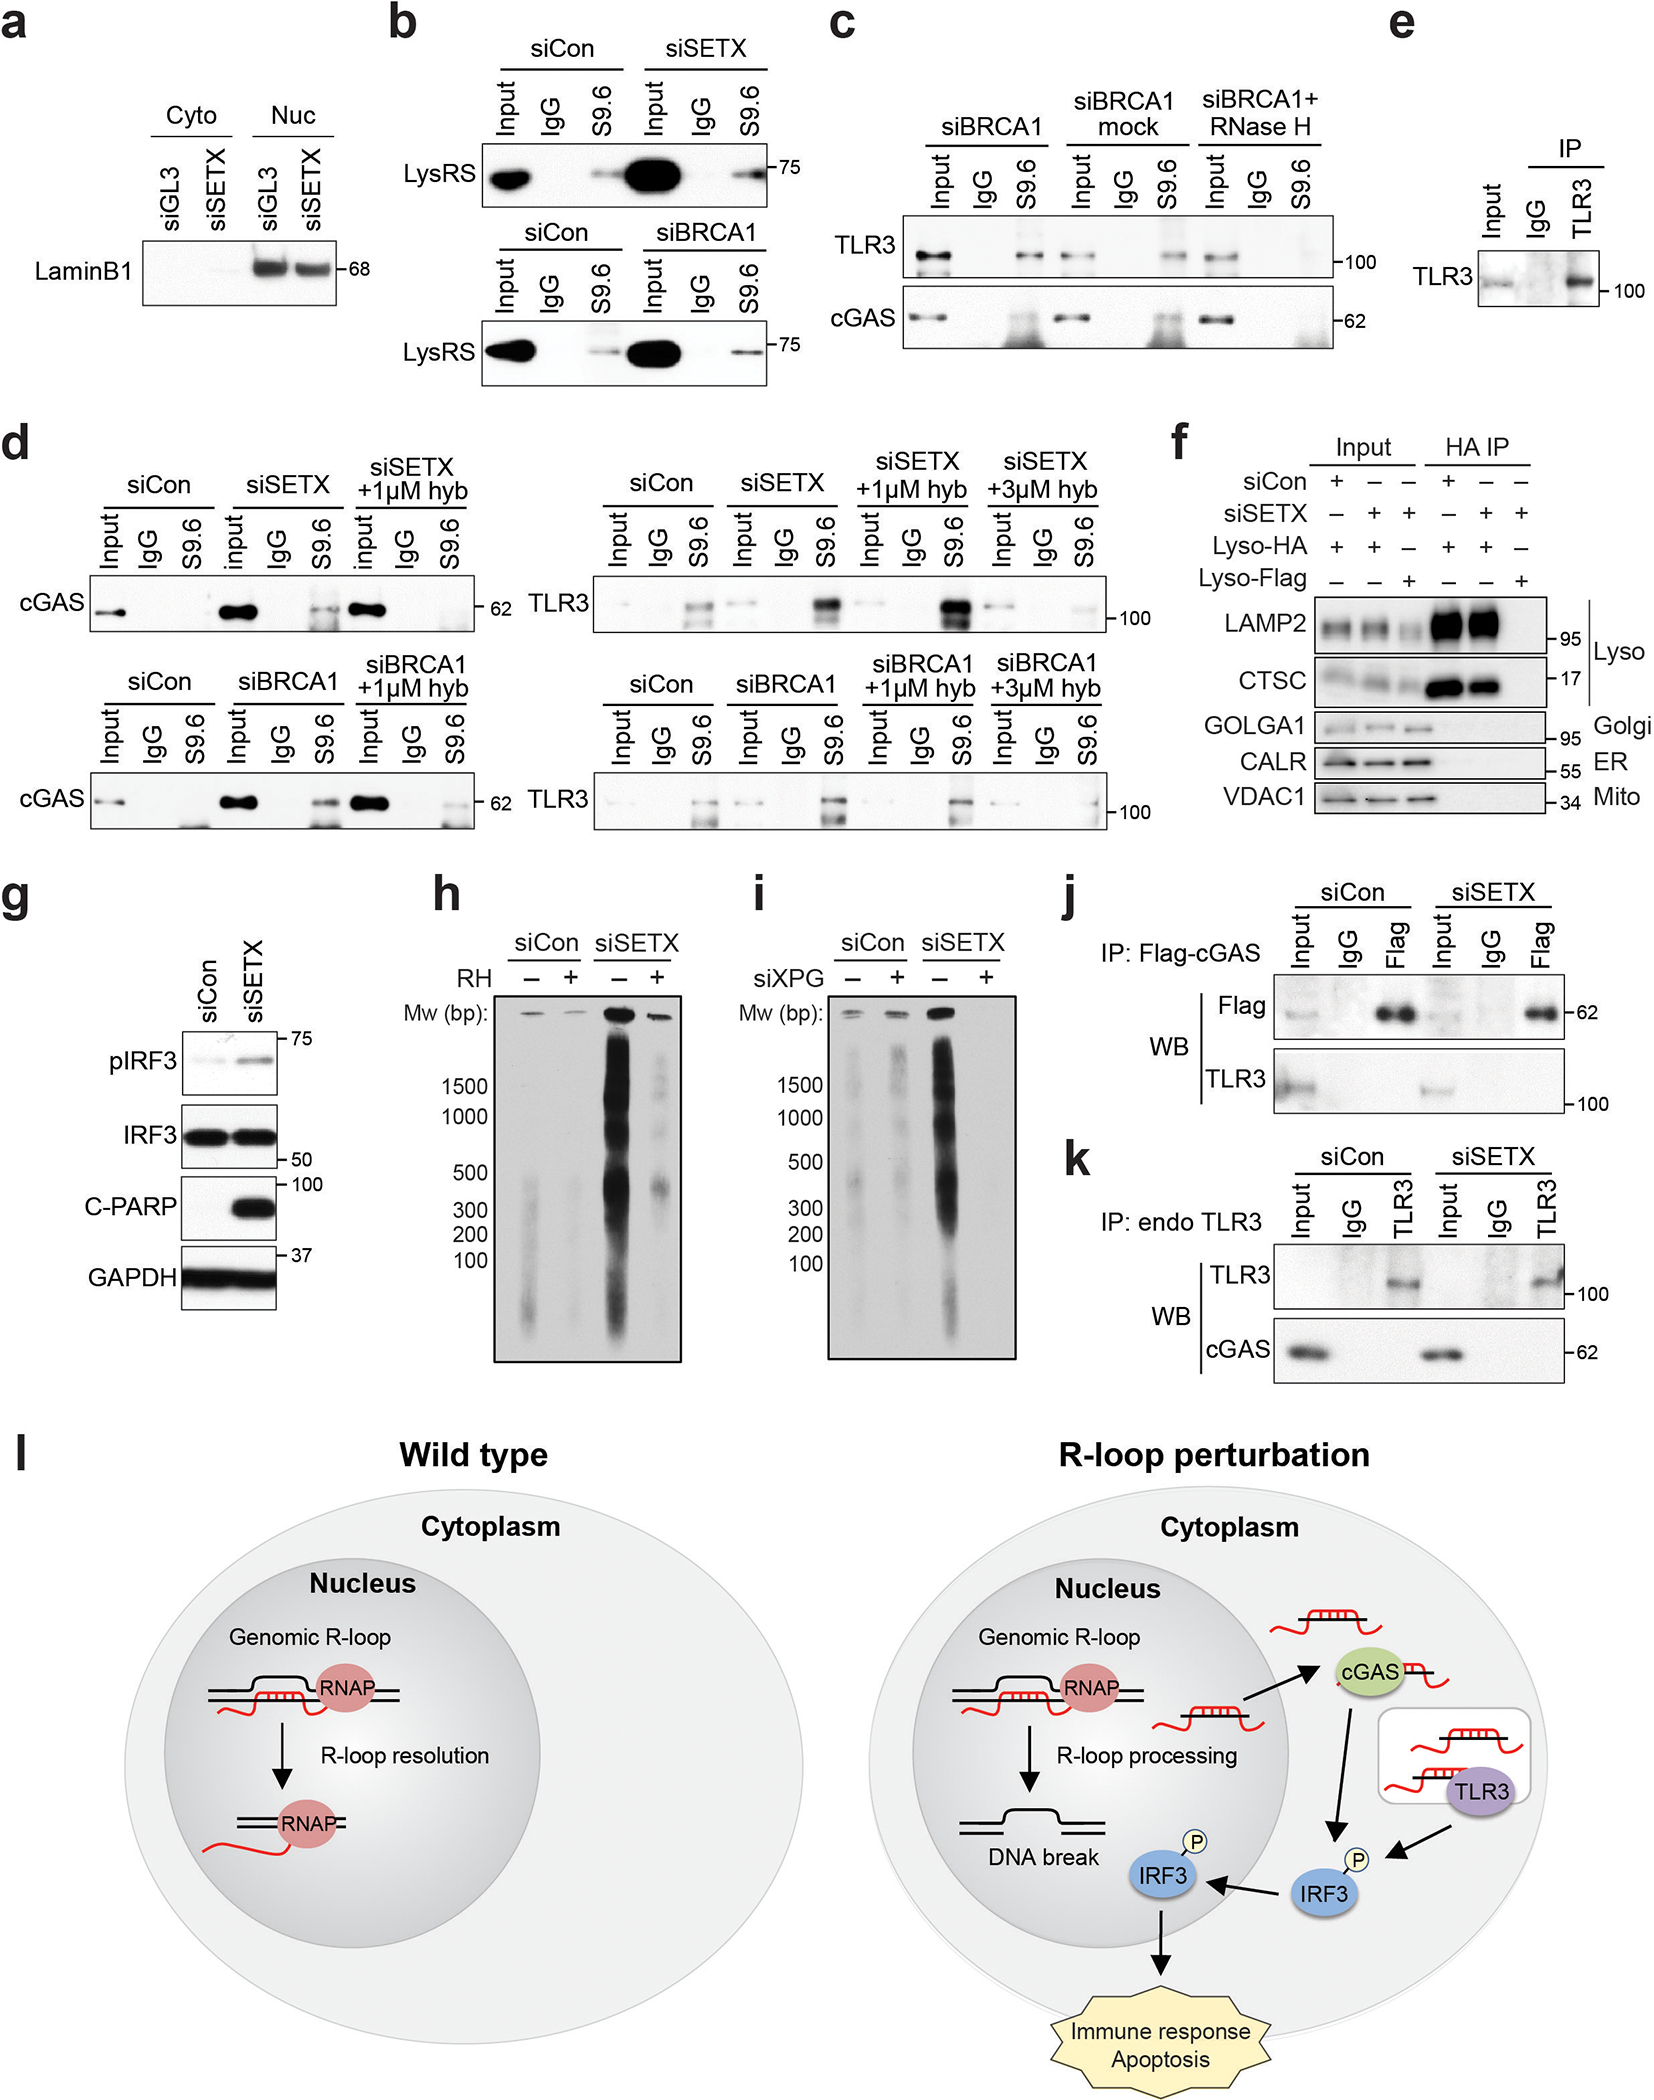
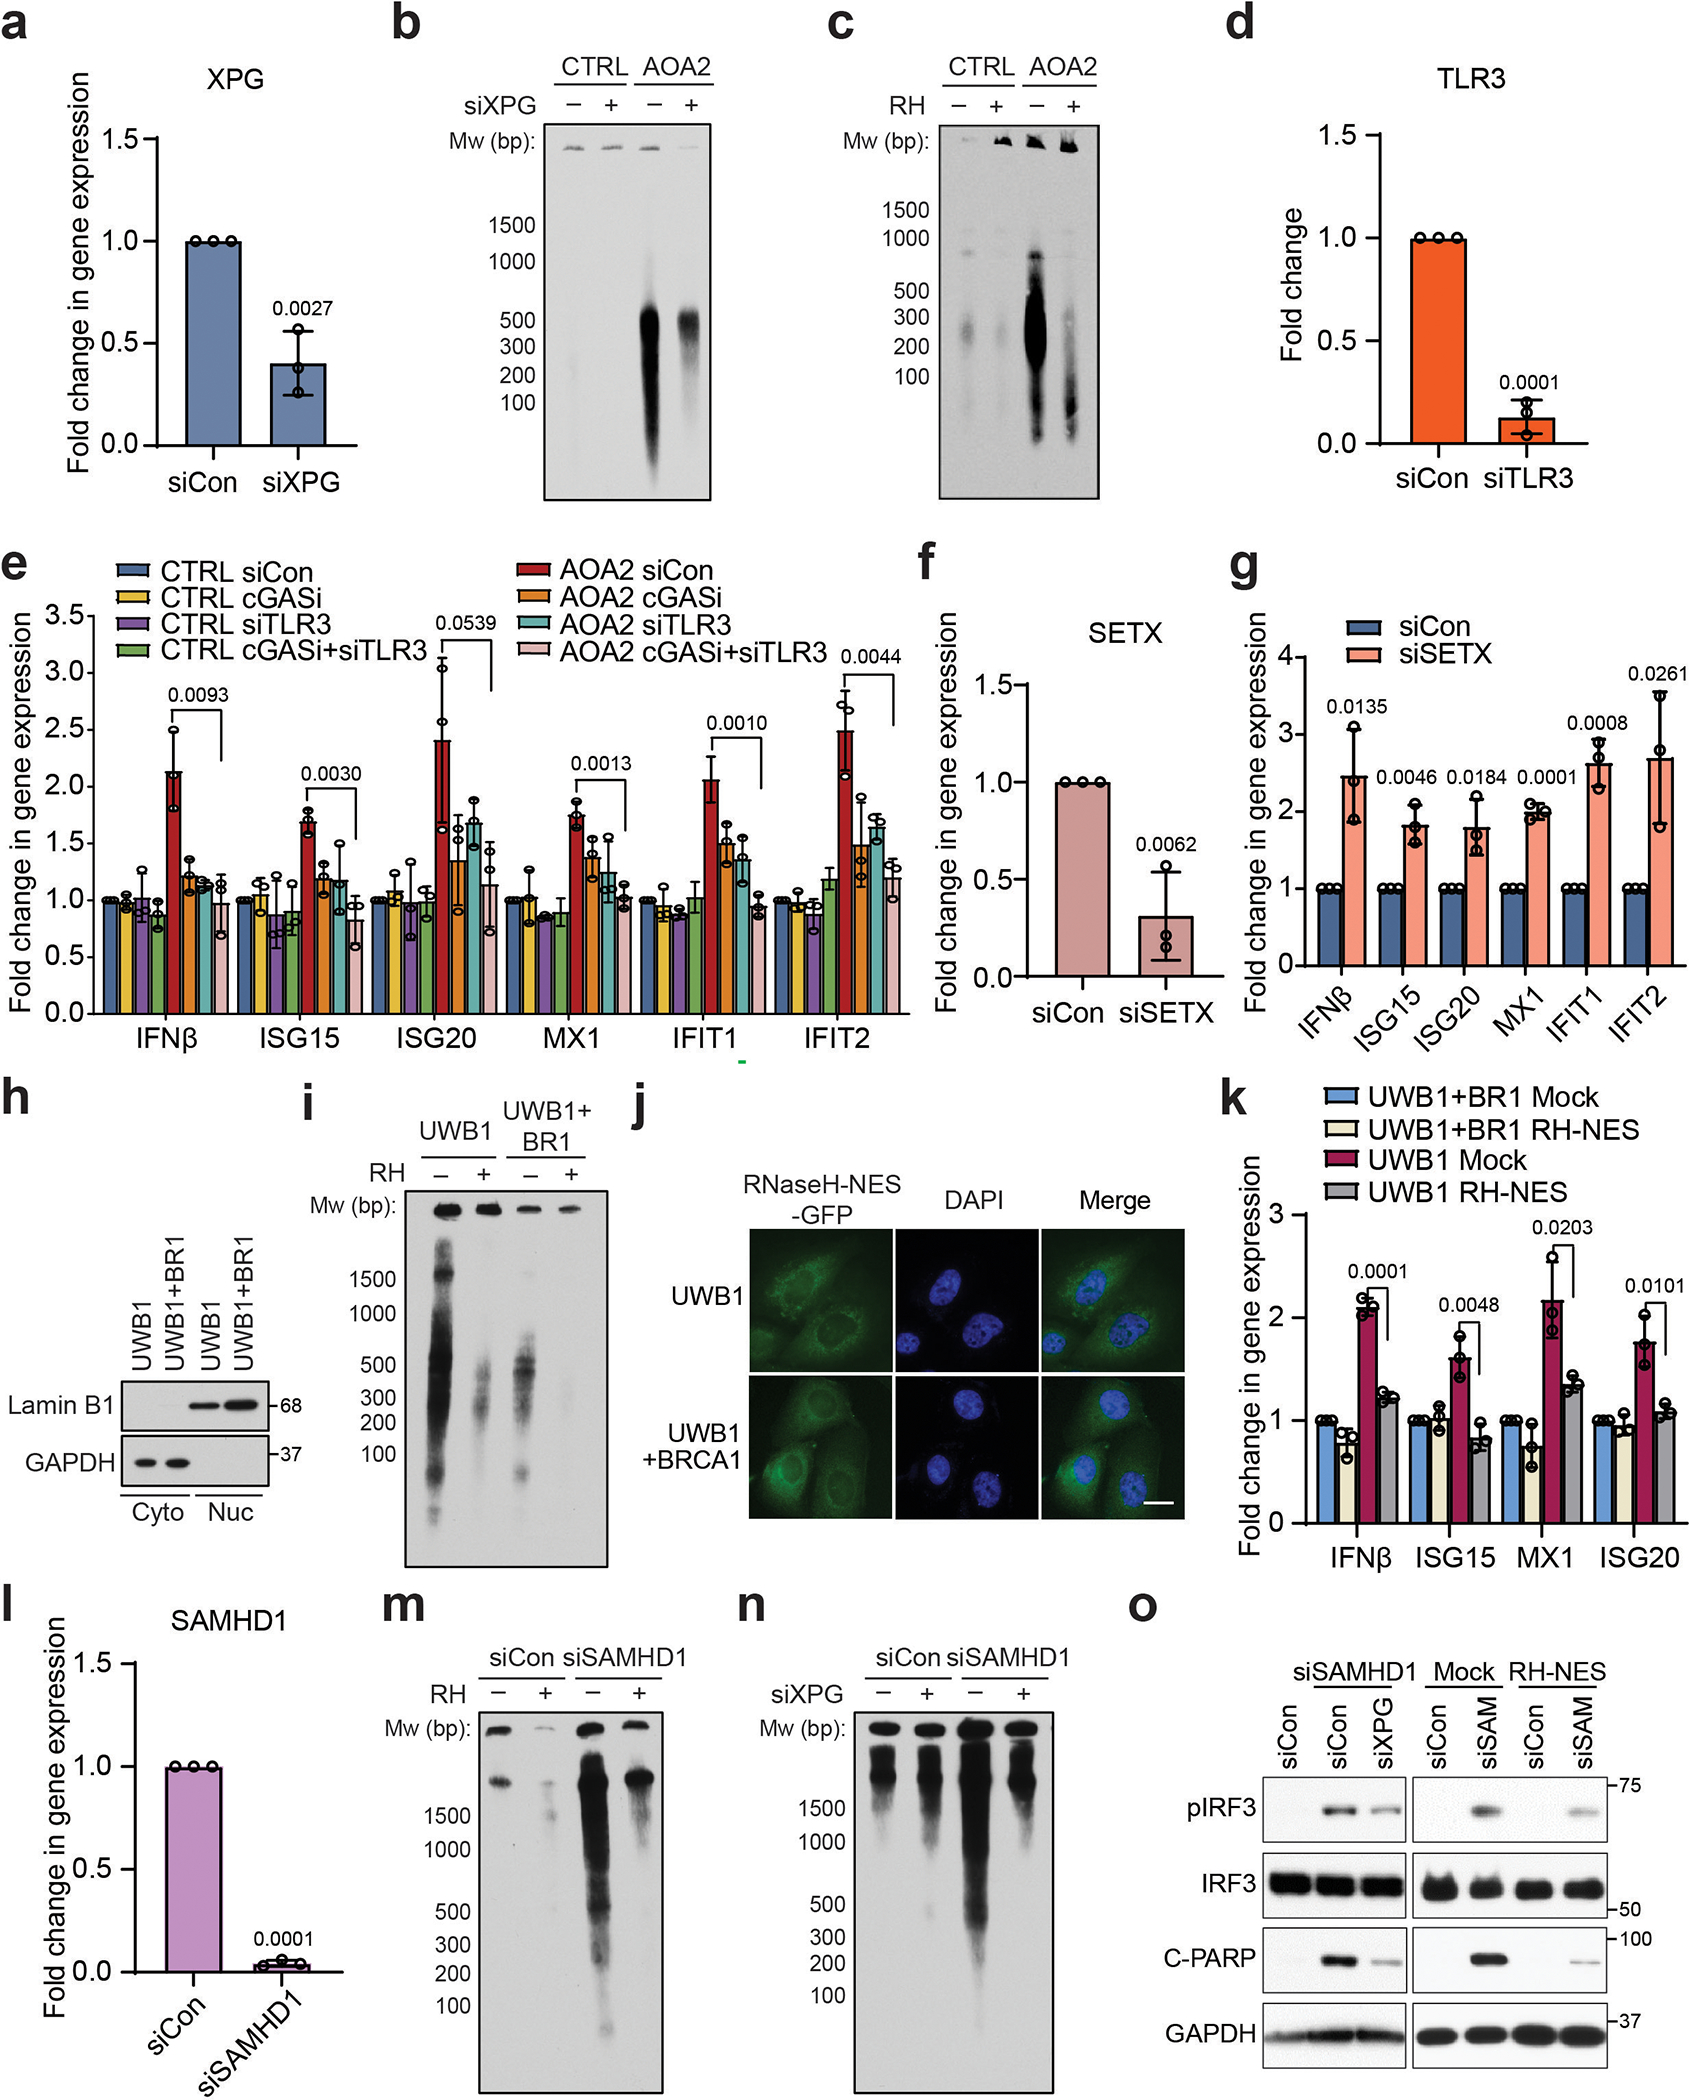
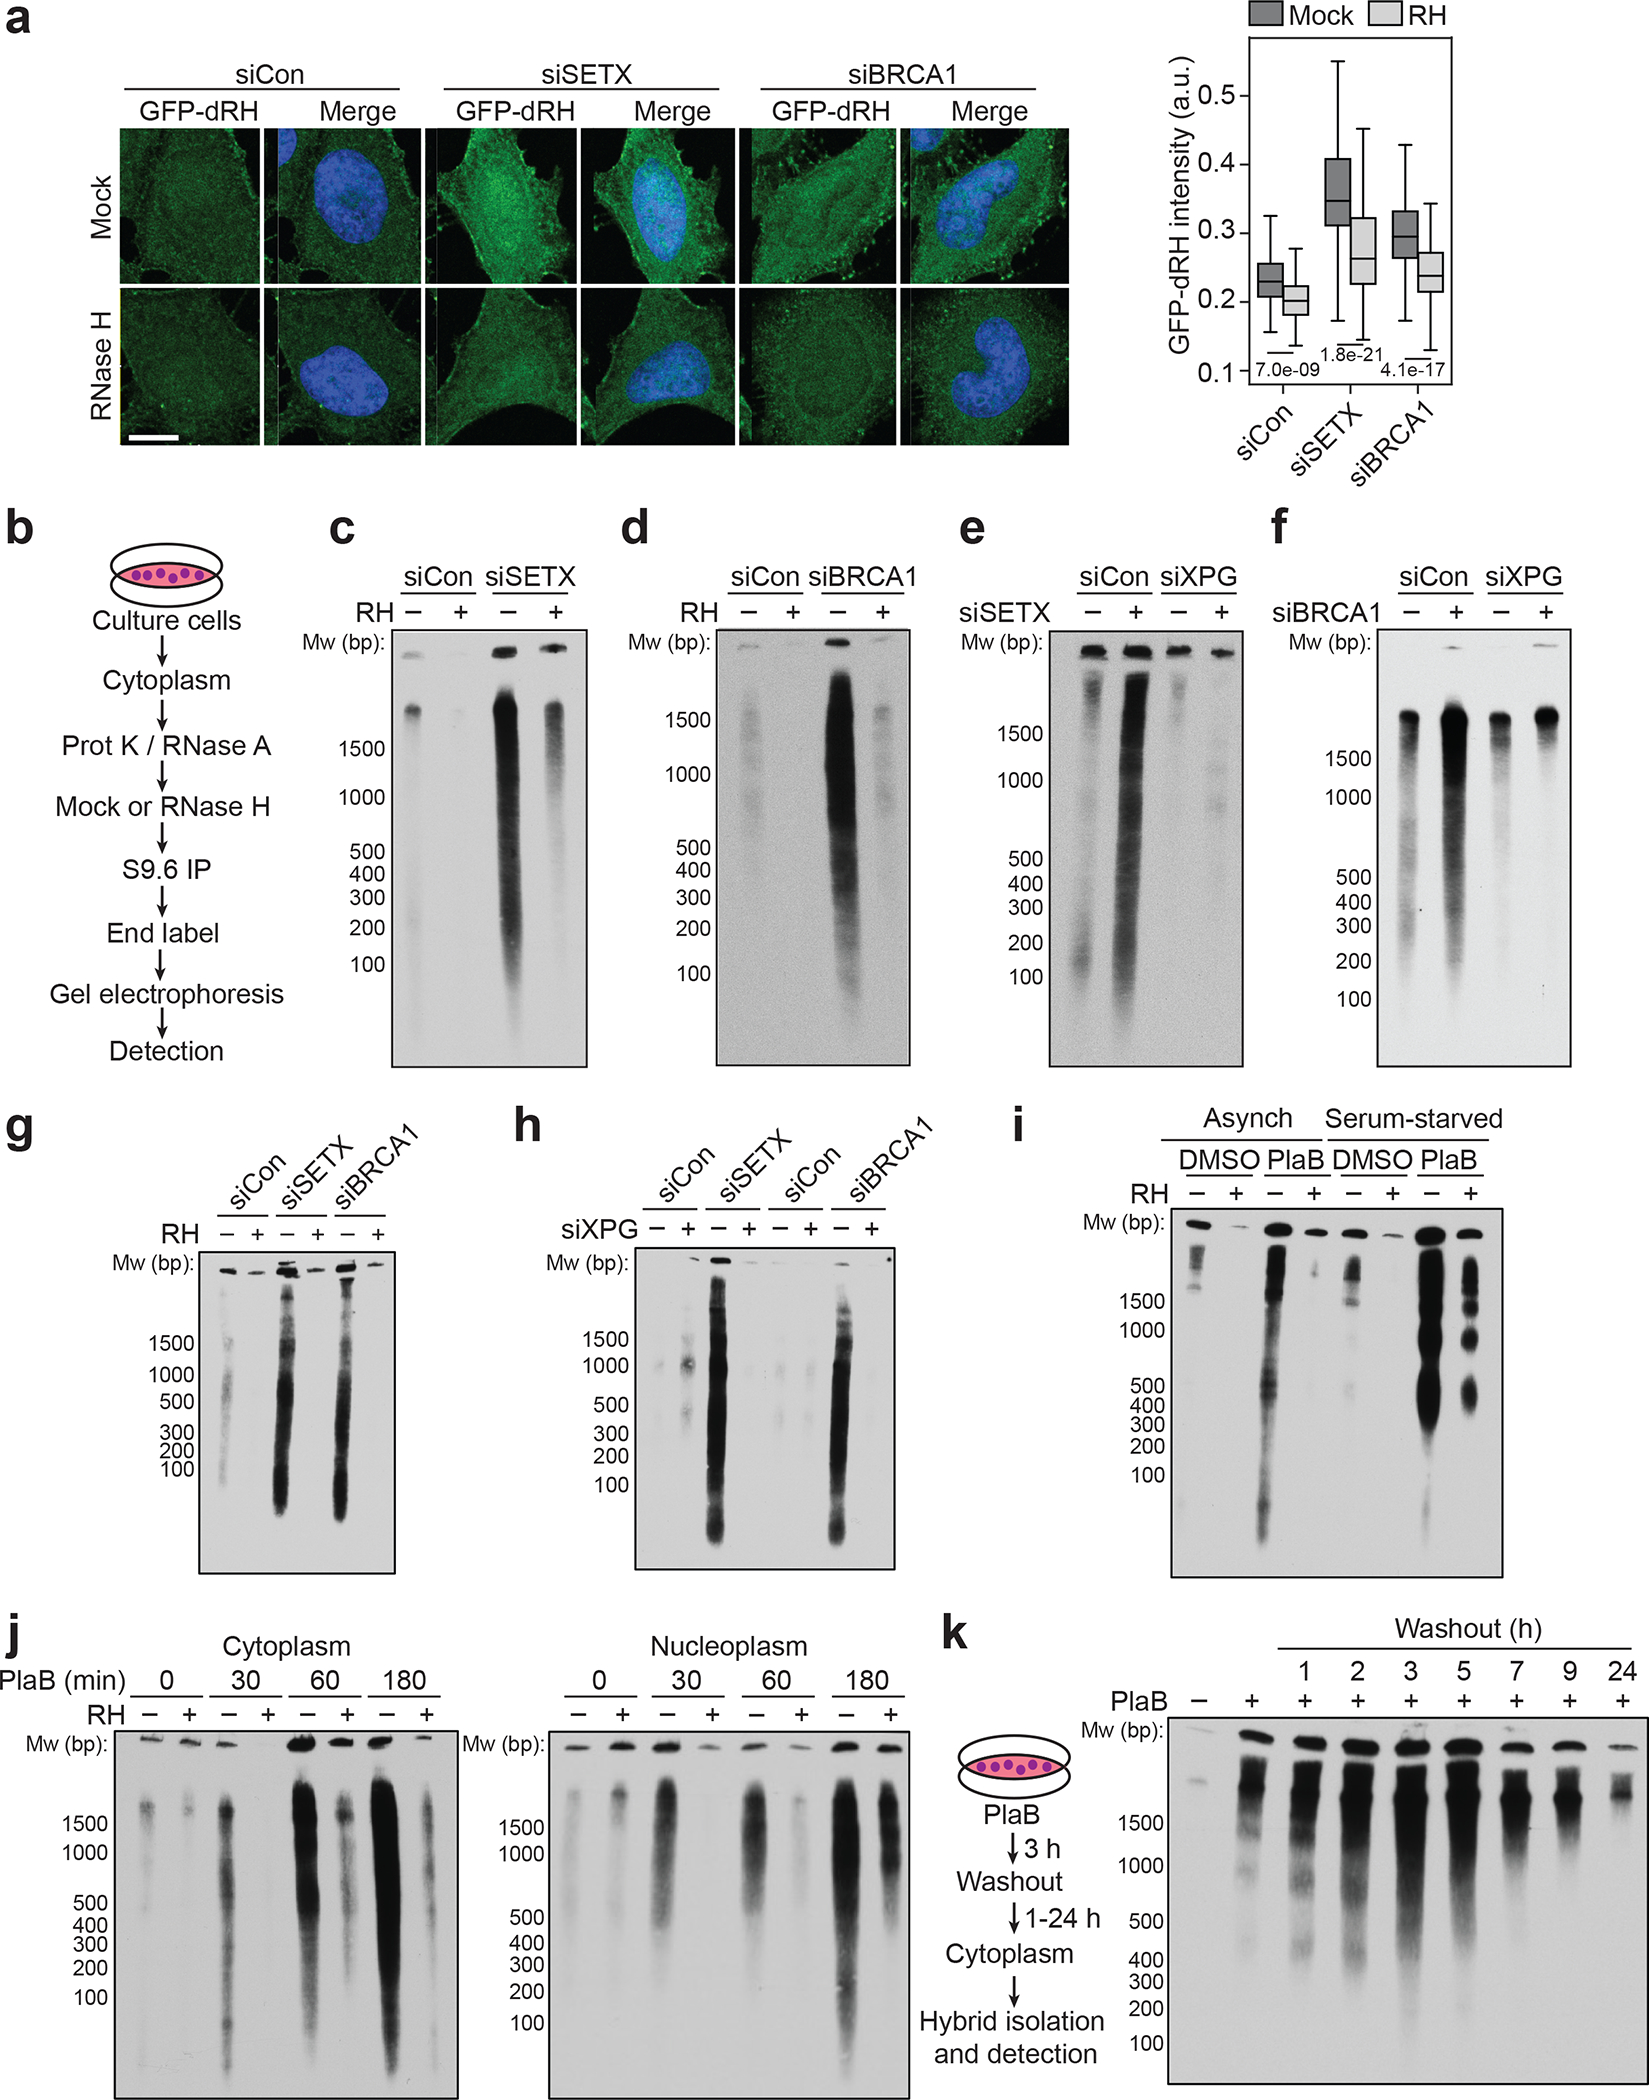
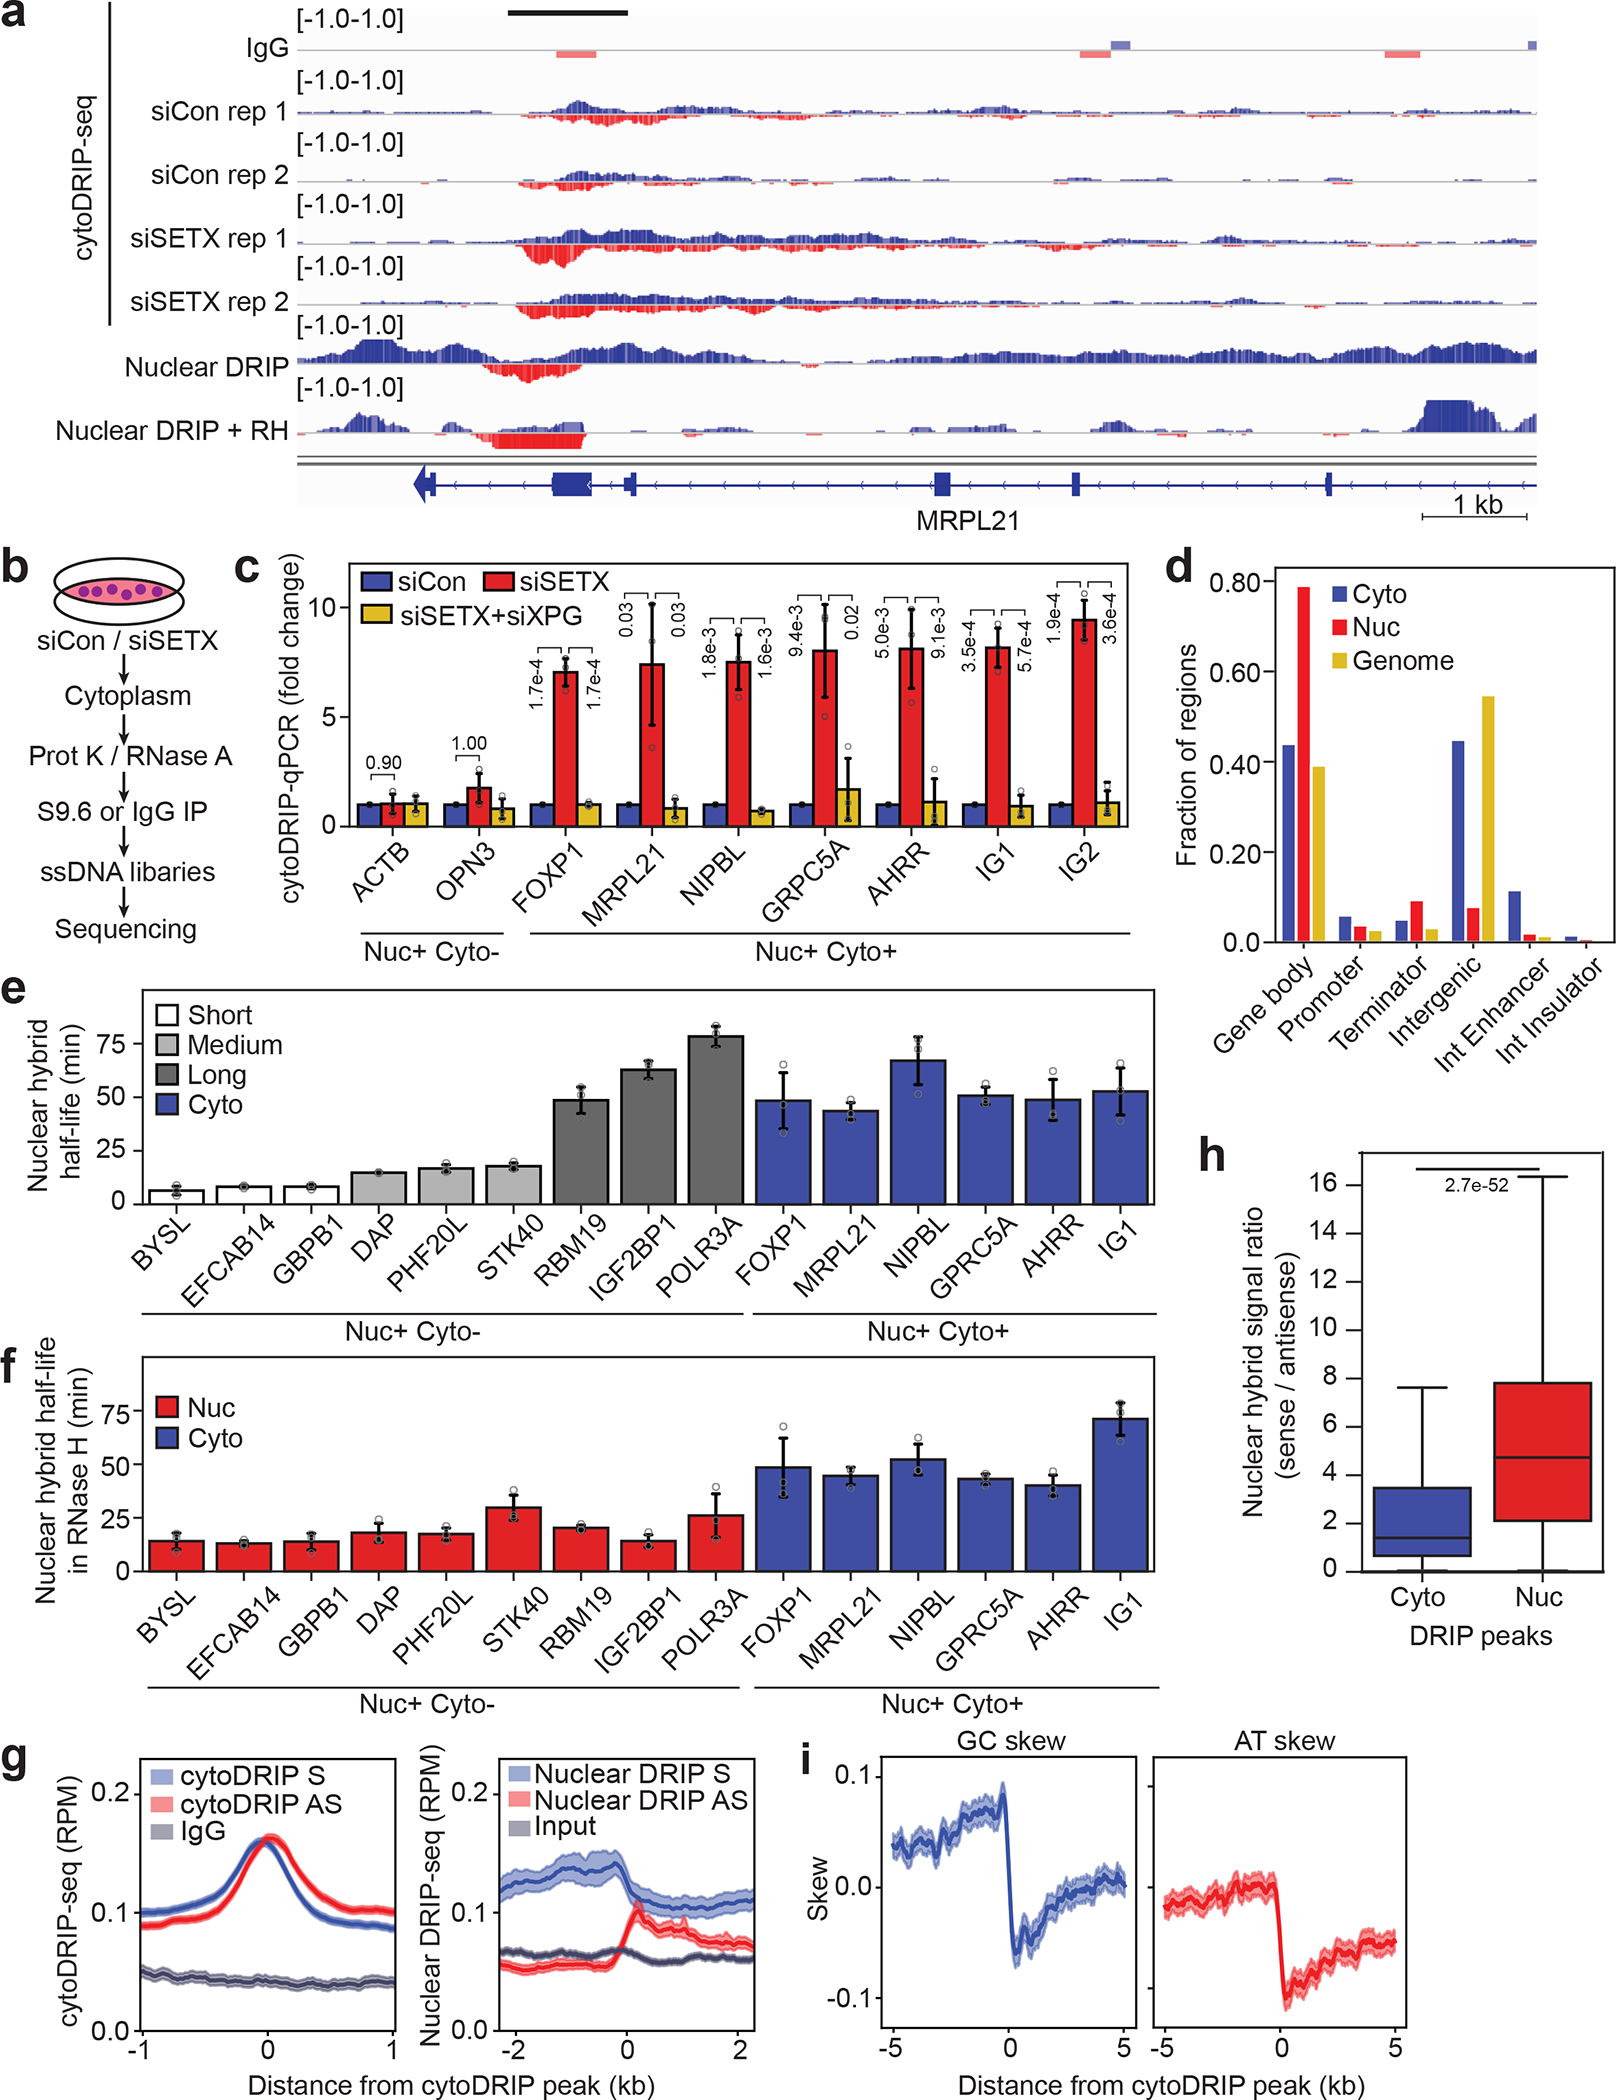
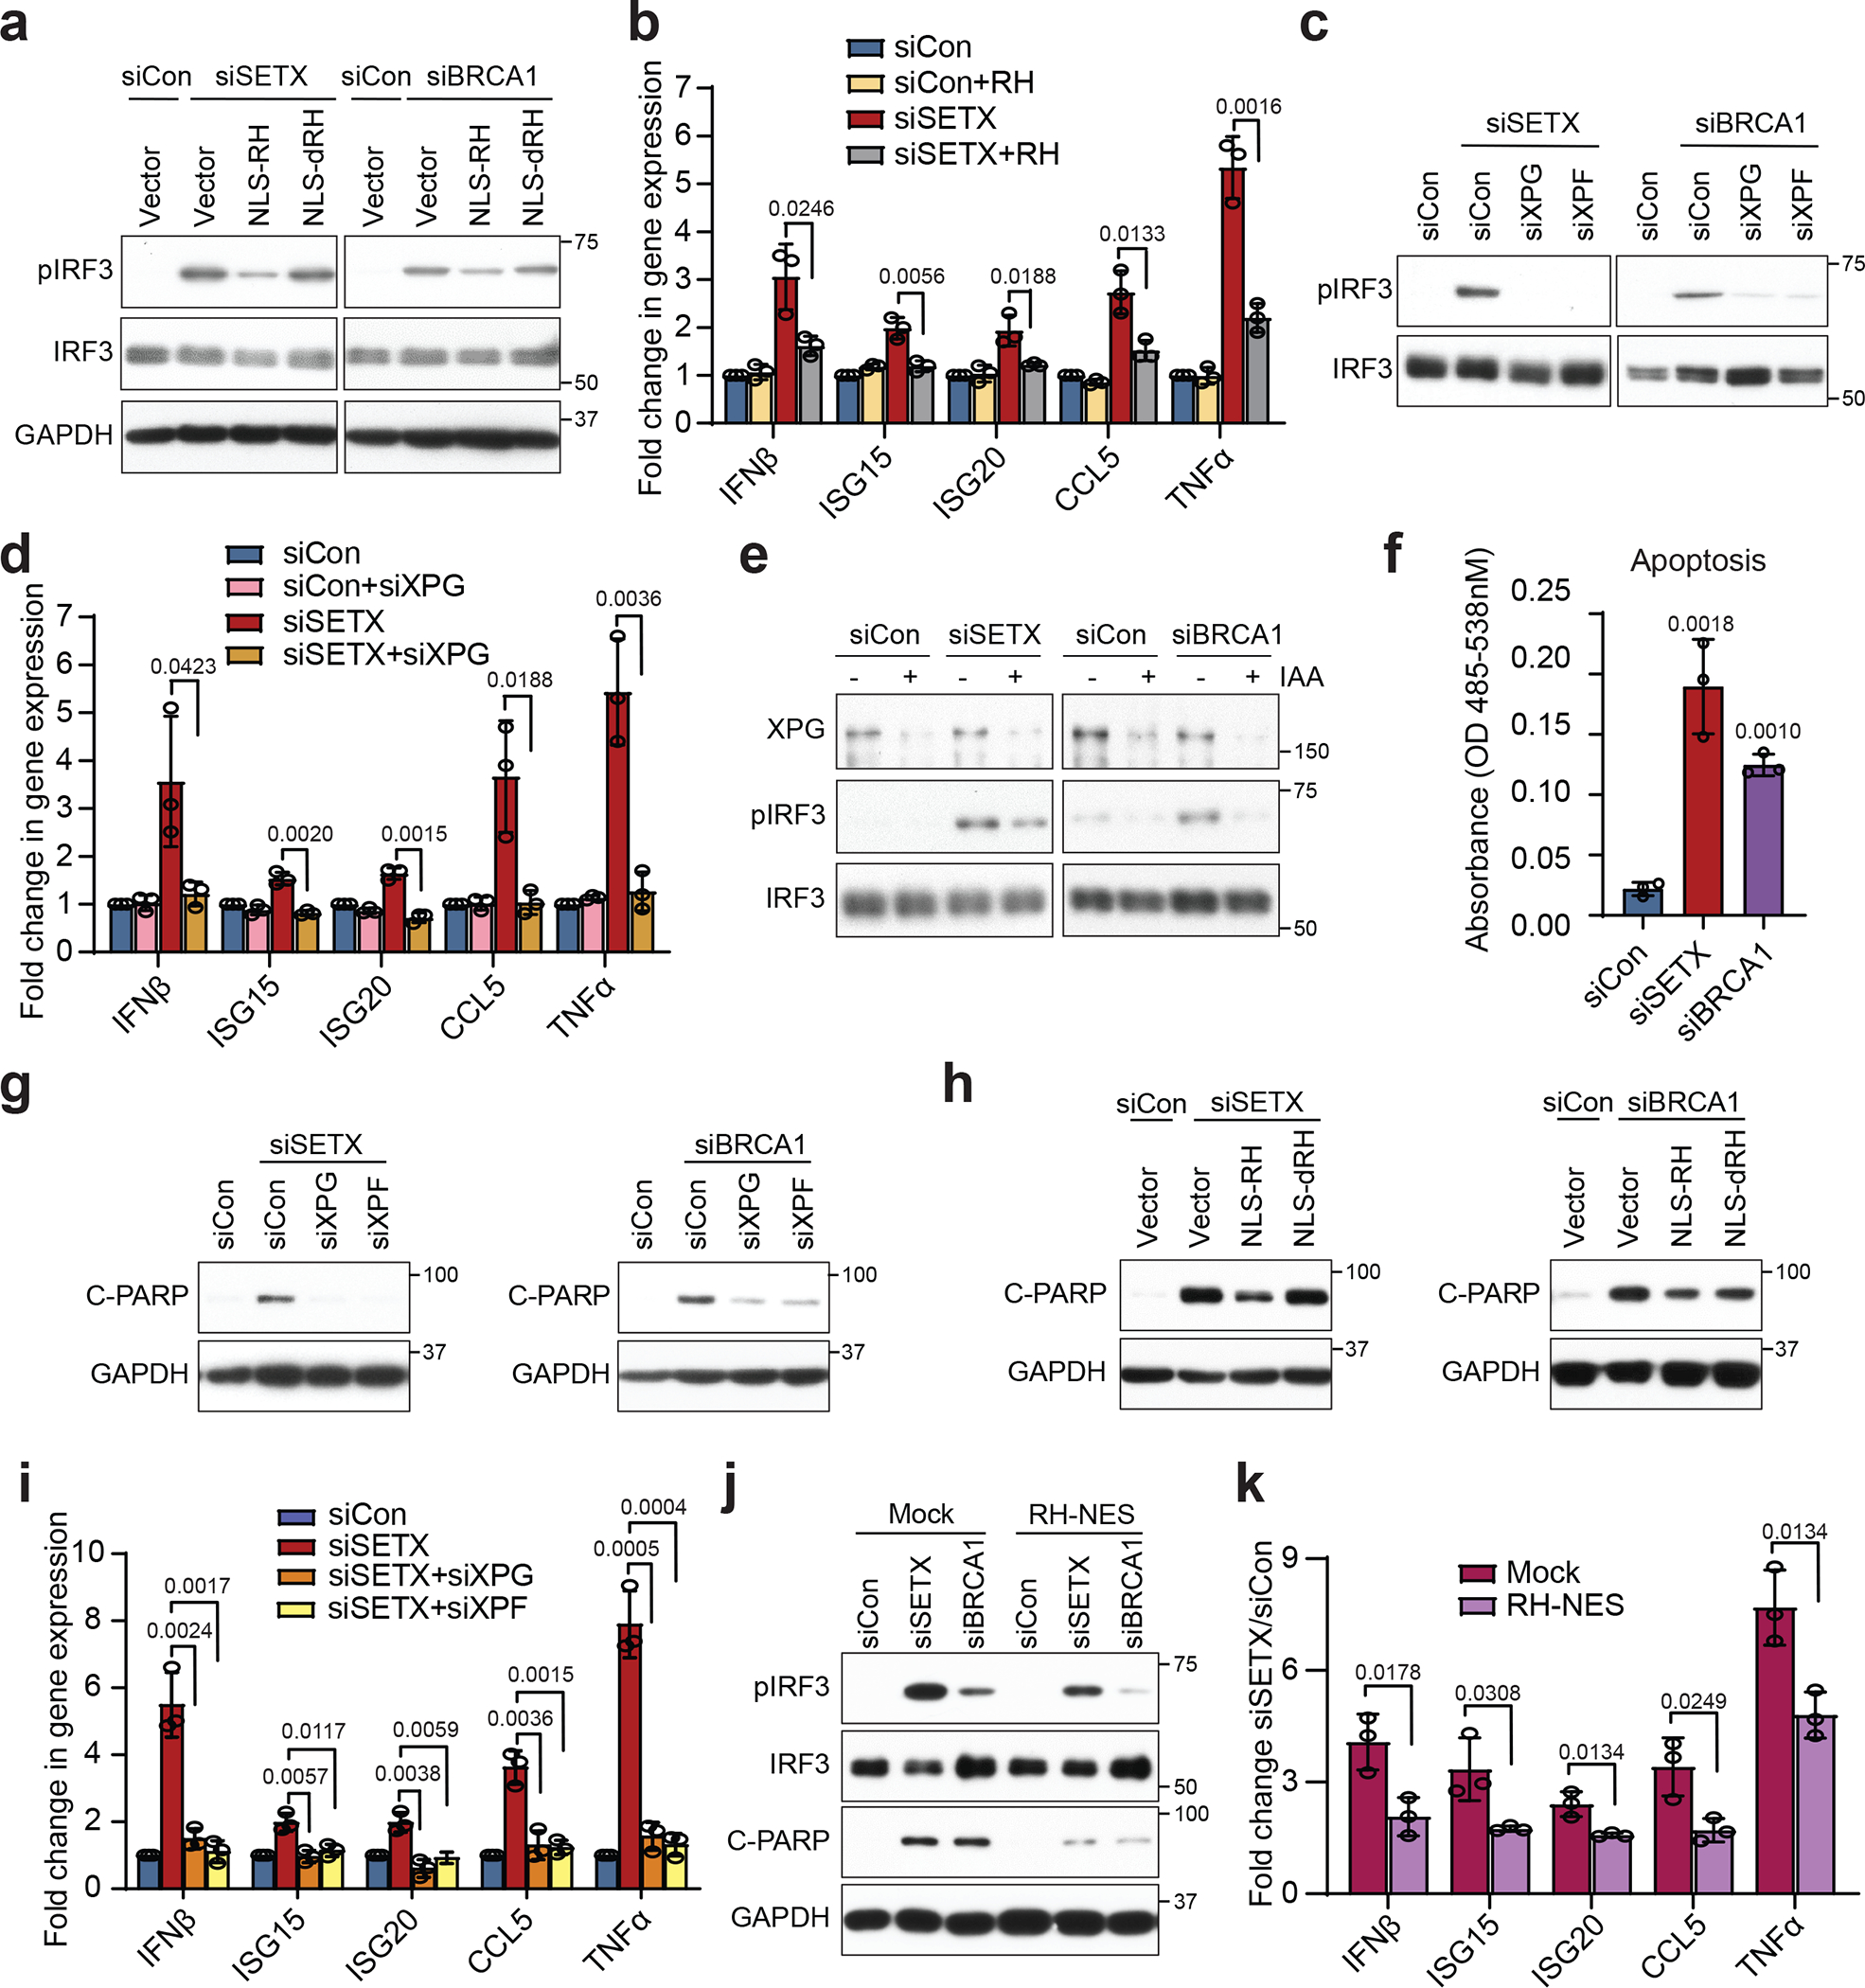
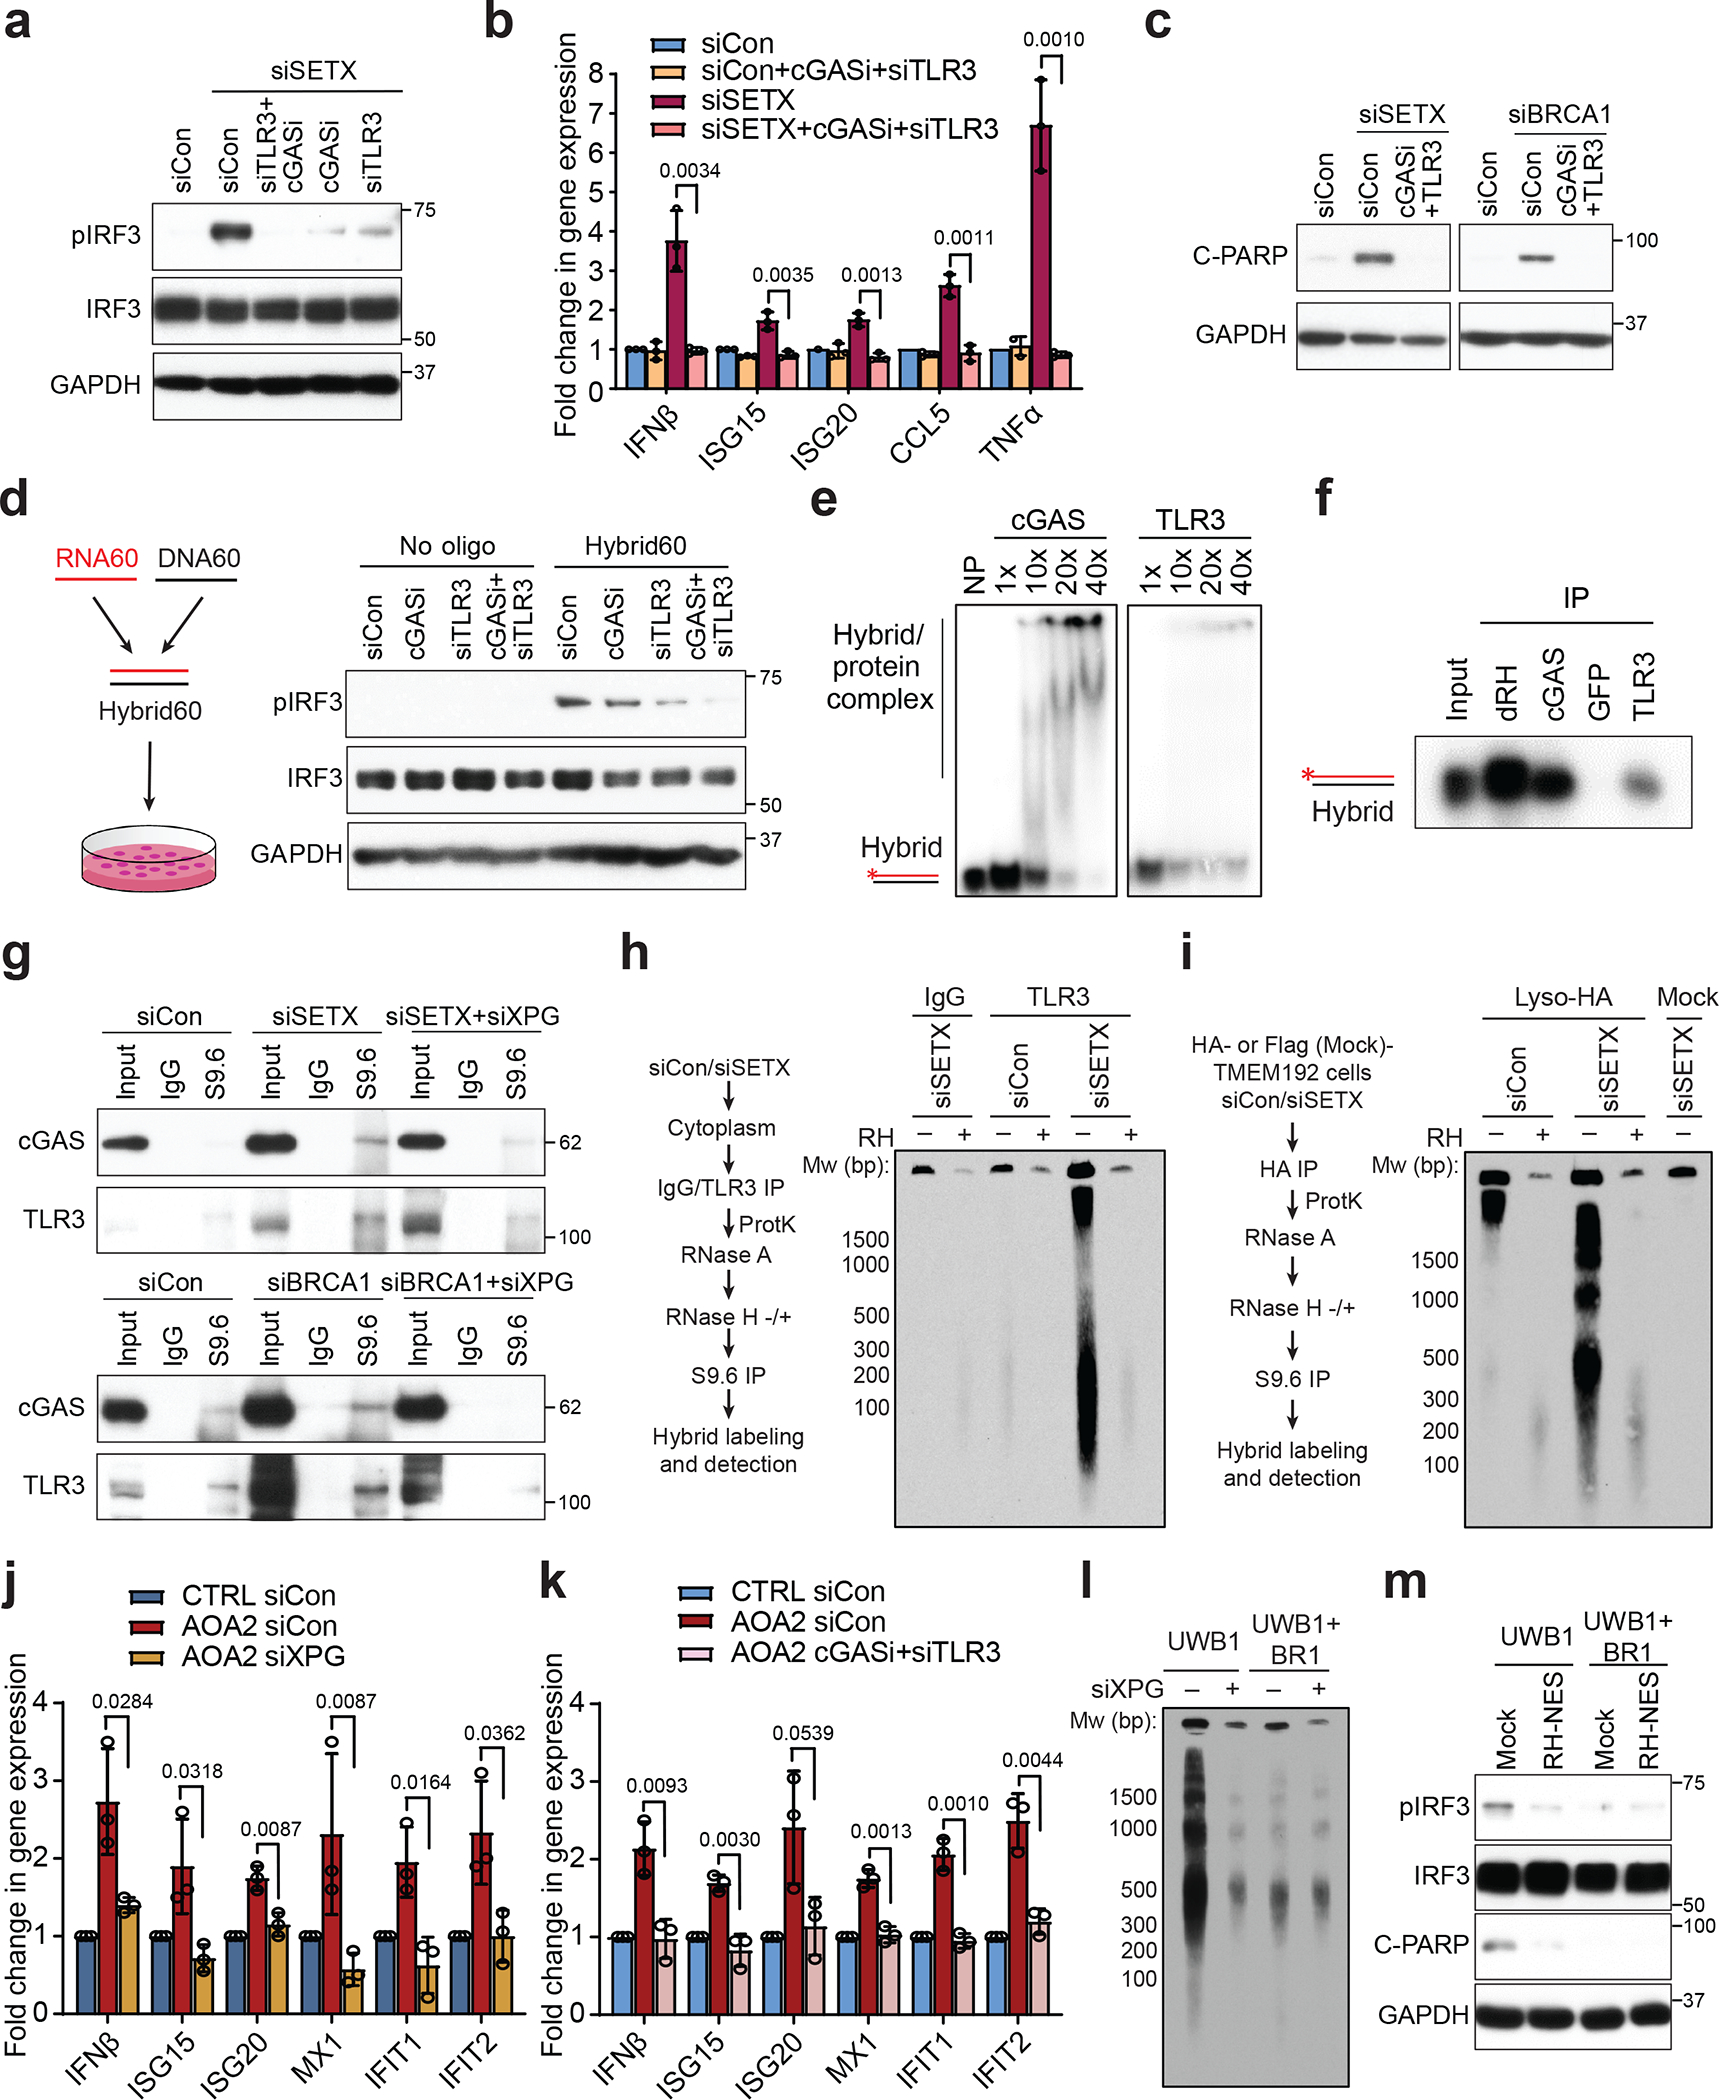
R-loops are RNA-DNA-hybrid-containing nucleic acids with important cellular roles. Deregulation of R-loop dynamics can lead to DNA damage and genome instability1, which has been linked to the action of endonucleases such as XPG2-4. However, the mechanisms and cellular consequences of such processing have remained unclear. Here we identify a new population of RNA-DNA hybrids in the cytoplasm that are R-loop-processing products. When nuclear R-loops were perturbed by depleting the RNA-DNA helicase senataxin (SETX) or the breast cancer gene BRCA1 (refs. 5-7), we observed XPG- and XPF-dependent cytoplasmic hybrid formation. We identify their source as a subset of stable, overlapping nuclear hybrids with a specific nucleotide signature. Cytoplasmic hybrids bind to the pattern recognition receptors cGAS and TLR3 (ref. 8), activating IRF3 and inducing apoptosis. Excised hybrids and an R-loop-induced innate immune response were also observed in SETX-mutated cells from patients with ataxia oculomotor apraxia type 2 (ref. 9) and in BRCA1-mutated cancer cells10. These findings establish RNA-DNA hybrids as immunogenic species that aberrantly accumulate in the cytoplasm after R-loop processing, linking R-loop accumulation to cell death through the innate immune response. Aberrant R-loop processing and subsequent innate immune activation may contribute to many diseases, such as neurodegeneration and cancer.


Conflict of interest statement

Competing Interests

K.A.C. is a scientific advisory board member of RADD Pharmaceuticals. M.A-R. is a scientific advisory board member of Lycia Therapeutics. The other authors declare no competing interests.

Figures

Extended Data Fig. 1.
Extended Data Fig. 1.. Cytoplasmic RNA-DNA hybrids are induced upon multiple cellular perturbations.
(a) Western blot showing knockdown efficiency of siRNAs targeting SETX and BRCA1 in HeLa cells. (b) Images showing segmentation of nuclear and cytoplasmic compartments in HeLa cells, using DAPI and whole cell stain as masks, respectively. Scale bar is 20 μm. (c) Images showing the lack of GFP protein binding on fixed HeLa cells. Scale bar is 10 μm. (d) Western blot showing fractionation of siControl and siSETX-treated HeLa cells into soluble nuclear and cytoplasmic compartments with Lamin B1 and GAPDH as markers, respectively. (e) cytoDRIP blot showing cytoplasmic hybrid accumulation in HeLa cells following SETX knockdown using a second siRNA. In vitro RH treatment was performed prior to pull-down. (f) cytoDRIP blot showing cytoplasmic hybrid accumulation in siSETX-treated HCT116 cells. In vitro RH treatment was performed prior to pull-down. (g) cytoDRIP blot showing cytoplasmic hybrid accumulation in siBRCA1-treated HCT116 cells. In vitro RH treatment was performed prior to pull-down. (h) cytoDRIP blot showing cytoplasmic hybrid accumulation in PlaB-treated (500nM, 3h) HeLa cells. In vitro RH treatment was performed prior to pull-down. (i) Western blot showing knockdown efficiency of siRNAs targeting XPG and XPF in HeLa cells. (j) cytoDRIP blot showing the role of XPG and XPF in cytoplasmic hybrid production after SETX or BRCA1 knockdown in HeLa cells. (k) Left: images of HeLa cells after SETX and XPG or XPF knockdown probed with GFP-dRH protein after fixation, following mock or RH pre-treatment. Scale bar is 10 μm. Right: quantification of cytoplasmic GFP-dRH intensities; p-values are shown; two-sided Mann Whitney U test: n-values from left to right: 611, 573, 659, 686. Center line, median; box limits, 75 and 25 percentiles, whiskers, min and max values. (l) As in (k) but after BRCA1 knockdown in HeLa cells. Two-sided Mann Whitney U test: n-values from left to right: 526, 502, 633, 653. Center line, median; box limits, 75 and 25 percentiles; whiskers, min and max values. (m) Schematic of the XPG auxin-inducible degron (AID) system. (n) Western blots showing XPG degradation after knockdown of SETX (left) and BRCA1 (right) in HCT116 cells. (o) cytoDRIP blot showing cytoplasmic hybrid accumulation after knockdown of SETX or BRCA1 and impact of auxin-induced XPG degradation in HCT116 cells.
Extended Data Fig. 2.
Extended Data Fig. 2.. Dynamics of cytoplasmic hybrid production.
(a) cytoDRIP blot showing cytoplasmic hybrids in mock or PlaB treated (500 nM, 3 h) BAX−/−BAK−/− HeLa cells with or without in vitro RH treatment. (b) Flow cytometry analysis of asynchronous or serum-starved MCF10A cells following incubation with BrdU. Cells were segmented based on DNA content (propidium iodide staining) and BrdU intensity. The percentage of cells in G1, S and G2/M are indicated. At least 50,000 cells were quantified per condition. (c) Western blot showing fractionation of asynchronous and serum-starved MCF10A cells into soluble nuclear and cytoplasmic compartments with LaminB1 and GAPDH as markers, respectively. (d) RT-qPCR from asynchronous or serum-starved MCF10A cells showing increased unspliced mRNA following PlaB treatment (500 nM, 3 h). Shown is the mean ± s.d. from three independent biological replicates (n = 3), p-values are indicated in the figure; unpaired, two-tailed t-test. (e) As in (c) but for foreskin fibroblasts. (f) Cell cycle quantification from high-content imaging of foreskin fibroblasts after EdU incorporation, using DAPI staining for DNA content. Shown is the mean ± s.d. from three independent biological replicates (n = 3). (g) As in (d) but for foreskin fibroblasts. (h) cytoDRIP blot showing cytoplasmic hybrids extracted from equal numbers of asynchronous or serum-starved foreskin fibroblasts following DMSO or PlaB treatment (500 nM, 3 h), with mock and RH treatment prior to pull-down. (i) As in (b) but for BAX−/−BAK−/− MCF10A cells. (j) Western blot showing fractionation of asynchronous and serum-starved BAX−/−BAK−/− MCF10A cells into soluble nuclear and cytoplasmic compartments with LaminB1 and GAPDH as markers, respectively. (k) cytoDRIP blot showing cytoplasmic hybrids in asynchronous and serum-starved BAX−/−BAK−/− MCF10A cells with DMSO or PlaB treatment (500 nM, 3 h). Each sample was treated with RH in vitro to confirm the specificity of the hybrid IP. (l) Left: experimental workflow. Right: blots showing hybrids isolated from the cytoplasm or nucleoplasm of siCon or siSETX-treated HeLa cells, with mock or LMB treatment (3 h, 5 nM) prior to harvest. (m) Left: experimental workflow. Middle: western blot as in (c) from HeLa cells treated with vehicle control (DMSO) or PlaB (500 nM, 3 h). Right: blot showing hybrids as in (i) but in HeLa cells treated with LMB (2 h, 5 nM) followed by PlaB + LMB for a further 3 h. (n) Representative images showing cyclin B1 localization in fixed HeLa cells treated with LMB (5 h, 5 nM) or vehicle control (EtOH). Scale bar is 10 μm. (o) RT-qPCR from HeLa cells showing increased unspliced mRNA following treatment with PlaB (500 nM) for the times indicated. Shown is the mean ± s.d. from three independent biological replicates (n = 3). (p) As in (o) but cells were treated with PlaB (500 nM, 3 h) and then fresh media was added following PlaB withdrawal for the times indicated. Shown is the mean ± s.d. from four independent biological replicates (n = 4).
Extended Data Fig. 3.
Extended Data Fig. 3.. Characteristics of cytoDRIP peaks.
(a) Scatter plots showing high reproducibility between cytoDRIP-seq siCon (left) and siSETX (right) replicates; Pearson’s correlation: R = 0.96 and 0.95 respectively; p < 1e-16 (machine precision limit). (b) Bar blot showing proportion of deduplicated sequencing reads mapping to the nuclear and mitochondrial (mito) genomes in cytoDRIP-seq samples. Data from two biological replicates are shown. (c) Table showing peak characteristics in cytoDRIP-seq, nuclear DRIP-seq, and nuclear DRIP-seq following RH treatment (RHR DRIP). Numbers of peaks (peak count), genomic space covered by peaks (peak area), size of peaks (mean and median), percent of genome covered by peaks (coverage) are shown. IQR is interquartile range. (d) Venn diagram of genome areas (in megabases) occupied by peaks identified in siCon and siSETX cytoDRIP-seq samples. (e) Bar plot showing enrichment of cytoplasmic hybrid sites by qPCR after S9.6 pull-down, relative to IgG. OPN3 was only found in the nucleus; the other sites were found in the nucleus and cytoplasm. Shown is the mean ± s.d. from three independent biological replicates (n = 3). (f) CytoDRIP-qPCR in HeLa cells after depletion of SETX at cytoDRIP-seq sites and nuclear R-loop forming sites. RH treatment was performed in vitro, prior to hybrid pull-down. ‘Nuc+ Cyto+’ sites were found in the nucleus and cytoplasm, while ‘Nuc+ Cyto−’ sites were only found in the nucleus. Gene names are shown; IG1-IG5 are intergenic sites. Shown is the mean ± s.d. from four independent biological replicates (n = 4); p-values are shown in the figure, unpaired two-tailed t-test. (g) Scatter plots showing increased cytoDRIP-seq signal upon depletion of SETX in genic sites (upper) and intergenic sites (lower). Dashed line represents x = y. (h) Genome browser views of genic (top) and intergenic (bottom) cytoDRIP-seq sites. From top to bottom normalized tracks are: IgG, siCon (2 replicates), siSETX (2 replicates), nuclear DRIP-seq, nuclear DRIP-seq + RH. Red indicates negative strand signal, blue indicates positive strand signal.
Extended Data Fig. 4.
Extended Data Fig. 4.. CytoDRIP sites map to genic and intergenic regions.
(a) Histogram showing distribution of cytoDRIP peaks over genes. Positions of transcription start site (TSS) and transcription end site (TES) are indicated. (b) Blue histograms show expected overlaps between repeat elements and randomly sampled peak sets (matched in size and number from cytoDRIP peaks) from within all nuclear R-loop peaks. Red dashed line indicates the observed overlap for cytoDRIP peaks. (c) Z-scores for the overlaps calculated in (b); individual p-values are shown on the right. (d) Proportion of nuclear DRIP-seq and cytoDRIP-seq reads aligning to consensus regions for rDNA, alpha satellite for centromeres and telomeric repeats. Data are from two independent biological replicates (n = 2) per condition, black lines show the mean. (e) Bar plot showing proportion of cytoDRIP peaks overlapping nuclear DRIP and/or RNase H resistant hybrid (RHR) sites. (f) Histogram of peak lengths comparing cytoDRIP-seq (siSETX condition) (Cyto) and nuclear DRIP-seq (Nuc) peaks. (g) Scatter plot correlating nuclear DRIP-seq signal at cytoDRIP regions with cytoDRIP-seq signal, Pearson’s correlation: R = 0.24. (h) Scatter plot correlating nascent transcription by GRO-seq at cytoDRIP regions with cytoDRIP-seq signal, Pearson’s correlation: R = 0.14. (i,j) Genome browser views showing lack of cytoDRIP signal at sites with robust nuclear R-loop formation (i) ACTB, (j) RPL13A. From top to bottom normalized tracks are: IgG, siCon (2 replicates), siSETX (2 replicates), nuclear DRIP-seq, nuclear DRIP-seq + RH. Red indicates negative strand signal, blue indicates positive strand signal. (k) Western blot showing HeLa cells stably expressing GFP-tagged XPG. GAPDH is the loading control. (l) GFP ChIP-qPCR in HeLa cells following knockdown of SETX and/or XPG, showing GFP-XPG binding at hybrid sites. ‘Nuc+ Cyto+’ sites were found in the nucleus and cytoplasm, while ‘Nuc+ Cyto−’ sites were only found in the nucleus. Gene names are shown; IG1 and IG2 are intergenic sites. Shown is the mean ± s.d. from three independent biological replicates (n = 3); unpaired two-tailed t-test; p-values are shown.
Extended Data Fig. 5.
Extended Data Fig. 5.. Cytoplasmic hybrids are derived from long-lived and partially RNase H-resistant nuclear R-loops.
(a) Nuclear DRIP-qPCR after actinomycin D treatment. Nuclear R-loop sites with short, average and long half-lives are indicated, as well as cytoDRIP sites. R-loopneg indicates a nuclear site with low R-loop abundance. Gene names are indicated. IG1 is an intergenic site. Shown is the mean ± s.d. from three independent biological replicates (n = 3). P = 9.81e-12 between nuclear sites with short or medium lifetimes and cytoDRIP sites (two-tailed Mann Whitney U test). (b) Nuclear DRIP-qPCR after actinomycin D treatment showing example fits of exponential decay to derive RNA-DNA hybrid half-lives. Shown is the mean from three independent biological replicates (n = 3). (c) Aggregate plots around cytoDRIP regions showing nuclear DRIP-seq signal following low (red) or high (purple) RH treatment in vitro. Input signal is grey. Each line is the mean of 1762 genic peaks (n = 1762). Error bands represent 95% CI of the mean. (d) Genome browser views of previously identified long-lived nuclear R-loop sites. From top to bottom normalized tracks are: IgG, siCon (2 replicates), siSETX (2 replicates), nuclear DRIP-seq, nuclear DRIP-seq + in vitro RH. Red indicates negative strand signal, blue indicates positive strand signal.
Extended Data Fig. 6.
Extended Data Fig. 6.. Cytoplasmic hybrids are characterized by switches in nucleotide skew.
(a) Model of converging transcription at cytoDRIP peaks. RNA-DNA hybrids form as a result of sense and antisense transcription in regions of high GC-skew on the non-template strand. Example nucleotide sequences that fit the observed skew pattern are shown. (b) Violin plots of AT content (left) and GC content (right) for cytoDRIP (n = 2911) and nuclear DRIP (n = 65,541) regions, two-tailed Mann Whitney U between cytoDRIP and nuclear DRIP regions: p = 3.6e-8 (left), p = 3.5e-16 (right). Center line, median; box limits, 75 and 25 percentiles, whiskers, min and max values. (c) Aggregate plots around genic nuclear DRIP regions (n = 56,433) showing GC skew (left) and AT skew (right). Error bands represent 95% CI of the mean. (d) Aggregate plots around genic siCon cytoDRIP regions showing GC skew (left) and AT skew (right). Means of 282 peaks (n = 282) are shown; error bands represent 95% CI of the mean. (e) Aggregate plots around genic siCon cytoDRIP regions showing cytoDRIP-seq signal (left), nuclear DRIP-seq signal (middle) and nuclear RHR signal (right). Means of 282 peaks (n = 282) are shown; error bands represent 95% CI of the mean. (f) Violin plots of AT content (left) and GC content (right) for siSETX (n = 2629) and siCon (n = 282) cytoDRIP regions, two-tailed Mann Whitney U between cytoDRIP and nuclear DRIP regions: p = 0.003 (left), p = 0.003 (right). Center line, median; box limits, 75 and 25 percentiles, whiskers, min and max values.
Extended Data Fig. 7
Extended Data Fig. 7. Different perturbations inducing cellular R-loops trigger IRF3 signaling and apoptosis.
(a) Western blot of pIRF3 upon PlaB treatment (500 nM) in HeLa cells. GAPDH is the loading control. (b) Western blot showing knockdown efficiency of a second siRNA to BRCA1. GAPDH serves as the loading control. (c) Western blot showing pIRF3 levels upon knockdown of SETX or BRCA1 using a second siRNA in HeLa cells. (d) Effect of PlaB treatment (500 nM, 3 h) on pIRF3 in HCT116 cells. (e) Top: Schematic of nuclear localization signal (NLS)-tagged wild-type (WT) or catalytically-inactive (D210N) RNase H1. HBD = hybrid binding domain, CD = connection domain. Bottom: cellular localization of GFP-tagged NLS-RNaseH1 WT/D210N. Scale bar, 20 μm. (f) RT-qPCR measurements of IRF3 effectors upon knockdown of SETX or BRCA1 in MCF10A cells. (g) Western blot of pIRF3 after auxin-induced XPG degradation and SETX knockdown in HCT116 cells. GAPDH is the loading control. (h) Western blot showing C-PARP levels upon knockdown of SETX or BRCA1 in MCF10A cells. (i) Western blot showing the impact of auxin-induced XPG degradation on C-PARP in siSETX- or siBRCA1-treated HCT116 cells. The same GAPDH blot, which is the loading control, is used in Extended Data Fig. 1n. (j) Left: RT-qPCR showing the knockdown efficiency of TNFα in HeLa cells. Right: western blots showing levels of C-PARP upon knockdown of TNFα in siSETX-treated HeLa cells. (k) Western blot showing levels of pIRF3 upon knockdown of SETX or BRCA1 in BAX−/−BAK−/− HeLa cells. (l) Top: Schematic of nuclear export signal (NES)-tagged RNase HI. Bottom: cellular localization of GFP-tagged RNase HI-NES in HeLa cells. Scale bar, 20 μm. (m) CytoDRIP blot showing cytoplasmic hybrids upon knockdown of SETX or BRCA1 in mock-treated HeLa cells and HeLa cells stably expressing NES-tagged RNase HI. Bar graphs are mean ± s.d. from 3 independent biological replicates (n = 3) (unpaired two-tailed t-test with CI = 95%). P values are shown at the top of the graphs.
Extended Data Fig. 8
Extended Data Fig. 8. cGAS and TLR3 cooperate to activate IRF3 signaling
(a) Western blot showing pIRF3 levels upon siRNA-mediated knockdown of SETX and either RIG1 or MDA5 in HeLa cells. GAPDH is the loading control. (b) RT-qPCR showing the knockdown efficiency of RIGI and MDA5 in HeLa cells. (c) Western blot showing the knockdown efficiency of two different TLR3 siRNAs in HeLa cells. (d) RT-qPCR measurements of IRF3 effectors upon TLR3 knockdown with two different siRNAs in siSETX-treated BAX−/−BAK−/− HeLa cells. (e) and (f) Western blot showing levels of pIRF3 in two negative control (neg) clones and either cGAS knockout clones (e) or TLR3 knockout clones (f) generated using the CRISPR–Cas9 system in HeLa cells. c1 = clone 1, c2 = clone 2. GAPDH serves as the loading control. (g) RT-qPCR measurements of IRF3 effectors upon single or combined inhibition/knockdown of cGAS and TLR3 in control and siSETX-treated HeLa cells. (h) As in (g) but in BAX−/−BAK−/− HeLa cells. (i) Caspase 3 activity assay after knockdown of SETX and either XPG knockdown or the combination of cGAS inhibition and TLRs knockdown. (j) cGAS and TLR3 protein levels upon siRNA-mediated knockdown of TLR3 or cGAS in HeLa cells. (k) Agarose gel showing DNA (60 nt) and RNA (60 nt) oligonucleotides can anneal to form a DNA/RNA hybrid. (l) Gel shift assays of cGAS binding to double-stranded DNA (dsDNA) (left) and TLR3 binding to double-stranded RNA (dsRNA) (right). (m) Gel shift assays show binding of human RNaseH1 D210N catalytically-inactive mutant and GFP protein to RNA-DNA hybrids which are used as positive and negative controls, respectively. NP stands for no protein. Bar graphs are mean ± s.d.from three independent biological replicates (n = 3) (unpaired two-tailed t-test with CI = 95%). P values are shown at the top of the graphs.
Extended Data Fig. 9
Extended Data Fig. 9. cGAS and TLR3 bind directly to cytoplasmic RNA-DNA hybrids
(a) The purity of the cytoplasmic fraction used for the S9.6 co-IP was assessed by western blot. (b) S9.6 co-IP from the cytoplasmic fraction showing LysRS binds to cytoplasmic hybrids in our methods. LysRS has been reported to interact with cytoplasmic hybrids and serves as the positive control. (c) S9.6 co-IP from the cytoplasmic fraction showing cGAS and TLR3 associate with RNA-DNA hybrids isolated from siBRCA1-treated cells, as well as the impact of 37°C no enzyme mock control and in vitro RNase H treatment before the IP step. RNase H treatment, 50 U/ml for 1 h at 37°C. (d) S9.6 co-IP from cytoplasmic fraction showing cGAS binding to hybrids induced by siSETX is disrupted by 1 μM hybrid competitor in IP reaction, and TLR3 binding to hybrids is disrupted by 3 μM hybrid competitor in an IP reaction. hyb = hybrid. (e) Western blot validating the TLR3 IP efficiency in experiments to detect TLR3-associated cytoplasmic hybrids by performing TLR3 IP followed by S9.6 IP (Fig. 4h). (f) Western blot assessing the purity of the endolysosomal fraction after isolation following HA immunoprecipitation in control or SETX-depleted HA-TMEM192 HEK293T cells. Flag-TMEM192 HEK293T cells were used as a negative control for the LysoIP. Proteins marking the lysosome (Lyso), Golgi apparatus (Golgi), endoplasmic reticulum (ER) and mitochondria (Mito) are indicated. (g) Western blot showing pIRF3 and C-PARP levels induced by SETX knockdown in HA-TMEM192 HEK293T cells, as was observed in HeLa cells. This result suggests this cell line is suitable for the study of R-loop-induced immune activation. This experiment is a control for the LysoIP (Fig. 4i). (h) cytoDRIP blot showing cytoplasmic hybrids levels are elevated upon knockdown of SETX in HA-TMEM192 HEK293T cells. In vitro RNase H digestion was used to ensure IP specificity. This experiment is also a control for the LysoIP. (i) cytoDRIP blot showing cytoplasmic hybrids upon knockdown of SETX in HA-TMEM192 HEK293T cells with or without knockdown of XPG. (j) co-IP testing the interaction between Flag-tagged cGAS and endogenous TLR3. (k) co-IP testing the interaction between endogenous TLR3 and cGAS. (l) Working model. Left: in wild-type cells, nuclear R-loops are efficiently resolved by RNase H or RNA-DNA helicases, such as SETX. Only a small number of R-loops are processed by XPG and converted to cytoplasmic hybrids, so that cytoplasmic hybrid levels are below the threshold required for activation of IRF3 signaling. Right: under certain perturbations, including depletion of SETX/BRCA1, or under pathological conditions that deregulate R-loops, a subset of nuclear R-loops that may not be efficiently resolved are processed by XPG, leading to RNA-DNA hybrid accumulation in the cytoplasm. These hybrids are then recognized by cGAS and TLR3 in the cytosol and endolysosome, activating IRF3-mediated immune signaling and apoptosis.
Extended Data Fig. 10
Extended Data Fig. 10. R-loop-induced cytoplasmic RNA-DNA hybrid accumulation and innate immune activation in patient-derived disease cell models
(a) RT-qPCR showing the XPG siRNA knockdown efficiency in AOA2 patient-derived fibroblasts. (b) cytoDRIP blot showing cytoplasmic hybrids in CTRL and AOA2 patient-derived fibroblasts with or without knockdown of XPG. (c) cytoDRIP blot showing cytoplasmic hybrids in CTRL and AOA2 patient-derived fibroblasts with or without in vitro RNase H treatment prior to hybrid IP. (d) RT-qPCR showing the knockdown efficiency of TLR3 in AOA2 patient-derived fibroblasts. (e) RT-qPCR measurements of immune effectors upon single or combined inhibition and knockdown of cGAS and TLR3, respectively, in CTRL and AOA2 patient-derived fibroblasts. (f) RT-qPCR showing the SETX siRNA knockdown efficiency in CTRL fibroblasts. (g) RT-qPCR measurements of IFNβ and ISGs upon knockdown of SETX in CTRL fibroblasts. (h) Western blot showing the fractionation of UWB1.289 and UWB1.289+BRCA1 cells into soluble nuclear and cytoplasmic compartments with LaminB1 and GAPDH as markers, respectively. (i) cytoDRIP blot showing cytoplasmic hybrids in UWB1.289 and UWB1.289+BRCA1 cells with or without in vitro RNaseH treatment prior to hybrid IP. (j) Cellular localization of GFP-tagged NES-RNaseHI in UWB1.289 and UWB1.289+BRCA1 cells. Scale bar, 20 μm. (k) RT-qPCR measurements of immune effectors in UWB1.289 and UWB1.289+BRCA1 cells stably expressing GFP (mock) or NES-tagged RH (RH-NES). (l) RT-qPCR showing the SAMHD1 siRNA knockdown efficiency in HeLa cells. (m) cytoDRIP blot showing cytoplasmic hybrids in control and SAMHD1-deficient HeLa cells with or without in vitro RNase H treatment. (n) cytoDRIP blot showing cytoplasmic hybrids in control and SAMHD1-deficient HeLa cells with or without XPG knockdown. (o) Left: western blots showing levels of pIRF3 and C-PARP upon knockdown of XPG in siSAMHD1-treated HeLa cells. Right: western blots showing pIRF3 and C-PARP level upon knockdown of SAMHD1 in mock and RH-NES HeLa stable cell lines. siSAM = siSAMHD1. Bar graphs are mean ± s.d. from three independent biological replicates (n = 3) (unpaired, two-tailed t-test with CI = 95%). P values are shown at the top of the graphs.
Figure 1.
Figure 1.. Loss of R-loop resolution factors leads to XPG-dependent cytoplasmic RNA-DNA hybrid accumulation.
(a) Left: Images of SETX or BRCA1-depleted HeLa cells probed with GFP-dRH protein after fixation, following mock or RNase H (RH) pre-treatment. Scale bar is 10 μm. Right: quantification of cytoplasmic GFP-dRH intensities; p-values are shown in the figure; two-sided Mann Whitney U test: n-values from left to right: 463, 249, 397, 237, 286, 224. Center line, median; box limits, 75 and 25 percentiles, whiskers, min and max values. (b) Schematic of cytoDRIP experimental workflow. (c) Cytoplasmic RNA-DNA hybrids extracted from control (siCon) and siSETX-treated HeLa cells, with mock and RH treatment prior to pull-down. Size markers indicated in base pairs (bp). (d) As in (c) but for control and siBRCA1-treated cells. (e) As in (c) but with siXPG. (f) As in (e) but after BRCA1 knockdown. (g) Cytoplasmic hybrid levels in BAX−/−BAK−/− HeLa cells after treatment with siCon, siSETX or siBRCA1. (h) As in (g) with or without XPG knockdown. (i) Cytoplasmic hybrids extracted from asynchronous or serum-starved MCF10A cells following DMSO or PlaB treatment (500 nM, 3 h), with mock and RH treatment prior to pull-down. (j) Cytoplasmic (left) or soluble nuclear (right) hybrids from HeLa cells following a time course of PlaB, with mock and RH treatment prior to pull-down. (k) Cytoplasmic hybrids extracted from HeLa cells after PlaB treatment (500 nM, 3 h) and then washout for up to 24 h.
Figure 2.
Figure 2.. CytoDRIP-seq shows cytoplasmic RNA-DNA hybrids are derived from a subset of nuclear R-loops.
(a) Genomic tracks showing stranded signal (red = positive, blue = negative) for cytoDRIP-seq (IgG, siCon, siSETX), nuclear DRIP-seq and nuclear DRIP-seq + RH. Black bar shows peak. (b) CytoDRIP-seq workflow. (c) CytoDRIP-qPCR after depletion of SETX and/or XPG. P-values are shown in the figure, unpaired, two-tailed t-test. (d) Genomic distributions of peaks from cytoDRIP-seq (Cyto), nuclear DRIP-seq (Nuc) and genome values (Genome). Int: intergenic. P = 1.0e-16 between Cyto, Nuc, Genome, Kruskal-Wallis test. (e) Nuclear hybrid half-lives following transcription inhibition. Short, medium and long R-loop lifetimes were derived previously, P = 1.6e-7 between nuclear DRIP sites with short or medium lifetimes and cytoDRIP sites (two-sided Mann Whitney U test). (f) Nuclear hybrid half-lives following in vitro RH treatment. P = 2.3e-7 between nuclear DRIP and cytoDRIP sites (two-sided Mann Whitney U test). (g) Plots around siSETX cytoDRIP regions showing cytoDRIP-seq (left) and nuclear DRIP-seq (right) defined by transcription direction: sense-strand signal (blue), antisense-strand signal (red), IgG or input (grey). Mean of 1762 genic peaks (n = 1762). (h) Boxplot showing ratios of sense/antisense nuclear hybrid signal in siSETX cytoDRIP (Cyto, n = 984) and nuclear R-loop (Nuc, n = 30,446) peaks. P-value is shown; two-sided Mann Whitney U test. Center line, median; box limits, 75 and 25 percentiles, whiskers, min and max values. (i) Plots around siSETX cytoDRIP regions from (g) showing GC skew (blue) and AT skew (red). In c), e) and f): ‘Nuc+ Cyto+’ sites (blue) were found in the nucleus and cytoplasm, ‘Nuc+ Cyto−’ sites (red) only in the nucleus. Gene names are indicated; IG1/IG2 are intergenic sites. Shown is the mean ± s.d. from three biological replicates (n = 3). In g) and i) error bands show 95% CI of the mean.
Figure 3.
Figure 3.. Cytoplasmic RNA-DNA hybrids derived from R-loop processing activate IRF3 signaling and induce apoptosis
(a) Western blot of pIRF3 upon expression of empty vector, human NLS-tagged RNase H1 (RH), or NLS-tagged RNase H1 catalytically-dead mutant D210N (dRH) in SETX- and BRCA1-deficient HeLa cells. GAPDH is the loading control. (b) RT-qPCR measurements of IRF3 effectors upon knockdown of SETX and overexpression of RNase H in HeLa cells. (c) As in (a) with XPG or XPF knockdown in HeLa cells. (d) As in (b) with XPG knockdown in HeLa cells. (e) pIRF3 levels upon knockdown of SETX or BRCA1 with IAA treatment to induce XPG degradation in HeLa AID-tagged XPG degron cells. (f) Caspase 3 activity after depletion of either SETX or BRCA1 in HeLa cells. (g) Western blots of cleaved PARP (C-PARP) upon depletion of XPG or XPF in siSETX- or siBRCA1-treated HeLa cells. GAPDH serves as the loading control. (h) As in (g) upon expression of empty vector, RH or dRH in HeLa cells. (i) RT-qPCR measurements of IRF3 effectors upon knockdown of SETX and XPG or XPF in BAX−/−BAK−/− HeLa cells. (j) Western blots of pIRF3 and C-PARP upon knockdown of SETX or BRCA1 in HeLa cells stably expressing GFP (Mock) or NES-tagged RH (RH-NES). (k) RT-qPCR measurements of IRF3 effectors in mock and RH-NES HeLa stable cell lines upon SETX knockdown. All bar graphs represent the mean ± s.d., n = 3 independent biological replicates (two-tailed t-test with CI = 95%). P values are shown at the top of the graphs.
Figure 4.
Figure 4.. R-loop-derived cytoplasmic RNA-DNA hybrids trigger IRF3 signaling via the cGAS and TLR3 receptors.
(a) Dependence of SETX knockdown-induced pIRF3 level on cGAS or TLR3 in HeLa cells. (b) RT-qPCR measurements of IRF3 effectors upon knockdown of SETX and TLR3 and cGASi treatment in HeLa cells. (c) Western blots of C-PARP upon perturbation of immune receptors in SETX- or BRCA1-depleted HeLa cells. (d) Western blot of pIRF3 upon TLR3 or cGAS loss after synthetic RNA:DNA hybrid transfection. (e) Gel shift assay showing in vitro binding of cGAS and TLR3 to RNA-DNA hybrids. NP: no protein. (f) In vitro pull-down assay showing hybrid binding activity of purified cGAS and TLR3. dRH and GFP are positive and negative controls respectively. (g) Coimmunoprecipitation of cGAS or TLR3 with cytoplasmic hybrids upon knockdown of SETX or BRCA1, with or without XPG knockdown. (h) cytoDRIP blot of TLR3-associated hybrids in the cytoplasm of control and SETX-depleted HeLa cells, with mock and RH treatment prior to hybrid pull-down. dsDNA markers are indicated in bp. (i) LysoIP blot shows RNA-DNA hybrid levels in the endolysosome of control and SETX-depleted HA-TMEM192 HEK293T cells, with or without RH treatment prior to hybrid pull-down. Flag-TMEM192 HEK293T cells: mock control. (j) RT-qPCR measurements of IFNβ and ISGs in CTRL and AOA2 fibroblasts upon knockdown of XPG. (k) As in (j) upon cGAS inhibition and TLR3 knockdown. (l) cytoDRIP blot showing cytoplasmic hybrid production upon XPG knockdown in UWB1.289 and UWB1.289+BRCA1 cells. (m) Western blot of pIRF3 and C-PARP in UWB1.289 and UWB1.289+BRCA1 cells stably expressing GFP (mock) and RH-NES. Bar graphs represent the mean ± s.d. n = 3 independent biological replicates (two-tailed t-test with CI = 95%). P values are shown at the top of the graphs.

References

    1. Crossley MP, Bocek M & Cimprich KA R-Loops as Cellular Regulators and Genomic Threats. Mol. Cell 73, 398–411 (2019). - PMC - PubMed
    1. Sollier J et al. Transcription-coupled nucleotide excision repair factors promote R-loop-induced genome instability. Mol. Cell 56, 777–785 (2014). - PMC - PubMed
    1. Makharashvili N et al. Sae2/CtIP prevents R-loop accumulation in eukaryotic cells. Elife 7, (2018). - PMC - PubMed
    1. Cristini A et al. Dual Processing of R-Loops and Topoisomerase I Induces Transcription-Dependent DNA Double-Strand Breaks. Cell Rep. 28, 3167–3181.e6 (2019). - PMC - PubMed
    1. Santos-Pereira JM & Aguilera A R loops: new modulators of genome dynamics and function. Nat. Rev. Genet. 16, 583–597 (2015). - PubMed

REFERENCES FOR METHODS

    1. Bai G et al. HLTF Promotes Fork Reversal, Limiting Replication Stress Resistance and Preventing Multiple Mechanisms of Unrestrained DNA Synthesis. Mol. Cell 78, 1237–1251.e7 (2020). - PMC - PubMed
    1. Choi J-H, Kim S-Y, Kim S-K, Kemp MG & Sancar A An Integrated Approach for Analysis of the DNA Damage Response in Mammalian Cells: NUCLEOTIDE EXCISION REPAIR, DNA DAMAGE CHECKPOINT, AND APOPTOSIS. J. Biol. Chem. 290, 28812–28821 (2015). - PMC - PubMed
    1. Long HK et al. Loss of Extreme Long-Range Enhancers in Human Neural Crest Drives a Craniofacial Disorder. Cell Stem Cell 27, 765–783.e14 (2020). - PMC - PubMed
    1. Guerra J et al. Lysyl-tRNA synthetase produces diadenosine tetraphosphate to curb STING-dependent inflammation. Sci Adv 6, eaax3333 (2020). - PMC - PubMed
    1. Cristini A, Groh M, Kristiansen MS & Gromak N RNA/DNA Hybrid Interactome Identifies DXH9 as a Molecular Player in Transcriptional Termination and R-Loop-Associated DNA Damage. Cell Rep. 23, 1891–1905 (2018). - PMC - PubMed

Publication types

MeSH terms