. 2023 Jan;613(7942):111-119.
doi: 10.1038/s41586-022-05553-9. Epub 2022 Dec 21.

A cortico-collicular circuit for orienting to shelter during escape

Affiliations

A cortico-collicular circuit for orienting to shelter during escape

Dario Campagner et al. Nature. 2023 Jan.

Abstract

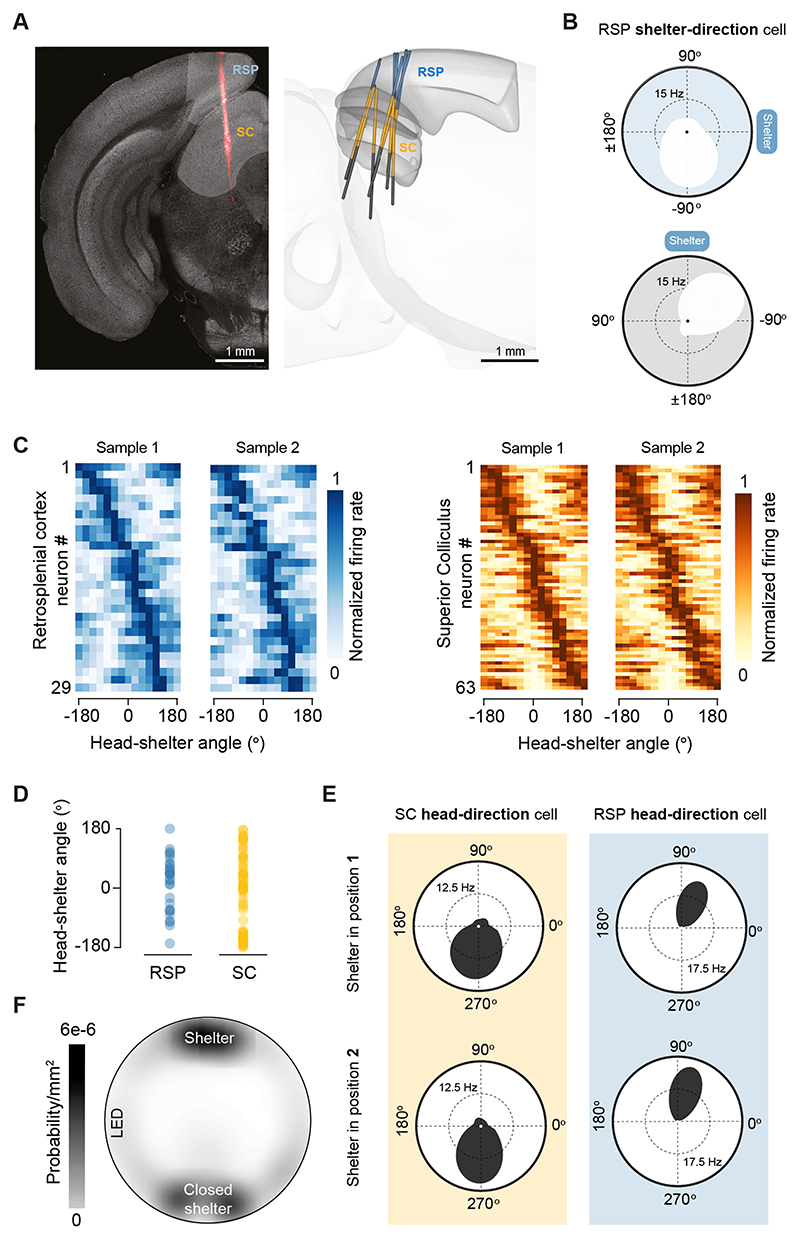
When faced with predatory threats, escape towards shelter is an adaptive action that offers long-term protection against the attacker. Animals rely on knowledge of safe locations in the environment to instinctively execute rapid shelter-directed escape actions1,2. Although previous work has identified neural mechanisms of escape initiation3,4, it is not known how the escape circuit incorporates spatial information to execute rapid flights along the most efficient route to shelter. Here we show that the mouse retrosplenial cortex (RSP) and superior colliculus (SC) form a circuit that encodes the shelter-direction vector and is specifically required for accurately orienting to shelter during escape. Shelter direction is encoded in RSP and SC neurons in egocentric coordinates and SC shelter-direction tuning depends on RSP activity. Inactivation of the RSP-SC pathway disrupts the orientation to shelter and causes escapes away from the optimal shelter-directed route, but does not lead to generic deficits in orientation or spatial navigation. We find that the RSP and SC are monosynaptically connected and form a feedforward lateral inhibition microcircuit that strongly drives the inhibitory collicular network because of higher RSP input convergence and synaptic integration efficiency in inhibitory SC neurons. This results in broad shelter-direction tuning in inhibitory SC neurons and sharply tuned excitatory SC neurons. These findings are recapitulated by a biologically constrained spiking network model in which RSP input to the local SC recurrent ring architecture generates a circular shelter-direction map. We propose that this RSP-SC circuit might be specialized for generating collicular representations of memorized spatial goals that are readily accessible to the motor system during escape, or more broadly, during navigation when the goal must be reached as fast as possible.


Conflict of interest statement

Competing interests

The authors declare no competing interests.

Figures

Extended Data Figure 1
Extended Data Figure 1. Single unit recordings of shelter-direction and head-direction cells
(A) Left: Coronal image of post-recording histology showing the track of the neuropixels probe (red). Right: 3D rendering of probe tracks in all chronically implanted mice (B) Example tuning curves for a shelter-direction neuron in the RSP before and after shelter rotation. (C) Tuning curves for non-overlapping subsets of data generated by random sampling. For RSP and SC, the plot on the left is sorted by tuning peak, and the sorting indexes have been used to sort the plot on the right. (D) Summary plot of preferred tuning angle for RSP and SC shelter-direction neurons. (E) Example tuning curves for allocentric head-direction neurons in the SC and RSP. We recorded 2% head-direction cells in the SC, and 6% in the RSP. (F) Summary plot showing the occupancy of the arena during exploratory behaviour in the presence of a second, closed shelter.
Extended Data Figure 2
Extended Data Figure 2. Tuning entanglement decoupling analysis
(A) Left, plot illustrating a driver variable (v1) and a correlated passenger variable (v2; Pearson’s correlation coefficient = 0.45). v1 samples are drawn from a normal distribution of mean 0 and standard deviation 1. The jth sample of v2 is computed as v_2j=0.5* v_lj+ε_j, where each ε_j is drawn from a second normal distribution with mean 0 and standard deviation 1. Right, v1 is used to simulate the spiking of a neuron such that the probability of firing is equal to 0.1 * v1 if vl>l and 0 if vl≤l. TunED analysis was then applied to vl, v2 and simulated spiking data as described in Methods to compute observed and expected tuning curves to v1 and v2. The method correctly identifies v1 as the driver variable. The observed tuning curve to the passenger variable v2 (dark yellow) can be fully explained by the tuning to the driver variable (brown). In contrast, the observed tuning to driver variable (dark blue), cannot be explained by the tuning to the passenger variable (light blue). (B) Left, schematic of head-shelter angle and head direction variables during the experiment. Right, correlation between head-shelter angle and head direction in our experimental setting plotted for eight values of head direction for each grid location. (C) Left, tuning curves of neurons for which the driver variable was head direction (top) or head-shelter angle (bottom). Right, illustration of the statistical method used to determine whether the driver variable of the neuron was head shelter offset, head direction or none of them (see Methods for details). Briefly, the distribution of dHSA - dHD (dark grey histogram) indicates whether the expected and observed tuning curves are more similar for head-shelter angle or for head direction. If the dHSA - dHD distribution is significantly smaller than zero (both 2.5th and 97.5th percentile <0, vertical dotted lines) the cell is classified as a head direction cell; if the distribution of dHSA - dHD is significantly larger than zero (both 2.5th and 97.5th percentile > 0) the cell is classified as a head-shelter angle cell; otherwise the cell is not considered a shelter-direction nor head direction cell.
Extended Data Figure 3
Extended Data Figure 3. Histology for loss-of-function of SC-projecting RSP neurons
3D rendering of the location of SC-projecting RSP neurons expressing hM4Di for the mice in the following datasets: escape behaviour assay, orientation to sound assay, food-seeking assay, single unit recordings during chemogenetic inactivation. For an example coronal section see Fig. 2A.
Extended Data Figure 4
Extended Data Figure 4. RSP loss-of-function does not affect average SC firing rates
(A) Population histograms for firing rate of SC single units after saline and CNO i.p. injection in animals expressing hM4Di in SC-projecting RSP neurons P=0.75 one-tailed Kolmogorov-Smirnov test; N=264 units, 2 mice.
Extended Data Figure 5
Extended Data Figure 5. Shelter orientation error does not depend on the environment luminance level
Shelter orientation error increases both during light and dark conditions upon inactivation of SC-projecting RSP neurons, in comparison to saline control (Dark: P=0.0302 permutation test; saline: 5 mice, 24 trials; CNO: 11, mice 58 trials. Light: P=0.038 permutation test; saline: 6 mice 27 trials; CNO: 9 mice 47 trials). No significant differences were observed between saline in light and dark condition (P=0.46 permutation test) or CNO in light and dark condition (P=0.26 permutation test).
Extended Data Figure 6
Extended Data Figure 6. Additional analysis of the effect of RSP-SC loss-of-function on behaviour
(A-F) Navigation during exploratory behaviour is not affected by inactivation of SC-projecting RSP neurons. Panels show quantification of exploratory behaviour during the time period preceding the presentation of the first threatening stimulus for saline control (black, N=6) and CNO (blue, N=11) mice, expressing hM4Di in SC-projecting RSP neurons. None of the metrics differs between the two groups (P>0.15 for all metrics, 2-tailed Mann-Whitney test). (A) Latency between the beginning of the experiment and the first time the mouse entered in the shelter. (B) Number of times the mouse entered in the shelter. (C) Percentage of time the mouse spent outside the shelter. (D) Total length of the path travelled while outside the shelter. (E) Percentage of the arena surface explored while outside the shelter. (F) Average and 95th percentile of mouse locomotion speed while outside the shelter. The duration of the time period preceding the presentation of the first threatening stimulus did not differ between saline control and CNO groups (P=0.51, 2 tailed Mann-Whitney test). (G) Average change in speed after threat presentation for saline contrl (black) and CNO (blue) showing that both groups of mice initiate escape with similar vigour. (H) Summary data for time to reach the shelter after escape initiation. (I) Length of flight after escape initiation as a function of orientation error, showing that larger errors are associated with shorter flights. (Fitted function: Boltzmann sigmoidal equation; slope -5.5, P=0.02; F-statistic goodness of fit test against constant model, P<0.0001). Shaded area: 95% confidence interval. Distance is normalised to the distance to shelter at escape onset.
Extended Data Figure 7
Extended Data Figure 7. Histology for cortical loss-of-function
Coronal sections and 3D renderings showing neurons targeted with hM4Di expression in the entire RSP (A), posterior parietal cortex (B) and anterior motor areas (C). D shows fluorescently-labelled muscimol targeted to the RSP. White circles represent infusion cannulae location.
Extended Data Figure 8
Extended Data Figure 8. Additional cortical inputs onto SC neurons
Coronal images of monosynaptic rabies tracing from starter SC cells in excitatory (vGluT2+) and inhibitory (vGAT+) neuron populations, showing prominent inputs from the posterior parietal cortex (A), M2 (B) and anterior cingulate cortex (C).
Extended Data Figure 9
Extended Data Figure 9. Histology for projection-specific RSP-SC loss-of-function
Coronal sections and 3D renderings showing guide, internal cannulae locations (white dotted lines and white circles) implanted in the superior colliculus (SC; A) and anterior cingulate cortex (ACC; B). Insets and blue shades in the right panels show SC-projecting RSP neurons of the respective mouse, expressing hM4Di. Inset in B (top-right) shows the axon collaterals to ACC of SC-projecting RSP neurons.
Extended Data Figure 10
Extended Data Figure 10. Quantification of head-displacement prediction and orientation to sound performance
(A) Cross validated confusion matrix for LDA population decoding of the angle of future head displacement (100 ms ahead) from SC firing rates (prediction accuracy: 0.78). (B) Summary data showing that mice orient accurately to sound (with no biases for left or right speaker and for left or right turns; P=0.27 and P=0.33 respectively, permutation test; N=36, 6 mice), with short latencies (C, left) and fast movements (C, right). (D) Summary data showing that mice are equally accurate when orienting to sound or to shelter (P=0.82 permutation test; orientation to sound N=36, 6 mice; orientation to shelter N=32, 5 mice). (E) Orientation to sound accuracy does not depend on the distance at sound onset between the mouse and the speaker (slope = -0.012, P=0.48, linear regression).
Extended Data Figure 11
Extended Data Figure 11. Principal components of SC population dynamics during RSP activation
Principal component 1 and 2 of SC vGAT+ and SC vGluT2+ neurons during cortical activation (same data as Fig. 4B). The first two principal component are sufficient to explain most of the variance present in the data (84%) and closely resemble the temporal dynamics observed for SC vGAT+ and SC VGluT2+ neurons.
Extended Data Figure 12
Extended Data Figure 12. Biophysical properties of SC neurons receiving RSP input
(A) Summary curves for action potential firing from somatic current injection. (B) Summary data for short-term plasticity of RSP inputs onto SC neurons.
Extended Data Figure 13
Extended Data Figure 13. Elements of the lateral feedforward inhibition and ring attractor models
(A) Real and simulated synaptic currents or potentials for all synaptic connections in the model. (B) Additional circuit elements of the feedforward lateral inhibition model (c.f. Figure 5D). (C) Left: Circuits element of the standard ring attractor model. Right: predicted firing rate of vGluT2+ and vGAT+ SC populations following 20 Hz activation of RSP neurons in the model, compared to observed dynamics (dashed lines, see also in Fig. 4B).
Extended Data Figure 14
Extended Data Figure 14. 3D reconstruction of viral injection and fiber placement of dual opsin-assisted circuit mapping and optotagging
3D rendering of the location of ChrimsonR expressing neurons in the entire RSP (blue), ChR2-expressing SC vGluT2+ and vGAT+ neurons (yellow), and optic fibers (white cylinders) used in the freely moving and head-fixed dual-opsin and optotagging experiments. For an example coronal section see Fig. 4A.
Figure 1
Figure 1. RSP and SC neurons encode egocentric shelter direction
(A) Left, superimposed video frames showing orientation to shelter after a threat stimulus and subsequent shelter-directed escape (yellow line shows flight trajectory); inset illustrates measurement of egocentric shelter direction (defined as the head-shelter angle). Right, video frame sequence detailing the decrease in head-shelter angle at escape initiation (yellow arrows: head direction, white shade: head-shelter angle). (B) Left, video frames with escape trajectories (yellow lines) to initial shelter position (top, position 1) and after rotation (bottom, position 2). Centre, tuning curves for a single SC unit, showing a rotation of the firing field that follows the rotation of the shelter position. Other explicit landmarks remain in place (LED and visual cue). Right, sample raster plot and tuning curve for the same neuron. (C) Tuning curves for shelter-direction RSP and SC units for the shelter in position 1. Curves sorted by tuning peak. (D) Distribution of change in the Rayleigh vector direction after rotating the shelter by 90° (position 1 to position 2). (E) Schematic of flight termination probability across the arena and percentage of units tuned to each of the shelters and the LED landmarks (circle area is proportional to percentage).(F) Example GLM data for a SC neuron showing the evolution of recorded firing rate (top-left) and head-shelter angle (bottom-left), together with the full model fit (cross validated prediction accuracy: 50±3%) and the same model without the head-shelter angle variable. Bottom right shows the tuning curve recovered from the full model fit (yellow symbols) and the recorded curve (gray). (G) Cross-validated confusion matrices for LDA population decoding of head-shelter angle.
Figure 2
Figure 2. Shelter-direction tuning in SC and orientation to shelter during escape depend on RSP input
(A) Schematic of retrograde AAV strategy for inactivating SC-projecting RSP neurons, and coronal image of targeted RSP neurons. (B) Sample raster plot of an RSP shelter-direction cell before and after i.p. CNO. (C) Population histograms showing a decrease in firing rate in RSP neurons after i.p. CNO. (D) Example tuning curves and sample raster plots showing loss of tuning in an SC shelter-direction neuron after i.p. CNO. (E) Cross-validated confusion matrix for LDA population decoding of head-shelter angle in SC after RSP inactivation. (F) Example video frames as in Fig. 1A showing escape initiation in the wrong direction due to incorrect orientation. (G) Summary plot of orientation errors at escape initiation after i.p. CNO. Light shaded area is 5-95 percentile range; dark bar is IQR and white line shows median. (H) Summary plot for location of flights terminated outside the shelter(CNO: 29.5%, saline: 3.9%). (I) Example coronal image of RSP axon terminals in the SC and schematic for local inactivation of these terminals. (J) Orientation errors as in G for local CNO infusion over SC (54 CNO trials and 37 saline trials from 6 mice; P=0.0032 permutation test). (K) Summary of activity manipulation effects on orientation errors. (Global RSP: 57 CNO trials and 32 saline trials from 5 mice, P=0.004; Muscimol: 21 drug trials from 6 mice and 25 saline trials from 3 mice, P=0.0061; PPC: 31 CNO trials and 22 saline trials from 3 mice, P=0.6514; AMA: 31 CNO trials from 4 mice and 28 saline trials from 3 mice P=0.1003; RSP to ACC: 21 CNO trials and 21 saline trials from 5 mice, P=0.8282;permutation test). Data are normalized by dividing each inactivation trial error by the median of orientation error of the respective control dataset.
Figure 3
Figure 3. Orientation and navigation errors after RSP-SC inactivation are specific to escape behaviour
(A) Tuning curve and sample raster plot for an SC neuron tuned to egocentric head displacement. (B) Example video frames showing instinctive orientation to a sound source, an SC-dependent behaviour. (C) Change in LDA prediction accuracy of head displacement from SC firing rates (% change in CNO - % change in saline). (D) Summary data showing no effect of inactivation of SC-projecting RSP neurons in the sound-orienting assay but increased shelter orientation errors for the same mice (P=0.0143 permutation test; 32 CNO trials and 42 saline trials). Data are normalized by dividing each CNO trial error by the median of orientation error of the respective control dataset. (E) Task schematic (top) and example video frames showing curved trajectory and slow orientation towards lick port during a learned, non-urgent goal navigation task. (F) Summary data showing that mice learned the task rules (top left) and that the behaviour is not affected by inactivation of SC-projecting RSP neurons - lick probability, time to lick port, trajectory tortuosity and errors in orientation to lick port are the same for saline control and CNO trials. This contrasts with the increased shelter orientation errors during escape measured in the same mice. Note that time to goal and path tortuosity are different between navigation during escape and food-seeking. *: P<0.05.
Figure 4
Figure 4. RSP synaptic input has a diverging effect on SC vGAT+ and vGluT2+ neurons
(A) Schematic of dual opsin strategy for recording dynamics of the SC network following RSP input in head-fixed mice (inset) and coronal image of the targeted RSP and SC neurons with trajectories of acutely inserted Neuropixels probes (left). Right, 3D rendering of probe trajectories in all mice. (B) Normalised firing rate of vGluT2+ (32 neurons) and vGAT+ (68 neurons) SC populations during 20 Hz activation of RSP axons in SC in vivo. Both SC populations are initially activated but diverge in firing profile over the course of stimulation. (C) Example synaptic currents and potentials evoked by 20 Hz optogenetic stimulation of RSP inputs onto excitatory and inhibitory SC neurons in vitro (blue circles indicate stimulation times). Left insets show voltage response to step current injections. (D) Summary plot of summation during 20 Hz optogenetic activation of RSP inputs (vGAT+: slope=17.6%, P=5.2e-13; VGluT2+: slope=- 2.9%, P=0.16, linear regression). (E) Left, coronal images (top) and 3D reconstruction (bottom) of vGluT2+ or vGAT+ starter cells in SC. Cells expressing helper AAVs are shown in yellow, rabies-infected cells in blue, and starter cells in white (inset). White arrows point to example starter cells. Right, coronal image (top) and 3D reconstruction (bottom) showing labelled input areas to excitatory and inhibitory SC neurons, including the RSP (inset). (F) Top, number of RSP labelled cells as a function of the number of SC starter cells, showing higher convergence of RSP input onto inhibitory SC cells for any given number of starter cells (each dot is data from one mouse). Logarithmic fit P-values: 0.0017 vGluT2+ and 1.7e-5 vGAT+. Shaded area represent 95% confidence interval. Note that the confidence intervals for vGluT2+ and vGAT+ never overlap. Bottom, cell type-specific convergence index for RSP, AMA and PPC, showing that the higher convergence onto SC inhibitory neurons is specific to RSP inputs and that AMA and PPC have lower convergence onto SC neurons overall. Starter cells were observed in all the three RSP subdivisions: RSP ventral part (RSPv), RSP dorsal part (RSPd) and RSP lateral agranular part (RSPa).
Figure 5
Figure 5. A feedforward lateral inhibition model for mapping shelter direction from RSP to SC
(A) Schematic of the anterograde dual opsin strategy used to test for feedforward lateral inhibition in vitro. (B) Coronal image of RSP-receiving vGAT+ cells expressing ChR2. (C) Activation of RSP-receiving vGAT+ SC cells generates inhibitory synaptic currents in vGAT- SC cells (right) that also receive monosynaptic RSP input (left). (D) Top: Schematic illustrating the ring architecture and connectivity profiles for the different components of the feedforward lateral inhibition model (RSP, vGluT2+ SC and vGAT+ SC networks). Neurons are shown organized in a circular fashion with respect to their shelter tuning preference. Colour intensity of circles indicates neuronal firing rate, colour intensity of lines indicates projection strength. From left to right: RSP population firing when the mouse faces -90° from the shelter, RSP projections to vGluT2+ SC and vGAT+ SC (only projections from the RSP neuron turned to -90° are shown), local recurrent excitation and lateral inhibition within SC. RSP neurons excite a small number of recurrently connected SC vGluT2+ neurons, which inherit the same tuning, while exciting all other SC vGAT+ neurons that then project to orthogonal vGluT2+ SC neurons. Activity in a given RSP neuron results in feedforward lateral inhibition of all SC vGluT2+ neurons with a different shelter direction preference. Additional circuit elements are shown in Extended Data Fig 13. Bottom: tuning curves schematics for a RSP neuron tuned to -90° and for the vGluT2+ and vGAT+ SC neurons most strongly excited by the RSP neuron shown. (E) Left: mean and 95% confidence interval of predicted firing rate of vGluT2+ and vGAT+ SC populations following 20 Hz activation of RSP neurons in the best 30 models fitted to the data, compared to the dynamics recorded in vivo (dashed lines, same as 4B). Right: example predicted tuning curves for vGluT2+ and vGAT+ SC neurons (top). The model predicts that vGluT2+ SC neurons are more sharply tuned to shelter direction than vGAT+ SC neurons (bottom). (F) Experimentally measured tuning curves of opto-tagged vGluT2+ and vGAT+ SC neurons and Rayleigh vectors lengths for the population of recorded neurons

References

    1. Domenici P, Blagburn JM, Bacon JP. Animal escapology I: Theoretical issues and emerging trends in escape trajectories. Journal of Experimental Biology. 2011;214:2463–2473. doi: 10.1242/jeb.029652. - DOI - PMC - PubMed
    1. Vale R, Evans DA, Branco T. Rapid Spatial Learning Controls Instinctive Defensive Behavior in Mice. Current Biology. 2017;27:1342–1349. - PMC - PubMed
    1. Branco T, Redgrave P. The Neural Basis of Escape Behavior in Vertebrates. Annu Rev Neurosci. 2020 doi: 10.1146/annurev-neuro-100219-122527. - DOI - PubMed
    1. Tovote P, Fadok JP, Lüthi A. Neuronal circuits for fear and anxiety. Nature Reviews Neuroscience. 2015;16:317–331. doi: 10.1038/nrn3945. - DOI - PubMed
    1. van der Meer MAA, Richmond Z, Braga RM, Wood ER, Dudchenko PA. Evidence for the Use of an Internal Sense of Direction in Homing. Behavioral Neuroscience. 2010;124:164–169. - PubMed

Publication types