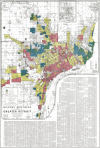
Linking environmental injustices in Detroit, MI to institutional racial segregation through historical federal redlining
- PMID: 36544051
- PMCID: PMC11222141
- DOI: 10.1038/s41370-022-00512-y
Linking environmental injustices in Detroit, MI to institutional racial segregation through historical federal redlining
Abstract
Objectives: To identify the most pervasive environmental exposures driving environmental disparities today associated with historical redlining in Detroit.
Methods: We overlaid Detroit's 1939 Home Owners' Loan Corporation (HOLC) shapefile from the Mapping Inequality project onto the EPA EJScreen and the DOT National Transportation Noise maps to analyze differences in current demographic and environmental indicators between historically redlined (D-grade) and non-redlined neighborhoods using simple linear regression and a boosted classification tree algorithm.
Results: Historically redlined neighborhoods in Detroit experienced significantly higher environmental hazards than non-redlined neighborhoods in the form of 12.1% (95% CI: 7.2-17.1%) higher levels of diesel particulate matter (PM), 32.2% (95% CI: 3.3-69.3%) larger traffic volumes, and 65.7% (95% CI: 8.6-152.8%) higher exposure to hazardous road noise (LEQ(24h) >70 dBA). Historically redlined neighborhoods were situated near 1.7-times (95% CI: 1.4-2.1) more hazardous waste sites and twice as many (95% CI: 1.5-2.7) risk management plan (RMP) sites than non-redlined neighborhoods. The lifetime cancer risk from inhalation of air toxics was 4.4% (95% CI: 2.9-6.6%) higher in historically redlined communities, and the risk of adverse respiratory health outcomes from air toxics was 3.9% (95% CI: 2.1-5.6%) higher. All factors considered together, among the environmental hazards considered, the most pervasive hazards in historically redlined communities are proximity to RMP sites, hazardous road noise, diesel PM, and cancer risk from air pollution.
Conclusions: Historically redlined neighborhoods may have a disproportionately higher risk of developing cancer and adverse respiratory health outcomes from air toxics. Policies targeting air and noise pollution from transportation sources, particularly from sources of diesel exhaust, in historically redlined neighborhoods may ameliorate some of the impacts of structural environmental racism from historical redlining in Detroit.
Keywords: Air pollution; EJSCREEN; Environmental justice; Noise; Redlining; Structural racism.
© 2022. The Author(s).
Conflict of interest statement
The authors declare no competing interests.
Figures


Similar articles
-
Race, historical redlining, and contemporary transportation noise disparities in the United States.J Expo Sci Environ Epidemiol. 2025 Jan;35(1):50-61. doi: 10.1038/s41370-024-00682-x. Epub 2024 May 17. J Expo Sci Environ Epidemiol. 2025. PMID: 38760532
-
The effects of the historical practice of residential redlining in the United States on recent temporal trends of air pollution near New York City schools.Environ Int. 2022 Nov;169:107551. doi: 10.1016/j.envint.2022.107551. Epub 2022 Sep 27. Environ Int. 2022. PMID: 36183489 Free PMC article.
-
Structural Racism, Historical Redlining, and Incidence of Kidney Failure in US Cities, 2012-2019.J Am Soc Nephrol. 2023 Sep 1;34(9):1493-1503. doi: 10.1681/ASN.0000000000000165. Epub 2023 Jun 12. J Am Soc Nephrol. 2023. PMID: 37303086 Free PMC article.
-
The Relationship of Historical Redlining with Present-Day Neighborhood Environmental and Health Outcomes: A Scoping Review and Conceptual Model.J Urban Health. 2022 Dec;99(6):959-983. doi: 10.1007/s11524-022-00665-z. Epub 2022 Aug 1. J Urban Health. 2022. PMID: 35915192 Free PMC article.
-
Environmental Racism and Child Health.Acad Pediatr. 2024 Sep-Oct;24(7S):S167-S172. doi: 10.1016/j.acap.2023.09.016. Acad Pediatr. 2024. PMID: 39428149 Review.
Cited by
-
Advancing environmental epidemiologic methods to confront the cancer burden.Am J Epidemiol. 2025 Jan 8;194(1):195-207. doi: 10.1093/aje/kwae175. Am J Epidemiol. 2025. PMID: 39030715 Free PMC article.
-
Restoring landscapes and communities: Insights from critical, urban, and plant ecology.Environ Sci Ecotechnol. 2025 Jul 12;27:100601. doi: 10.1016/j.ese.2025.100601. eCollection 2025 Sep. Environ Sci Ecotechnol. 2025. PMID: 40799361 Free PMC article. Review.
-
Assessing justice in California's transition to electric vehicles.iScience. 2023 May 12;26(7):106856. doi: 10.1016/j.isci.2023.106856. eCollection 2023 Jul 21. iScience. 2023. PMID: 37534146 Free PMC article.
-
Socioeconomic and sociodemographic correlations to COVID-19 variability in the United States in 2020.Front Public Health. 2024 Jun 11;12:1359192. doi: 10.3389/fpubh.2024.1359192. eCollection 2024. Front Public Health. 2024. PMID: 38919927 Free PMC article.
-
Structural racism, air pollution and the association with adverse birth outcomes in the United States: the value of examining intergenerational associations.Front Epidemiol. 2023 Jun 22;3:1190407. doi: 10.3389/fepid.2023.1190407. eCollection 2023. Front Epidemiol. 2023. PMID: 38455927 Free PMC article. Review.
References
-
- Fishback P, Rose J, Snowden K. Well worth saving: how the new deal safeguarded home ownership. Chicago: University of Chicago Press; 2013.
-
- FHA. Underwriting manual. Washington D.C.: Federal Housing Administration; 1936.
-
- Greer J. The Home Owners’ Loan Corporation and the Development of the Residential Security Maps. J Urban Hist. 2013;39:275–96. doi: 10.1177/0096144212436724. - DOI
-
- An B, Orlando AW, Rodnyansky S. The physical legacy of racism: how redlining cemented the modern built environment. SSRN Electron J. 2019. https://www.ssrn.com/abstract=3500612.
-
- Stuart G. Discriminating risk: the U.S. mortgage lending industry in the twentieth century. Ithaca: Cornell University Press; 2003.
MeSH terms
Substances
LinkOut - more resources
Full Text Sources
Research Materials

