. 2022 Dec;11(12):e12295.
doi: 10.1002/jev2.12295.

Retinal pigment epithelium extracellular vesicles are potent inducers of age-related macular degeneration disease phenotype in the outer retina

Affiliations

Retinal pigment epithelium extracellular vesicles are potent inducers of age-related macular degeneration disease phenotype in the outer retina

Marzena Kurzawa-Akanbi et al. J Extracell Vesicles. 2022 Dec.

Abstract

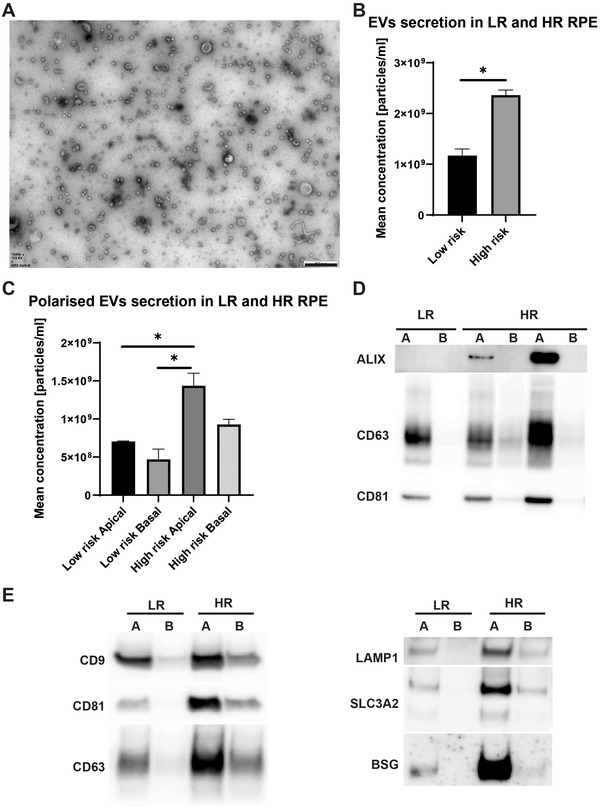
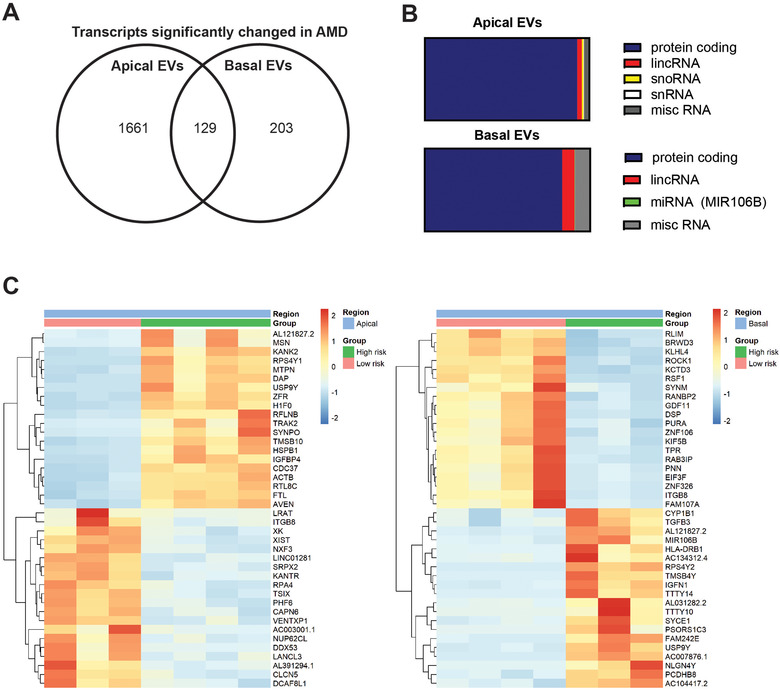
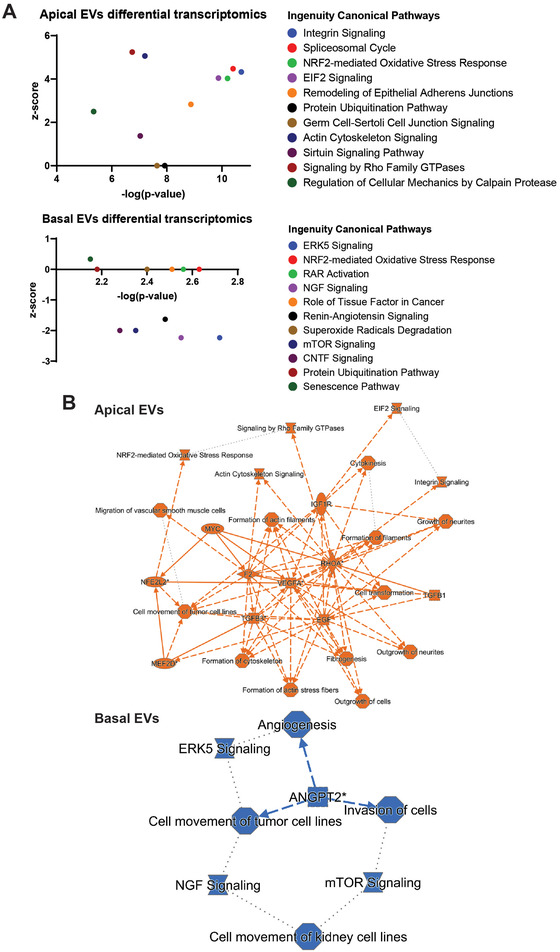
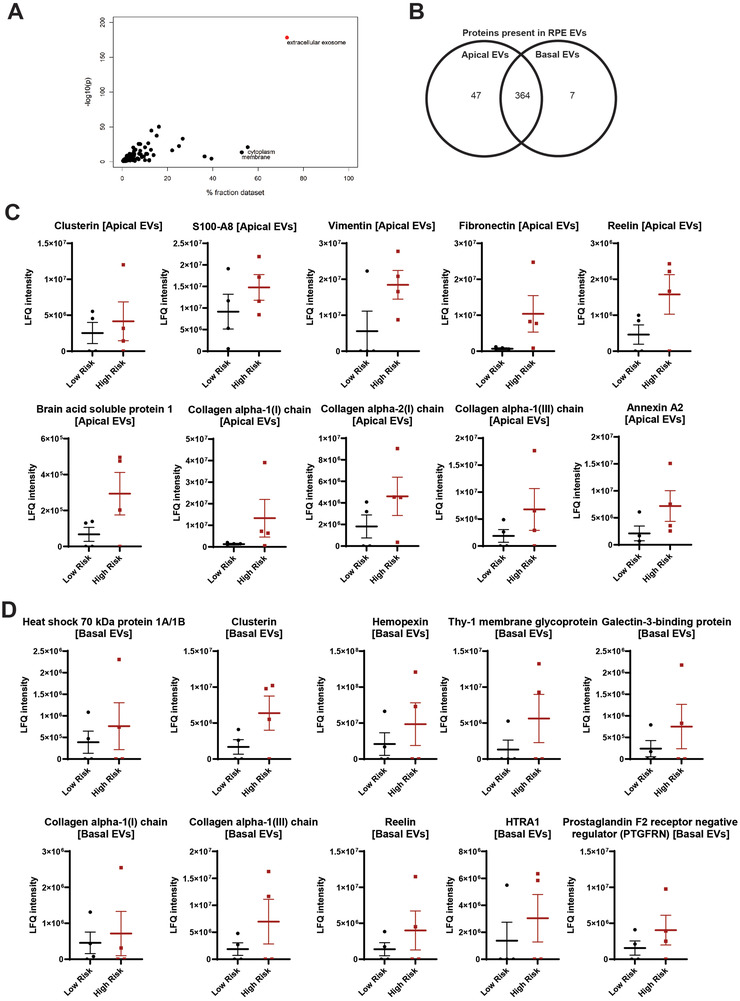
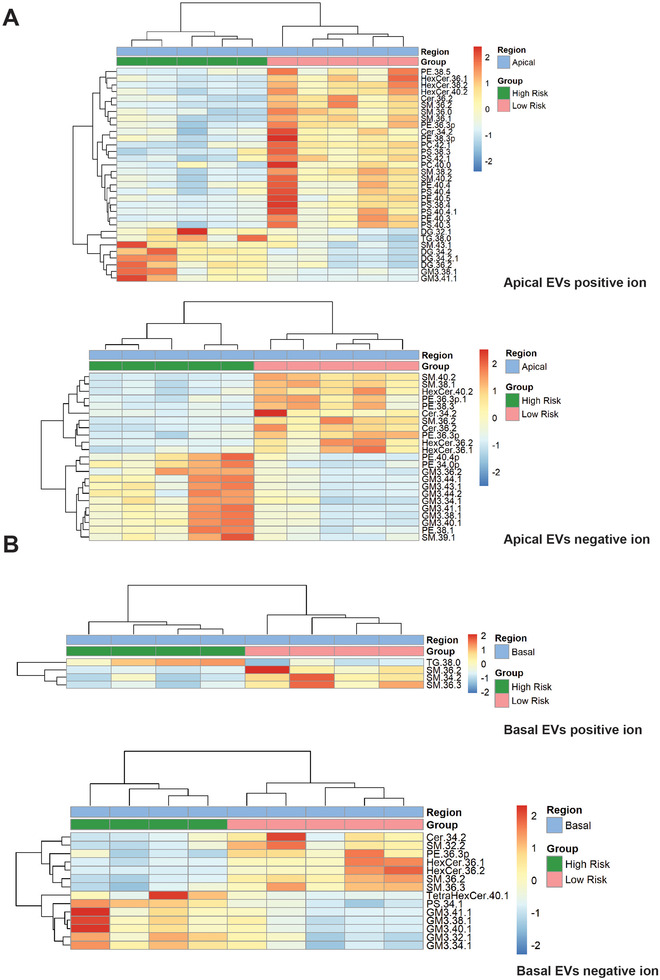
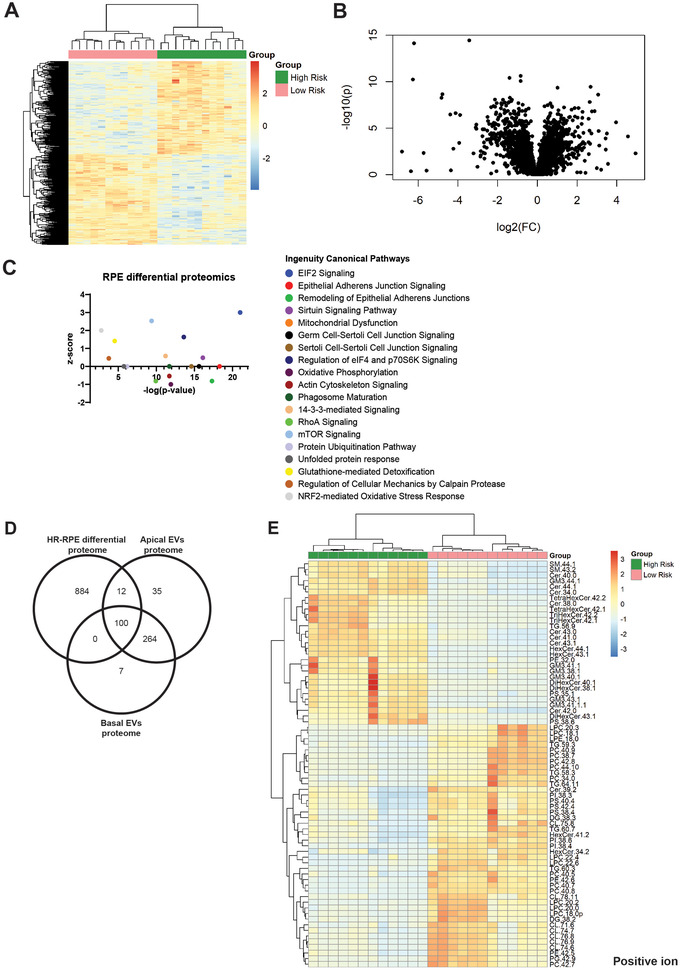
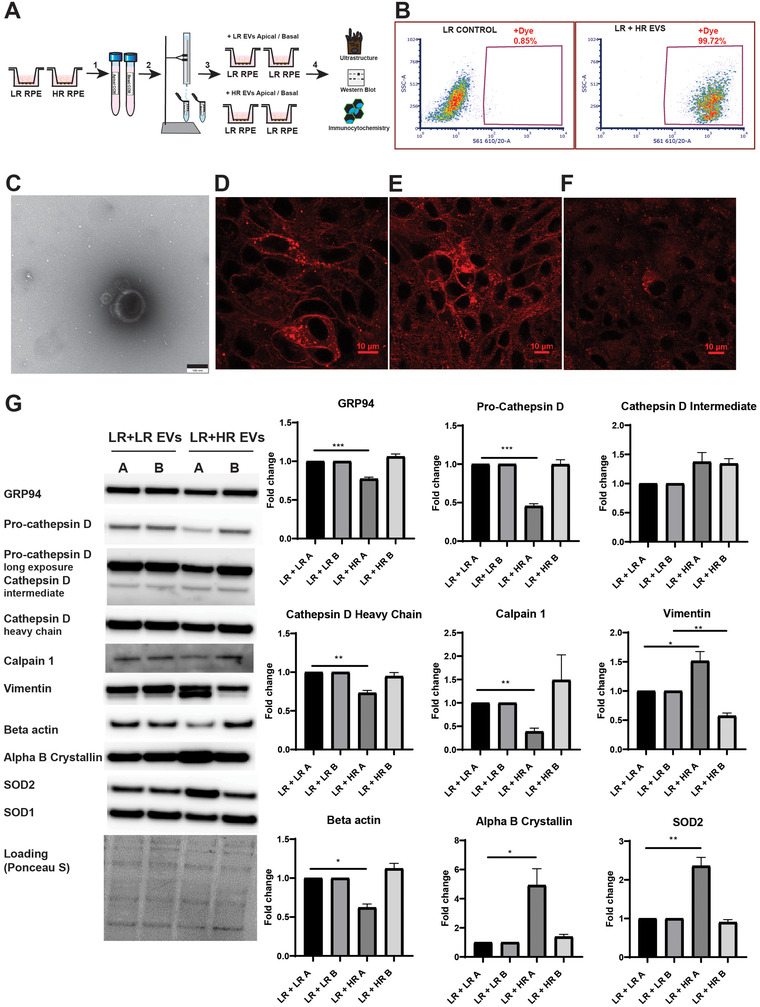
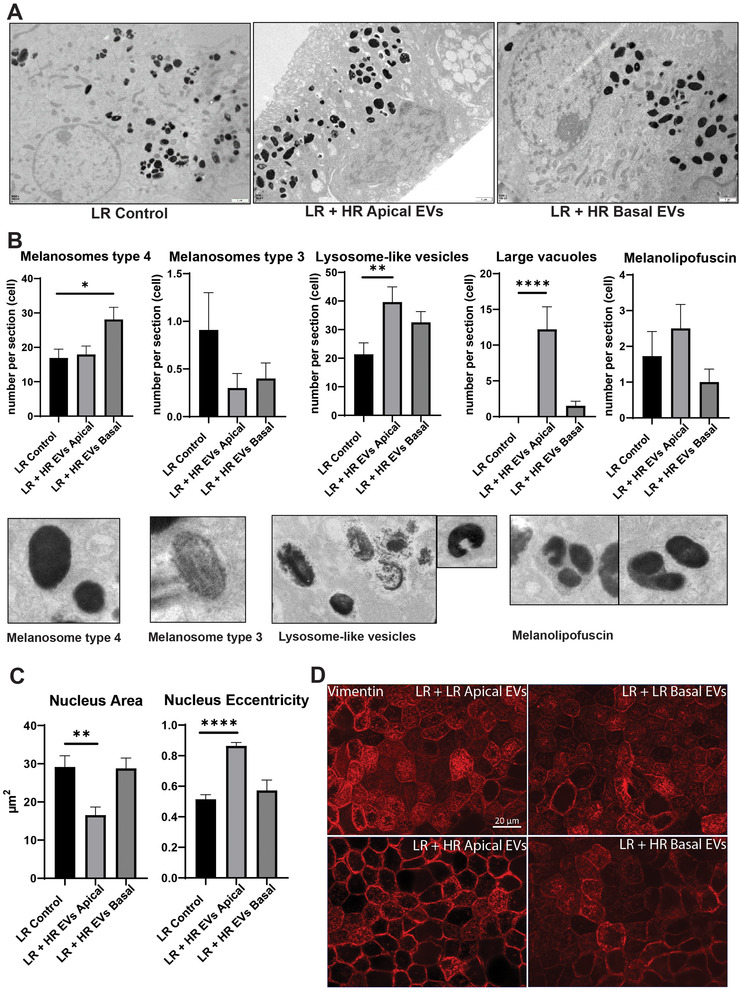
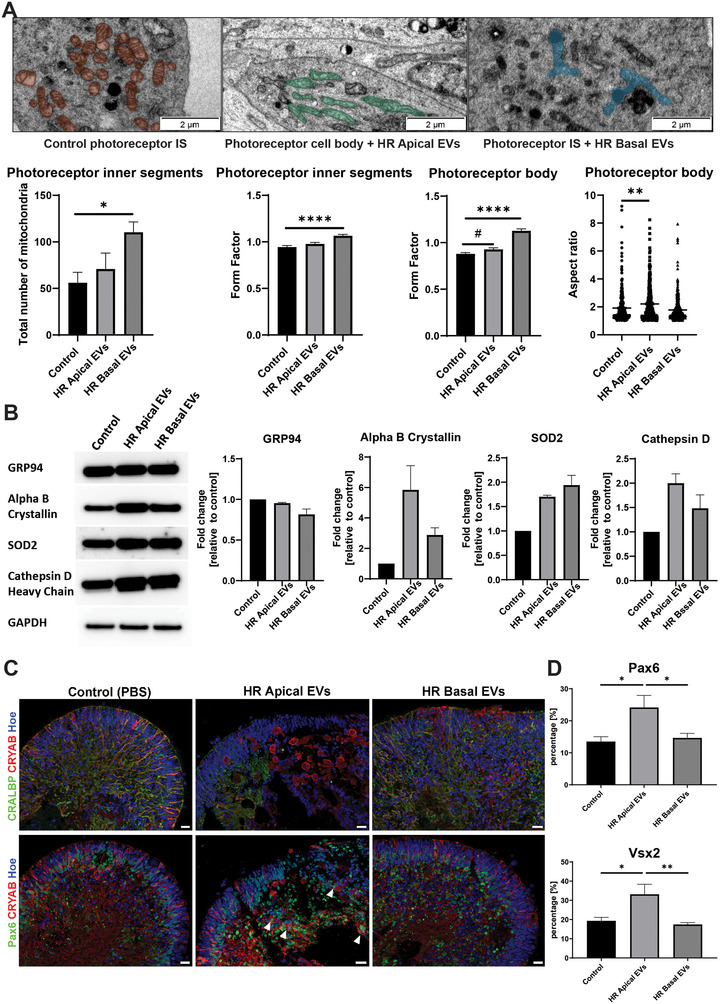
Age-related macular degeneration (AMD) is a leading cause of blindness. Vision loss is caused by the retinal pigment epithelium (RPE) and photoreceptors atrophy and/or retinal and choroidal angiogenesis. Here we use AMD patient-specific RPE cells with the Complement Factor H Y402H high-risk polymorphism to perform a comprehensive analysis of extracellular vesicles (EVs), their cargo and role in disease pathology. We show that AMD RPE is characterised by enhanced polarised EV secretion. Multi-omics analyses demonstrate that AMD RPE EVs carry RNA, proteins and lipids, which mediate key AMD features including oxidative stress, cytoskeletal dysfunction, angiogenesis and drusen accumulation. Moreover, AMD RPE EVs induce amyloid fibril formation, revealing their role in drusen formation. We demonstrate that exposure of control RPE to AMD RPE apical EVs leads to the acquisition of AMD features such as stress vacuoles, cytoskeletal destabilization and abnormalities in the morphology of the nucleus. Retinal organoid treatment with apical AMD RPE EVs leads to disrupted neuroepithelium and the appearance of cytoprotective alpha B crystallin immunopositive cells, with some co-expressing retinal progenitor cell markers Pax6/Vsx2, suggesting injury-induced regenerative pathways activation. These findings indicate that AMD RPE EVs are potent inducers of AMD phenotype in the neighbouring RPE and retinal cells.

Keywords: age-related macular degeneration; complement factor H; extracellular vesicles; human induced pluripotent stem cells; photoreceptors; retina; retinal pigment epithelium.


Conflict of interest statement

The authors declare no relevant conflict of interest.

Figures

FIGURE 1
FIGURE 1
Polarised EVs secretion in iPSC‐RPE. (A) EVs were purified using size exclusion chromatography from CCM of human iPSC derived RPE grown on porous membrane supports that allow the cells to develop apical (A) and basal (B) polarity. A representative TEM image of apical EVs is shown. Scale bar 500 nm. (B) TRPS was used to quantify the EV samples, with four independent experiments carried out to characterise the rate of EVs secretion in high‐risk compared to low‐risk RPE. Cell DNA contents were used for normalisation. The same data sets were used to calculate average polarised and cumulative rate of secretion. Overall, high‐risk RPE secrete statistically significantly more EVs compared to the control low‐risk RPE. (C) High‐risk cells apical EV secretion is statically significantly enhanced compared to low‐risk apical and basal EV secretion. *p < 0.05. Mean with SEM shown. Statistical analysis by means of normality test, followed by unpaired t test or ordinary one‐way ANOVA with Tukey's multiple comparisons test. (D) EVs samples were immunoblotted for markers of exosomes (vesicles of endosomal origin) and ectosomes, with Alix, CD63 and CD81 being detected at various levels and indicating their particular enrichment in the apical fractions compared to the basal counterparts, a feature of RPE EVs described previously (Klingeborn et al., 2017). Note equal volumes of apical and basal EVs were loaded per sample to visualise the polarisation of EVs load and contents. (E) Equal EV protein amounts were screened by western blotting for the levels of exosomal (CD63 and LAMP1) and ectosomal (CD9, CD81, SLC3A2 and BSG) markers, as proposed previously (Mathieu et al., 2021).
FIGURE 2
FIGURE 2
Transcriptomics analysis of low and high‐risk RPE EVs. (A) Numbers of transcripts significantly changed in high‐risk versus low‐risk RPE EVs (p value corrected < 0.05). (B) Distribution of transcript types among the differentially expressed transcripts. (C) Top 20 differentially expressed transcripts in apical/basal RPE EVs in high‐risk compared to low‐risk RPE EVs. Heatmaps show the normalised expression values from DESEQ2 at p value corrected < 0.05 cutoff.
FIGURE 3
FIGURE 3
IPA analysis of differentially expressed transcripts in high‐risk versus low‐risk RPE EVs. Ingenuity IPA analysis of differential transcriptomics results indicate that EVs may be involved in disease related mechanisms in high‐risk AMD RPE, including oxidative stress response, angiogenesis, actin cytoskeleton signaling, protein homeostasis and senescence. (A) Statistically significantly enriched pathways against the inferred activation z‐score. (B) IPA graphical summaries representing networks of the major pathways identified as the most significant in the differential transcriptomics data for the apical and basal high‐risk compared to low‐risk RPE EVs. The edges show direct (solid lines) and indirect (dashed lines) interactions between molecules in the network. Inferred edges are shown with dotted lines. Orange colour—predicted activation, blue colour—predicted inhibition state. Interactions are inferred from using the Ingenuity knowledge base.
FIGURE 4
FIGURE 4
Proteomics analysis of low and high‐risk RPE EVs. (A) Enrichment of exosomal proteins in the RPE‐derived EV samples. All proteins identified with >1 unique peptide were included. Proteins were annotated by Gene Ontology Cellular Component (GOCC) and the term enrichment using the DAVID web‐based tool (https://david.ncifcrf.gov/). Results are presented as a correlation of dataset fraction annotated by the given term and Benjamini–Hochberg corrected p‐value of the enrichment test. In red, extracellular exosome GOCC dataset with >70% dataset fraction detected. (B) Venn diagram showing counts of proteins identified in apical and basal RPE EVs. For details see Table S5. (C) Label free quantitation (LFQ) intensities of selected proteins present in apical and (D) basal RPE EVs. Mean with SEM shown.
FIGURE 5
FIGURE 5
Lipidomics analysis of low and high‐risk RPE apical and basal EVs. Heatmaps show supervised clustering of statistically significantly changed lipids from positive and negative ion mode analyses, based on t‐test and p value < 0.05 cutoff.
FIGURE 6
FIGURE 6
Proteomics and lipidomics of low and high‐risk RPE cell lines. (A) Heatmap represents supervised clustering of proteins in high‐risk versus low‐risk RPE significantly altered at p value corrected <0.05. (B) Volcano plot representing protein expression changes between high‐risk and low‐risk RPE. (C) Ingenuity IPA analysis of low and high‐risk RPE differential proteomics indicates statistically significantly enriched canonical pathways (‐log p value > 1.3) against an inferred activation z‐score, that is, increased or decreased biological function. (D) Venn diagram showing counts of proteins identified in apical and basal RPE EVs, and their overlap with the differentially expressed proteins in high‐risk versus low‐risk RPE at p value corrected < 0.05. (E) Lipidomics analysis of low and high‐risk RPE lines. Heatmap shows supervised clustering of statistically significantly changed lipids from positive ion mode mass spectrometry analysis, based on t‐test and p value < 0.0001 cutoff.
FIGURE 7
FIGURE 7
RPE EV transfer assays. (A) EVs were purified from low‐risk and high‐risk apical and basal CCM using size exclusion chromatography (1, 2). Low‐risk RPE cells were then exposed to the low/high‐risk apical/basal EVs in 12 treatments over the course of 32 days (3). The functional impact of exogenous EVs on the recipient cells was analysed using TEM, for the cell ultrastructure, western blot and immunocytochemistry for the expression of specific protein markers (4). (B) EVs uptake efficiency was assessed by EV membrane fluorescent labelling, RPE exposure to the labelled EVs for 24 h and flow cytometry. (C) Fluorescently stained EVs visualised on transmission electron microscopy. Scale bar 100 nm. Fluorescently stained EVs were exposed to RPE cells and confocal microscopy images were taken at (D) 1 h and (E) 3 h post‐exposure. (F) To investigate the internalised EVs only, cells were washed after 5 h post EV exposure and confocal microscopy images were taken 24 h post‐exposure. Scale bar 10 μm. (G) Western blot analysis indicates that markers of ER stress (GRP94), lysosomal proteolytic function (Cathepsin D) and stress responses (SOD2, alpha B crystallin) are changed in the low‐risk RPE treated with the high‐risk apical EVs. Cytoskeletal changes are also pronounced in these cells as indicated by the reduced levels of beta actin and a proteolytic cleavage of vimentin. Experiment was performed in triplicates. Mean + SEM shown; *p < 0.05, **p < 0.01, ***p < 0.001. A,apical; B, basal; LR, low risk; HR, high risk.
FIGURE 8
FIGURE 8
High‐risk RPE EVs confer disease phenotype to control RPE cells. (A) RPE ultrastructural features on TEM post‐EV exposure. LR Control—low risk PBS treated. (B) Melanosomes, vesicles with visible melanin degradation (melanolysosomes or lysosome‐like vesicles), large vacuoles and melanolipofuscin granules were quantified with Mean + SEM presented. Data was analysed for normality, followed by ANOVA and Dunn's multiple comparisons test. *p < 0.05, **p < 0.01, ****p < 0.0001. (C) Parameters of the cell nuclei were analysed with MIB Helsinki software, followed by statistical analysis (normality test followed by ANOVA with Dunnett's or Dunn's multiple comparisons test where appropriate). Mean + SEM shown, **p < 0.01, ****p < 0.0001. (D) Immunofluorescence analysis of vimentin expression in low‐risk RPE treated with low/high risk apical/basal EVs. Note the pronounced loss of intermediate filaments in high‐risk apical EVstreated RPE cells.
FIGURE 9
FIGURE 9
High‐risk RPE EVs confer stress signals to the photoreceptors. (A) Photoreceptor cell bodies and inner segments ultrastructural analysis by TEM shows changes in mitochondrial shape and organization (shaded structures) following the exposure to apical and basal high‐risk RPE EVs. MIB analysis of TEM images revealed statistically significant changes in mitochondria count, form factor (measure of mitochondria shape complexity and branching) and aspect ratio (measure of the length to width ratio). Statistical analysis by ANOVA followed multiple comparisons testing. Mean with SEM presented, 10 images per experimental group analysed, *p < 0.05, **p < 0.01, ****p < 0.0001, # p = 0.0506. Scale bar 2 μm. IS, inner segments. (B) Western blot analysis demonstrates increased expression of protective alpha B crystallin, SOD2 and cathepsin D, with no changes in ER stress marker GRP94. Mean with SEM of fold changes respective to GAPDH expression and relative to the control, n = 5. (C) ICC analysis of alpha B crystallin (CRYAB), Müller glia CRALBP marker, and neural progenitor cells Pax6 marker protein expression in retinal organoids treated with apical or basal high‐risk EVs, in comparison to PBS vehicle treated control. Cell nuclei were counterstained with Hoechst. Scale bar 20 μm. Arrowheads denote enlarged cells immunopositive for alpha B crystallin and Pax6 protein expression. (D) Quantification of Pax6 and Vsx2 positive staining. Mean + SEM shown, n = 8, *p < 0.05, **p < 0.01.

References

    1. Ahmad, I. , Del Debbio, C. B. , Das, A. V. , & Parameswaran, S. (2011). Muller glia: A promising target for therapeutic regeneration. Investigative Ophthalmology & Visual Science, 52(8), 5758–5764. - PubMed
    1. Alvarez‐Erviti, L. , Seow, Y. , Schapira, A. H. , Gardiner, C. , Sargent, I. L. , Wood, M. J. , & Cooper, J. M. (2011). Lysosomal dysfunction increases exosome‐mediated alpha‐synuclein release and transmission. Neurobiology of Disease, 42(3), 360–367. - PMC - PubMed
    1. Anderson, D. H. , Talaga, K. C. , Rivest, A. J. , Barron, E. , Hageman, G. S. , & Johnson, L. V. (2004). Characterization of beta amyloid assemblies in drusen: The deposits associated with aging and age‐related macular degeneration. Experimental Eye Research, 78(2), 243–256. - PubMed
    1. Atienzar‐Aroca, S. , Serrano‐Heras, G. , Freire Valls, A. , Ruiz de Almodovar, C. , Muriach, M. , Barcia, J. M. , Garcia‐Verdugo, J. M. , Romero, F. J. , & Sancho‐Pelluz, J. (2018). Role of retinal pigment epithelium‐derived exosomes and autophagy in new blood vessel formation. Journal of Cellular and Molecular Medicine, 22(11), 5244–5256. - PMC - PubMed
    1. Azuma, M. , Fukiage, C. , David, L. L. , & Shearer, T. R. (1997). Activation of calpain in lens: A review and proposed mechanism. Experimental Eye Research, 64(4), 529–538. - PubMed

Publication types