Review
. 2022 Nov 30;75(s05):S1-S89.
doi: 10.33588/rn.75s05.2022311.

Citicoline: pharmacological and clinical review, 2022 update

[Article in English, Spanish]
Affiliations
Review

Citicoline: pharmacological and clinical review, 2022 update

[Article in English, Spanish]
J J Secades et al. Rev Neurol. .

Abstract

This review is based on the previous one published in 2016 (Secades JJ. Citicoline: pharmacological and clinical review, 2016 update. Rev Neurol 2016; 63 (Supl 3): S1-S73), incorporating 176 new references, having all the information available in the same document to facilitate the access to the information in one document. This review is focused on the main indications of the drug, as acute stroke and its sequelae, including the cognitive impairment, and traumatic brain injury and its sequelae. There are retrieved the most important experimental and clinical data in both indications.

Title: Citicolina: revisión farmacológica y clínica, actualización 2022.

Esta revisión se basa en la publicada en 2016 –Secades JJ. Citicolina: revisión farmacológica y clínica, actualización 2016. Rev Neurol 2016; 63 (Supl 3): S1-S73–, e incorpora 176 nuevas referencias aparecidas desde entonces, con toda la información disponible para facilitar el acceso a toda la información en un único documento. La revisión se centra en las principales indicaciones del fármaco, como los accidentes cerebrovasculares agudos y sus secuelas, incluyendo el deterioro cognitivo, y los traumatismos craneoencefálicos y sus secuelas. Se recogen los principales aspectos experimentales y clínicos en estas indicaciones.


Conflict of interest statement

Conflicto de intereses: J.J.S. trabaja en el Departamento Médico de Ferrer.

Figures

Figura 1
Figura 1
Estructura química de la CDP-colina o citicolina.
Figura 2
Figura 2
Relación de la citicolina con el metabolismo de la colina, los fosfolípidos cerebrales y la acetilcolina.
Figura 3
Figura 3
Efecto de la citicolina sobre el ácido araquidónico liberado en el cerebro isquémico de la rata. Se administró citicolina (200 y 1.000 mg por vía intraperitoneal) 10 minutos antes de la decapitación; 5 minutos después de ésta, se extrajeron los ácidos grasos libres. El ácido araquidónico se determinó mediante cromatografía gaseosa. a p < 0,05; b p < 0,001 frente a isquemia sin tratamiento.
Figura 4
Figura 4
Efecto del tratamiento crónico con citicolina en la recuperación funcional determinada como integración sensoriomotora (a) y como comportamiento motor asimétrico (b). La citicolina (MCAO + CDP) y la solución salina (MCAO + SAL) se administraron 24 horas después de la oclusión permanente de la arteria cerebral media (pMCAO). Los datos se expresan como media ± error estándar de la media, n = 16: a p < 0,05, frente a MCAO + SAL.
Figura 5
Figura 5
Efecto de la citicolina en dosis baja (100 mg/kg) y alta (500 mg/kg) sobre el volumen del infarto. Los valores representan la media ± desviación estándar. El volumen del infarto fue significativamente menor (p < 0,01) en el grupo de dosis alta de citicolina en comparación con el grupo control.
Figura 6
Figura 6
Efecto de la asociación de citicolina (CIT) y el activador tisular del plasminógeno recombinante (rTPA) sobre el volumen del infarto en un modelo de ictus embólico en ratas. C250: citicolina, 250 mg/kg; C500: citicolina, 500 mg/kg; rtPA: rtPA, 5 mg/kg.
Figura 7
Figura 7
Densitometría de las bandas para la poli-ADP-ribosa polimerasa (PARP) de la inmunotransferencia en los diferentes grupos de ratas en la zona de infarto y en la zona de penumbra a las 12 y 24 horas de la isquemia. a p < 0,05; b p < 0,025; c p < 0,0001.
Figura 8
Figura 8
Cascada isquémica. Los cuadros más oscuros indican los lugares en los que se ha comprobado que la citicolina tiene algún efecto farmacológico.
Figura 9
Figura 9
Influencia de la citicolina (30 mg/kg por vía intravenosa) sobre la síntesis de catecolaminas en distintos tiempos después de su administración. Los gráficos representan las variaciones en los niveles de catecolaminas y en su velocidad de síntesis, en tanto por ciento respecto al control, y en diferentes localizaciones. • Cuerpo estriado; ▪ Corteza; ▴ Tronco cerebral-mesencéfalo; a p < 0,1; b p < 0,05; c p < 0,01.
Figura 10
Figura 10
Efecto de la administración crónica de citicolina sobre los niveles cerebrales de fosfolípidos en ratones de 30 meses de edad, que recibieron un suplemento dietético con citicolina (500 mg/kg/día) o placebo durante 27 meses. a p < 0,05; b p < 0,01.
Figura 11
Figura 11
Concentraciones plasmáticas de colina y citidina inmediatamente después de la administración de una única dosis de 2 g de citicolina por vía oral a humanos.
Figura 12
Figura 12
Niveles plasmáticos de colina y citidina tras la administración de tres dosis consecutivas de 2 g de citicolina por vía oral a humanos.
Figura 13
Figura 13
Concentraciones de colina, citidina y CDP-colina en plasma humano tras la infusión intravenosa de una solución de citicolina (3 g/500 mL de solución salina fisiológica).
Figura 14
Figura 14
Niveles de radioactividad en el hígado (a), cerebro (b) y riñón (c) de ratas en distintos tiempos después de la inyección de citicolina doblemente marcada en dosis de 2 mg/kg. Todos los valores representan el promedio obtenido a partir de 10 animales.
Figura 15
Figura 15
Evolución de los niveles de 14C-fosfolípidos en el cerebro de rata después de la administración intravenosa de citicolina doblemente marcada. Los niveles representan promedios obtenidos a partir de tres animales y se expresan como porcentaje de la radioactividad total correspondiente al 14C en el cerebro.
Figura 16
Figura 16
Excreción total de la radioactividad (porcentaje respecto al total administrado) durante cinco días después de la administración oral de C-citicolina. Se expresa el valor medio de seis individuos.
Figura 17
Figura 17
Normalización del nivel de conciencia en función del tiempo y del tratamiento recibido; p < 0,01 en el día 60.
Figura 18
Figura 18
Incidencia del tratamiento con citicolina en el resultado final. Los resultados se expresan como porcentaje. a p > 0,001 respecto al grupo de pacientes no tratados con citicolina.
Figura 19
Figura 19
Evolución de la imagen tomográfica de edema cerebral tras 14 días de tratamiento (p < 0,005).
Figura 20
Figura 20
Evolución de los síntomas posconmocionales tras un mes de tratamiento con citicolina o placebo. Se representa el número de pacientes que referían cada una de las alteraciones contempladas.
Figura 21
Figura 21
Gráfico tipo Forest del metaanálisis para valorar el efecto de la citicolina en la independencia de pacientes con traumatismo craneoencefálico: odds ratio (OR): 1.815; intervalo de confianza al 95% (IC 95%): 1,302-2,530. Con permiso de J.J. Secades. Citicoline for the treatment of head injury: a systematic review and meta-analysis of controlled clinical trials. J Trauma Treat 2014; 4: 227. doi:10.4172/2167-1222.1000227.
Figura 22
Figura 22
Efecto del tratamiento con citicolina sobre las tasas de mortalidad y desenlaces desfavorables. UCI: unidad de cuidados intensivos.
Figura 23
Figura 23
Resultado final conseguido en función del tratamiento recibido. Destaca el mayor número de buenos resultados obtenidos con citicolina, en comparación con el grupo control.
Figura 24
Figura 24
Probabilidades estimadas –analisis GEE (Generalized Estimating Equations)– de recuperacion global a los tres meses del inicio de los sintomas. La recuperacion global se define como una diferencia consistente y persuasiva en la proporcion de pacientes que consiguen puntuaciones de escala de ictus del Instituto Nacional de la Salud ≤ 1, indice de Barthel ≥ 95 y escala de Rankin modificada . 1 al mismo tiempo.
Figura 25
Figura 25
Mortalidad e incapacidad a largo plazo. Gráfico Forest del metaanálisis del efecto de la citicolina frente a control en estudios con pacientes con infarto cerebral, hemorragia intracerebral e ictus sin confirmación del subtipo con neuroimagen. C010: estudio 010 de citicolina; CSSG: Grupo de Estudio de Citicolina en Ictus (Citicoline Stroke Study Group); df: grados de libertad; Fixed: modelo de efectos fijos; IC: intervalo de confianza; M-H: estimador de Mantel-Haenszel. Con permiso de J.L. Saver. Citicoline: update on a promising and widely available agent for neuroprotection and neurorepair. Rev Neurol Dis 2008; 5: 167-77.
Figura 26
Figura 26
Estimación del efecto e intervalos de confianza al 95% (IC 95%) de la intervención con citicolina en las tasas de independencia (mRS de 0-2 o equivalente) en comparación con placebo en pacientes con ictus isquémico agudo. Con permiso de J.J. Secades, et al. Citicoline for acute ischemic stroke: a systematic review and formal meta-analysis of randomized, double-blind, and placebo-controlled trials. J Stroke Cerebrovasc Dis 2016; 25: 1984-96.
Figura 27
Figura 27
Efectos de la citicolina sobre la función cognitiva, evaluada mediante la Minimental State Examination (MMSE), en ancianos sanos (control), pacientes con enfermedad de Alzheimer de inicio precoz (EAIP) o tardío (EAIT) y enfermos con demencia multiinfarto (DMI). a p < 0,02; b p < 0,01.
Figura 28
Figura 28
Efectos antidepresivos de la citicolina en ancianos sanos (control), pacientes con enfermedad de Alzheimer de inicio precoz (EAIP) o tardío (EAIT) y enfermos con demencia multiinfarto (DMI), evaluados mediante la escala para la depresión de Hamilton. a p < 0,02; b p < 0,01; c p < 0,05
Figura 29
Figura 29
Comparación de la evolución de las puntuaciones del Minimental State Examination corregido entre el grupo de la citicolina y el grupo control.
Figura 30
Figura 30
Deterioro cognitivo global durante el seguimiento. Los pacientes tratados con citicolina muestran una mejoría significativa de su estado cognitivo durante el seguimiento (p = 0,005). Tras el primer año, sólo los pacientes tratados con citicolina continúan mejorando el estado cognitivo. Con permiso de J. Álvarez-Sabín, et al. Long-term treatment with citicoline prevents cognitive decline and predicts a better quality of life after a first ischemic stroke. Int J Mol Sci 2016; 17: 390.
Figure 1
Figure 1
Chemical structure of CDP-choline (citicoline).
Figure 2
Figure 2
Relationship between citicoline and choline metabolism, cerebral phospholipids and acetylcholine.
Figure 3
Figure 3
Effect of citicoline on arachidonic acid release in ischaemic rat brains. Citicoline (200 and 1,000 mg i.p.) was administered 10 min before decapitation. Five minutes later, free fatty acids were extracted. Arachidonic acid levels were determined by gas chromatography. a p <0.05; b p < 0.001 versus untreated ischaemia.
Figure 4
Figure 4
Effect of chronic treatment with CDP-choline on functional recovery, as determined as sensorimotor integration (a) and asymmetrical motor behaviour (b). CDP-choline (MCAO+CDP) or saline (MCAO+SAL) were administered 24 h after pMCAO and for 28 days following pMCAO. Sensorimotor integration and asymmetrical motor behaviour were studied by the staircase skilled reaching test and the elevated body swing test (EBST), respectively. Data are means ± SEM, n = 16. a p < 0.05 versus MCAO+SAL.
Figure 5
Figure 5
Effect of citicoline at a low dose (100 mg/kg) or high dose (500 mg/kg) on infarct volume. The values represent the mean ± SD. The infarct volume was significantly smaller (p < 0.01) in the high-dose citicoline group than in the control group.
Figure 6
Figure 6
Effect of the association of citicoline (CIT) and rtPA on infarct size in a model of embolic stroke in rats. C250: citicoline 250 mg/kg; C500: citicoline 500 mg/kg; rtPA: rtPA, 5 mg/kg.
Figure 7
Figure 7
Band densitometry analysis for PARP by western blotting in different groups of rats in the infarct zone and penumbra zone 12 and 24 h after ischaemia. a p < 0.05; b p < 0.025; c p < 0.0001.
Figure 8
Figure 8
Ischaemic cascade. Darkest boxes show the processes where citicoline has demonstrated pharmacological effects.
Figure 9
Figure 9
Influence of citicoline (30 mg/kg i.v.) on catecholamine synthesis at different time points after administration. The graphs show variations in catecholamine concentrations and rates of synthesis, in percentages with respect to the control, at different locations. • Corpus striatum; ▪ Cortex; ▴Brainstem-mesencephalon; a p < 0.1, b p < 0.05; c p < 0.01.
Figure 10
Figure 10
Effect of chronic administration of citicoline on the brain titres of phospholipids in 30-month-old mice fed a dietary supplement with citicoline (500 mg/kg/day) or placebo for 27 months. a p < 0.05; b p < 0.01.
Figure 11
Figure 11
Plasma concentrations of choline and cytidine immediately after administration of a single oral dose of 2 g citicoline in humans.
Figure 12
Figure 12
Plasma concentrations of choline and cytidine immediately after administration of three consecutive oral doses (2 g) in humans.
Figure 13
Figure 13
Concentrations of choline, cytidine and CDP-choline in human plasma after intravenous infusion of a solution of citicoline (3 g/500 mL physiological saline solution).
Figure 14
Figure 14
Concentrations of radioactivity in the liver (a), brain (b) and kidneys (c) of rats at different time points after injecting double-labelled citicoline at a dose of 2 mg/kg. All values represent the means obtained from 10 animals.
Figure 15
Figure 15
Evolution of 14C-phospholipid concentrations in rat brains after intravenous administration of double-labelled citicoline. The concentrations represent the means of three animals and are expressed as a percentage of the total radioactivity corresponding to 14C in the brain.
Figure 16
Figure 16
Total excretion of radioactivity (percentage of total administered) for 5 days after oral administration of 14C -Citicoline. The mean values of six individuals are shown.
Figure 17
Figure 17
Normalisation of the state of consciousness in relation to time and treatment; p < 0.01 at day 60.
Figure 18
Figure 18
Effect of treatment with citicoline on final results. Results are expressed as percentages. a p < 0.001 versus patients not treated with citicoline.
Figure 19
Figure 19
Evolution of the tomographic image of cerebral oedema after 14 days of treatment (p < 0.005).
Figure 20
Figure 20
Evolution of post-concussional symptoms after one month of treatment with citicoline or placebo. The number of patients reporting each symptom is shown.
Figure 21
Figure 21
Forest plot of the meta-analysis of the effects of citicoline on independence after traumatic brain injury, based on the random-effects model: odds ratio, 1.815 (95% CI: 1.302-2.530). Reprinted with permission from J.J. Secades. Citicoline for the treatment of head injury: a systematic review and meta-analysis of controlled clinical trials. J Trauma Treat 2014; 4: 227. doi:10.4172/2167-1222.1000227.
Figure 22
Figure 22
Effect of citicoline treatment on the rates of mortality and unfavourable outcomes. ICU: intensive care unit).
Figure 23
Figure 23
Outcome in relation to treatment, highlighting the number of good results achieved with citicoline compared to the control group.
Figure 24
Figure 24
Estimated probabilities (GEE analysis) of overall recovery three months after onset of symptoms. Overall recovery is defined as a consistent and persuasive difference in the proportion of patients who achieve scores of NIHSS ≤ 1, BI ≥ 95 and mRS ≤ 1 at the same time.
Figure 25
Figure 25
Death or dependency at long-term follow-up. Forest plot meta-analysis of the effect of citicoline versus control in trials enrolling patients with ischaemic stroke, intracerebral haemorrhage and stroke without imaging confirmation of subtype. C010: citicoline 010 trial; CI: confidence interval; CSSG: Citicoline Stroke Study Group; df: degree of freedom; Fixed: fixed-effects model; M-H: Mantel-Haenszel estimate. Reprinted with permission from J.L. Saver. Citicoline: update on a promising and widely available agent for neuroprotection and neurorepair. Rev Neurol Dis 2008; 5: 167-77.
Figure 26
Figure 26
Effect estimates and 95% confidence intervals (95% CI) of the intervention with citicoline on the rates of independence (mRS score of 0-2 or equivalent) in comparison with the placebo in patients with acute ischemic stroke. Reprinted with permission from J.J. Secades, et al. Citicoline for acute ischemic stroke: a systematic review and formal metaanalysis of randomized, double-blind, and placebo-controlled trials. J Stroke Cerebrovasc Dis 2016; 25: 1984-96.
Figure 27
Figure 27
Effects of citicoline on cognitive function assessed using the MMSE in healthy older subjects (control), patients with early-onset Alzheimer’s disease (EOAD) or late-onset Alzheimer’s disease (LOAD) and patients with multi-infarct dementia (MID). a p < 0.02; b p < 0.01.
Figure 28
Figure 28
Antidepressive effects of citicoline in healthy older subjects (control) and in patients with Alzheimer’s disease or multi-infarct dementia (MID), evaluated with the Hamilton Depression Scale. EOAD: early-onset Alzheimer’s disease; LOAD: late-onset Alzheimer’s disease. a p < 0.02; b p < 0.01; c p < 0.05.
Figure 29
Figure 29
Comparison of corrected Mini-Mental State Examination levels between citicoline group and controls.
Figure 30
Figure 30
Global cognitive impairment during follow-up. Patients treated with citicoline show a significant improvement in cognitive status during follow-up (p = 0.005). After the first year, only citicoline-treated patients continue to improve cognitive status. Reprinted from J. Álvarez-Sabín, et al. Long-term treatment with citicoline prevents cognitive decline and predicts a better quality of life after a first ischemic stroke. Int J Mol Sci 2016; 17: 390.

Similar articles

Cited by

References

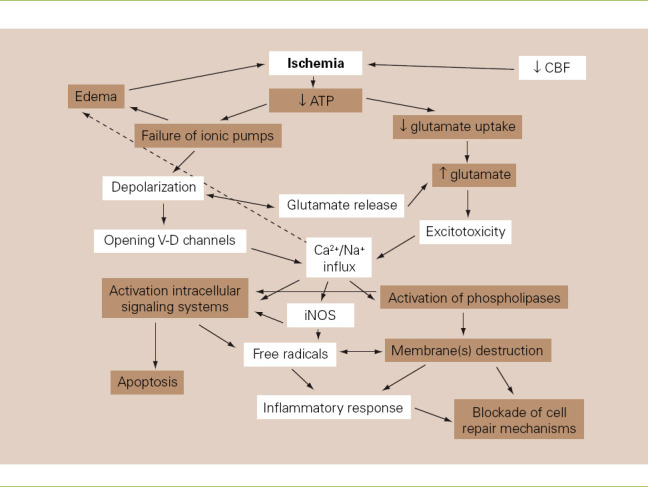
    1. Lozano R. La membrana neuronal:implicaciones terapéuticas. Boletín de Neurología. 1993;2:3–8.
    1. McMurray WC, Magee WL. Phospholipid metabolism. Ann Rev Biochem. 1972;41:129–61. - PubMed
    1. Nilsson B. CDP-choline:a short review. In: Tognon G, Garattini S, editors. Drug treatment and prevention in cerebrovascular disorders. Amsterdam: Elsevier/North Holland Biomedical Press; 1979. pp. 273–7.
    1. Kennedy EP, Weiss SB. The function of cytidine coenzymes in the biosynthesis of phospholipides. J Biol Chem. 1956;222:193–214. - PubMed
    1. McMaster CR. From yeast to humans - roles of the Kennedy pathway for phosphatidylcholine synthesis. FEBS Lett. 2018;592:1256–72. - PubMed

MeSH terms

Substances