

Time Analysis of an Emergent Infection Spread Among Healthcare Workers: Lessons Learned from Early Wave of SARS-CoV-2
- PMID: 36545246
- PMCID: PMC9762674
- DOI: 10.2147/IJGM.S383624
Time Analysis of an Emergent Infection Spread Among Healthcare Workers: Lessons Learned from Early Wave of SARS-CoV-2
Abstract
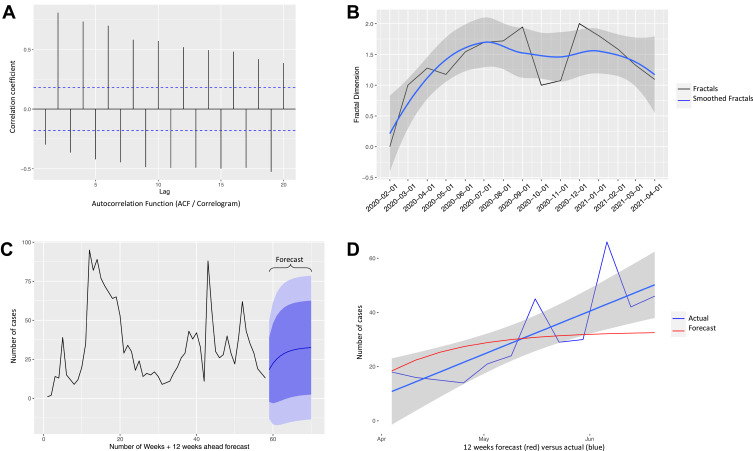
Aim: To find whether an emergent airborne infection is more likely to spread among healthcare workers (HCW) based on data of SARS-CoV-2 and whether the number of new cases of such airborne viral disease can be predicted using a method traditionally used in weather forecasting called Autoregressive Fractionally Integrated Moving Average (ARFIMA).
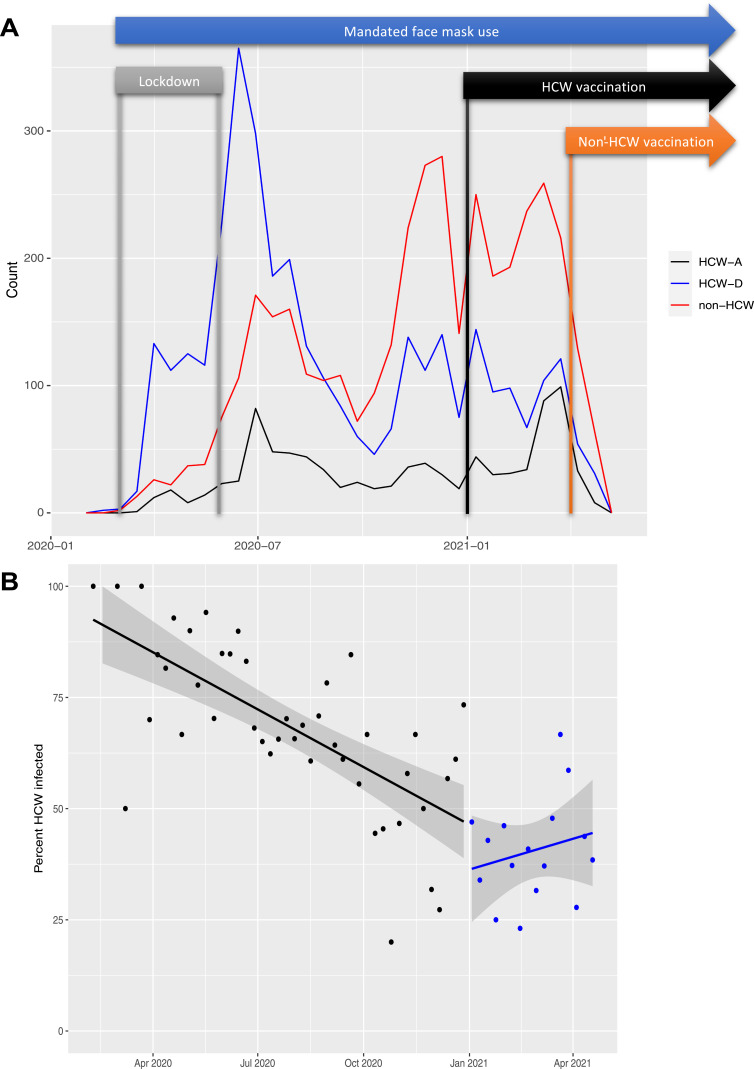
Methods: We analyzed SARS-CoV-2 spread among HCWs based on outpatient nasopharyngeal swabs for real-time polymerase chain reaction (RT-PCR) tests and compared it to non-HCW in the first and the second wave of the pandemic. We also generated an ARFIMA model based on weekly case numbers from February 2020 to April 2021 and tested it on data from May to July 2021.
Results: Our analysis of 8998 tests in the 15 months period showed a rapid rise in positive RT-PCR tests among HCWs during the first wave of pandemic. In the second wave, however, positive patients were more commonly non-HCWs. The ARFIMA model showed a long-memory pattern for SARS-CoV-2 (seven months) and predicted future new cases with an average error of ±1.9 cases per week.
Conclusion: Our data indicate that the virus rapidly spread among HCWs during the first wave of the pandemic. Review of published literature showed that this was the case in multiple other areas as well. We therefore suggest strict policies early in the emergence of a new infection to protect HCWs and prevent spreading to the general public. The ARFIMA model can be a valuable forecasting tool to predict the number of new cases in advance and assist in efficient planning.
Keywords: COVID-19; SARS-COV-2; diagnosis; dispersion; health care worker; prediction.
© 2022 Leme et al.
Conflict of interest statement
The authors declare that they have no competing interests in this work.
Figures
Similar articles
-
A SARS-CoV-2 Infection High-Uptake Program on Healthcare Workers and Cancer Patients of the National Cancer Institute of Naples, Italy.Healthcare (Basel). 2022 Jan 20;10(2):205. doi: 10.3390/healthcare10020205. Healthcare (Basel). 2022. PMID: 35206819 Free PMC article.
-
Seroprevalence study of SARS-CoV-2 antibodies in healthcare workers following the first wave of the COVID-19 pandemic in a tertiary-level hospital in the south of Ireland.BMJ Open. 2021 Jun 8;11(6):e051415. doi: 10.1136/bmjopen-2021-051415. BMJ Open. 2021. PMID: 34103324 Free PMC article.
-
An Integrated Strategy for the Prevention of SARS-CoV-2 Infection in Healthcare Workers: A Prospective Observational Study.Int J Environ Res Public Health. 2020 Aug 10;17(16):5785. doi: 10.3390/ijerph17165785. Int J Environ Res Public Health. 2020. PMID: 32785110 Free PMC article.
-
Parallel evolution and differences in seroprevalence of SARS-CoV-2 antibody between patients with cancer and health care workers in a tertiary cancer centre during the first and second wave of COVID-19 pandemic: canSEROcov-II cross-sectional study.Eur J Cancer. 2022 Apr;165:13-24. doi: 10.1016/j.ejca.2022.01.005. Epub 2022 Feb 1. Eur J Cancer. 2022. PMID: 35189537 Free PMC article.
-
Occupational health surveillance of healthcare workers during COVID 19 pandemic: a narrative review.Acta Biomed. 2022 Mar 14;93(1):e2022007. doi: 10.23750/abm.v93i1.10277. Acta Biomed. 2022. PMID: 35315429 Free PMC article. Review.
References
-
- World Health Organization. A Brief Guide to Emerging Infectious Diseases and Zoonoses. World Health Organization; 2014.
-
- Weber DJ, Rutala WA, Fischer WA, Kanamori H, Sickbert-Bennett EE. Emerging infectious diseases: focus on infection control issues for novel coronaviruses (Severe Acute Respiratory Syndrome-CoV and Middle East Respiratory Syndrome-CoV), hemorrhagic fever viruses (Lassa and Ebola), and highly pathogenic avian influenza viruses, A(H5N1) and A(H7N9). Am J Infect Control. 2016;44(5):e91–e100. doi: 10.1016/j.ajic.2015.11.018 - DOI - PMC - PubMed
LinkOut - more resources
Full Text Sources
Miscellaneous
