. 2022 Dec 18;12(12):e9638.
doi: 10.1002/ece3.9638. eCollection 2022 Dec.

Differences in initial abundances reveal divergent dynamic structures in Gause's predator-prey experiments

Affiliations

Differences in initial abundances reveal divergent dynamic structures in Gause's predator-prey experiments

Lina Kaya Mühlbauer et al. Ecol Evol. .

Abstract

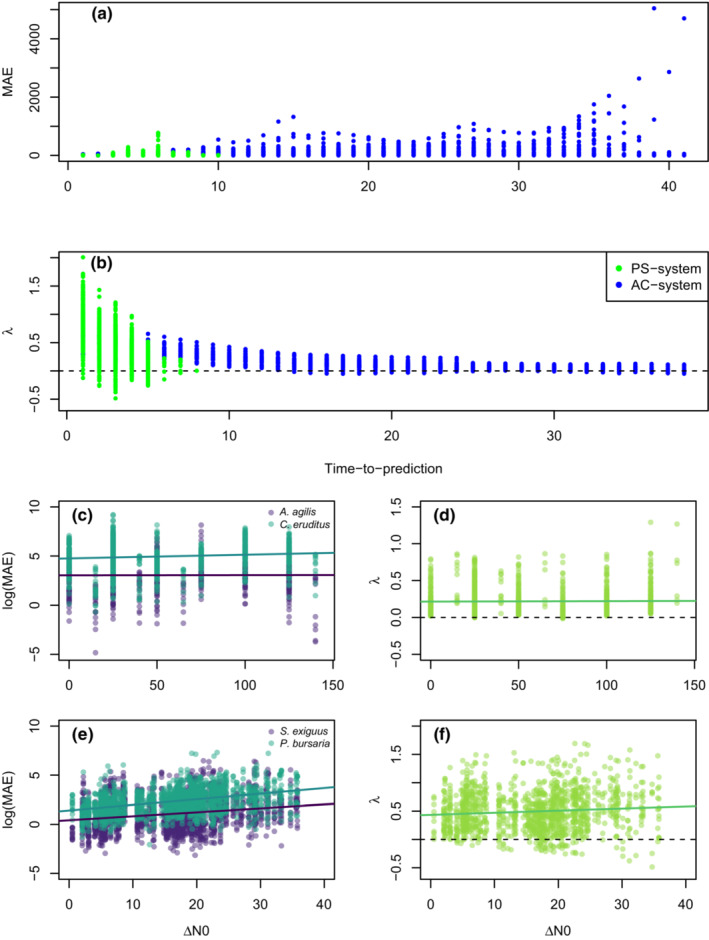
Improved understanding of complex dynamics has revealed insights across many facets of ecology, and has enabled improved forecasts and management of future ecosystem states. However, an enduring challenge in forecasting complex dynamics remains the differentiation between complexity and stochasticity, that is, to determine whether declines in predictability are caused by stochasticity, nonlinearity, or chaos. Here, we show how to quantify the relative contributions of these factors to prediction error using Georgii Gause's iconic predator-prey microcosm experiments, which, critically, include experimental replicates that differ from one another only in initial abundances. We show that these differences in initial abundances interact with stochasticity, nonlinearity, and chaos in unique ways, allowing us to identify the impacts of these factors on prediction error. Our results suggest that jointly analyzing replicate time series across multiple, distinct starting points may be necessary for understanding and predicting the wide range of potential dynamic types in complex ecological systems.

Keywords: chaos; empirical dynamic modeling; initial abundance; microcosm experiments; nonlinear dynamics; time series analysis.


Conflict of interest statement

The authors declare no conflict of interest.

Figures

FIGURE 1
FIGURE 1
Univariate effects of prediction intervals (time‐to‐prediction) and distance in initial abundances (ΔN0) on prediction quality (mean absolute error (MAE)) and Lyapunov exponents (λ) in pairwise cross‐predictions in multivariate (a, b, d, and f) and single variate embeddings (c and e). (a, b) show the effect of the prediction length on MAE and Lyapunov exponent in the predator–prey system of Aleuroglyphus agilis (prey) and Cheyletus eruditus (predator), with wheat as a feedstock (light green) and Paramecium bursaria and Saccharomyces exiguus (blue). (c, e) show the effect of differences in initial abundances on MAE for both species in each system. (d, f) represents the relationship between Lyapunov exponent and ΔN0. (c) A. agilis: R 2 = −.0009; p = .87; b = 0.0002 C. eruditus: R 2 = .01; p < .001; b = 0.004 d. R 2 = −.0008; p = .68; b = 0 e. e. S. exiguus: R 2 = .04; p < .001; b = 0.04 P. bursaria: R 2 = .04; p < .001; b = 0.04 f. R 2 = −.008; p < .004; b = 0.
FIGURE 2
FIGURE 2
Interactions between Lyapunov exponent (λ), distance in initial abundances (ΔN0) and nonlinearity (θ) influencing the prediction ability (mean absolute error (MAE)) in pairwise cross‐predictions of experimental replicates in the predator–prey‐system of Aleuroglyphus agilis (prey) and Cheyletus eruditus (predator), with wheat as a feedstock (a, b) and Paramecium bursaria and Saccharomyces exiguus (b, c). A, c. colored contour lines show standardized MAE. Violet parts show an MAE < standard deviation/2, which corresponds to a rough rule of thumb for identifying “good” model performance (e.g., Moriasi et al., 2007). Only significant (p < .05) Lyapunov exponents are included. Self‐predictions are excluded. Lyapunov exponents and MAE are represented as means over all time steps. (b, d) Each line represents the MAE, in relation to θ, of one experimental replicate, violet represents the predator species, green the prey species.
FIGURE 3
FIGURE 3
Indications for two different kinds of dynamics in the predator–prey system with Paramecium bursaria and Saccharomyces exiguus. Experimental replicates were grouped by their starting point in phase space (see points in d.). (a, b) The mean effect of predators on prey and vice versa over time is compared between groups. Shaded areas show the confidence intervals (standard error from the mean effect of predator on prey and vice versa). (c) The total mean absolute error (MAE) in comparison between groups and with cross‐predictions between groups (all), self‐predictions were removed. (d) Relationship of effect of predators on prey (δPredator/δPrey) and observed time series in phase space. Gray contour lines show the strength and direction of the interaction. Colored arrows show observed predator and prey dynamics for all experimental replicates.
FIGURE 4
FIGURE 4
Estimated fractions of chaos, nonlinearity, and stochasticity on the prediction error (rsme) in the analyzed microcosm experiments (violet, green) and three variations of a chaotic model (May, 1975) with different amounts of noise (sigma) and different growth rates (r) in red.

References

    1. Anderson, C. N. K. , Hsieh, C. , Sandin, S. A. , Hewitt, R. , Hollowed, A. , Beddington, J. , May, R. M. , & Sugihara, G. (2008). Why fishing magnifies fluctuations in fish abundance. Nature, 452, 835–839. - PubMed
    1. Becks, L. , Hilker, F. M. , Malchow, H. , Jürgens, K. , & Arndt, H. (2005). Experimental demonstration of chaos in a microbial food web. Nature, 435, 1226–1229. - PubMed
    1. Benincà, E. , Ballantine, B. , Ellner, S. P. , & Huisman, J. (2015). Species fluctuations sustained by a cyclic succession at the edge of chaos. Proceedings of the National Academy of Sciences of the United States of America, 112, 6389–6394. - PMC - PubMed
    1. Berryman, A. A. , & Millstein, J. A. (1989). Are ecological systems chaotic — And if not, why not? Trends in Ecology & Evolution, 4, 26–28. 10.1016/0169-5347(89)90014-1 - DOI - PubMed
    1. Blasius, B. , Rudolf, L. , Weithoff, G. , Gaedke, U. , & Fussmann, G. F. (2020). Long‐term cyclic persistence in an experimental predator‐prey system. Nature, 577, 226–230. - PubMed

LinkOut - more resources