. 2022 Oct 13;13(12):1605-1613.
doi: 10.1039/d2md00251e. eCollection 2022 Dec 14.

Alkyltriphenylphosphonium turns naphthoquinoneimidazoles into potent membrane depolarizers against mycobacteria

Affiliations

Alkyltriphenylphosphonium turns naphthoquinoneimidazoles into potent membrane depolarizers against mycobacteria

Kevin Timothy Fridianto et al. RSC Med Chem. .

Abstract

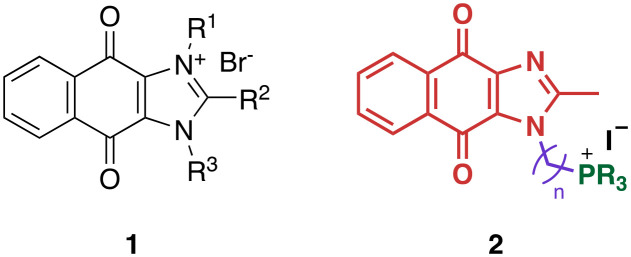
Due to its central role in energy generation and bacterial viability, mycobacterial bioenergetics is an attractive therapeutic target for anti-tuberculosis drug discovery. Building upon our work on antimycobacterial dioxonaphthoimidazoliums that were activated by a proximal positive charge and generated reactive oxygen species upon reduction by Type II NADH dehydrogenase, we herein studied the effect of a distal positive charge on the antimycobacterial activity of naphthoquinoneimidazoles by incorporating a trialkylphosphonium cation. The potency-enhancing properties of the linker length were affirmed by structure-activity relationship studies. The most active compound against M. tb H37Rv displayed good selectivity index (SI = 34) and strong bactericidal activity in the low micromolar range, which occurred through rapid bacterial membrane depolarization that resulted in depletion of intracellular ATP. Through this work, we demonstrated a switch of the scaffold's mode-of-action via relocation of positive charge while retaining its excellent antibacterial activity and selectivity.


Conflict of interest statement

There are no conflicts to declare.

Figures

Fig. 1
Fig. 1. General structure of dioxonaphthoimidazoliums 1, which generates ROS upon reduction by NDH-2. The general structure of trialkylphosphonium naphthoquinoneimidazole 2 is shown with the possible sites of modification highlighted in different colors: green, trialkylphosphonium; purple, aliphatic linker; red, naphthoquinoneimidazole scaffold.
Fig. 2
Fig. 2. Compounds synthesized for the structure–activity relationship study.
Scheme 1
Scheme 1. Reagents and conditions: (i) CH3COOH, reflux, o/n, 39%; (ii) NaH, Br(CH2)nCl, DMF, 0 °C – RT, o/n, 43–64%; (iii) refer to Table 1, (iv) SOCl2, reflux, 1 h.
Scheme 2
Scheme 2
Scheme 3
Scheme 3. Reagents and conditions: (i) Br(CH2)nCl, NaH, DMF, 0 °C to RT, o/n, (ii) KI, ACN, reflux 30 min, then PPh3, ACN, reflux, 3 d.
Scheme 4
Scheme 4. Reagents and conditions: (i) Br(CH2)nCl, NaH, DMF, 0 °C to RT, o/n, (ii) KI, ACN, reflux 30 min, then PPh3, ACN, reflux, 3 d.
Scheme 5
Scheme 5. Reagents and conditions: (i) TFA, reflux, o/n, 88%, (ii) Br(CH2)11Cl, NaH, DMF, 0 °C to RT, 49%, (iii) KI, PPh3, ACN, reflux, 5 d, 60%.
Scheme 6
Scheme 6. Reagents and conditions: (i) 38, EtOH, RT, 2 h, 49%, (ii) Ac2O, conc. H2SO4 (cat.), RT, 2 h, 84%, (iii) 7 N NH3 in MeOH, ACN, 45 °C, 2 h, 54%, (iv) 48% HBr, 1 : 1 EtOH/EtOAc, reflux, o/n, 60%, (v) TsCl, TEA, DCM, RT, 24 h, 60%, (vi) KI, PPh3, ACN, MW, 160 °C, 2 h, 70%.
Fig. 3
Fig. 3. Time-kill kinetics of 6. Mid-log phase M. bovis BCG diluted to OD600 = 0.1 was treated with test compounds at 4× MIC90 (6 = 5 μM, INH = 15 μM) and incubated at 37 °C with shaking. Diluted cultures were plated onto 7H10 agar plates for CFU enumeration at indicated time points. Experiment was repeated once yielding the same results. Result shown was from one representative experiment.
Fig. 4
Fig. 4. Redox effects of 6 and 7. 1,4-Naphthoquinone (NQ, MIC90 = 100 μM) and compounds 44–45 (MIC90 = 0.32 μM) were used as positive controls, while INH (MIC90 = 3.7 μM) was used as negative control. a) Dose response curves for the HRP assay. Drug-free samples were taken as 0% absorbance. Measurement was carried out in two independent experiments with three technical replicates for each compound. Results shown are from representative experiments. (b) Measured relative green fluorescence unit (GFU) of CellROX green normalized to OD600 upon generation of ROS. Mid-log phase M. bovis BCG was diluted to OD600 = 0.3, after which the culture was treated with test compounds for 1.5 hours and incubated at 37 °C, followed by treatment with dye for 30 min. (c) Absence of induction of the pfurA gene promoter by 6 and 7. The modified M. bovis BCG strain was grown to mid-log phase and diluted to OD600 = 0.4 prior to treatment with four different concentrations of test compounds for 24 hours at 37 °C. Experiments were performed at least twice independently. Results shown are from representative experiments. (d) Absence of activation of NADH oxidation by 7. Inverted membrane vesicles of M. smegmatis mc24517 A) WT or B) TB-ndh, which harbors an overexpression plasmid of the M. tb ndh gene, were treated with the indicated compounds. Dashed line represents the upper detection limit. Error bars represent standard deviation from triplicate measurements.
Fig. 5
Fig. 5. Membrane effects of 6 and 7. Mid-log phase M. bovis BCG was diluted to OD600 = 0.1 and treated with each compound at 4× MIC90. Compounds 8 and 9 were included as controls. (a) Changes in red/green ratio of DiOC2(3), which correlates to membrane potential, across different timepoints. (b) Changes in green/red ratio of SYTO®9/propidium iodide, which correlates to membrane integrity, across different timepoints. Green and red fluorescence were recorded at λex = 488 nm/λem = 530 nm and λex = 488 nm/λem = 630 nm respectively, and the ratios of the fluorogenic dye was calculated. Drug-free (DF) and RIF (4× MIC90 = 0.08 μM) samples were taken as negative controls while CCCP (5 μM) and 5% SDS were used as positive controls. Dashed line indicates ratios of DF and positive controls. (c) CFU of each treated culture over time. (d) Amount of ATP remaining upon treatment based on luminescence measurement. Dashed line reflects the ATP concentration of DF (untreated) sample at the start of the experiment. Means were significantly different than DF control, P < 0.01 (**), Student's t-test, GraphPad Prism, ver. 9. (e) Absence of induction of the piniBAC gene promoter after treatment with representative test compounds. The modified M. bovis BCG strain was grown to mid-log phase and diluted to OD600 = 0.4 prior to treatment with test compounds for 24 hours. Error bars depict the standard deviation based on triplicate measurements. Experiments were carried out at least twice independently. Results from representative experiments are shown.

References

    1. Global Tuberculosis Report 2021, World Health Organization, Geneva, 2021. Licence: CC BY-NC-SA 3.0 IGO
    1. Connolly L. E. Edelstein P. H. Ramakrishnan L. PLoS Med. 2007;4:e120. doi: 10.1371/journal.pmed.0040120. - DOI - PMC - PubMed
    1. Gupta R. Espinal M. Int. J. Tuberc. Lung Dis. 2003;7:410–414. - PubMed
    1. Fernandes G. F. S. Thompson A. M. Castagnolo D. Denny W. A. Dos Santos J. L. J. Med. Chem. 2022;65:7489–7531. doi: 10.1021/acs.jmedchem.2c00227. - DOI - PubMed
    1. Bald D. Villellas C. Lu P. Koul A. mBio. 2017;8(2):e00272-17. doi: 10.1128/mBio.00272-17. - DOI - PMC - PubMed