. 2023 Jan 19;24(1):bbac582.
doi: 10.1093/bib/bbac582.

CODA: a combo-Seq data analysis workflow

Affiliations

CODA: a combo-Seq data analysis workflow

Marta Nazzari et al. Brief Bioinform. .

Abstract

The analysis of the combined mRNA and miRNA content of a biological sample can be of interest for answering several research questions, like biomarkers discovery, or mRNA-miRNA interactions. However, the process is costly and time-consuming, separate libraries need to be prepared and sequenced on different flowcells. Combo-Seq is a library prep kit that allows us to prepare combined mRNA-miRNA libraries starting from very low total RNA. To date, no dedicated bioinformatics method exists for the processing of Combo-Seq data. In this paper, we describe CODA (Combo-seq Data Analysis), a workflow specifically developed for the processing of Combo-Seq data that employs existing free-to-use tools. We compare CODA with exceRpt, the pipeline suggested by the kit manufacturer for this purpose. We also evaluate how Combo-Seq libraries analysed with CODA perform compared with conventional poly(A) and small RNA libraries prepared from the same samples. We show that using CODA more successfully trimmed reads are recovered compared with exceRpt, and the difference is more dramatic with short sequencing reads. We demonstrate how Combo-Seq identifies as many genes and fewer miRNAs compared to the standard libraries, and how miRNA validation favours conventional small RNA libraries over Combo-Seq. The CODA code is available at https://github.com/marta-nazzari/CODA.

Keywords: CODA; Combo-Seq; RNA-Seq; exceRpt; mRNA; miRNA.


Figures

Figure 1
Figure 1
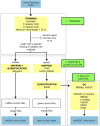
Schematic representation of CODA: fastq or fastq.gz sequencing files are used as input and 5′ and 3′ sequencing adapters are removed using Cutadapt. Reads shorter than 15 nt are also discarded. This trimming step retains also reads with a partial or missing 3′ adapter (a point further discussed in the section ‘Trimming and read length distribution’). Mapping and quantification of miRNA is then performed using miRge3.0. Genes mapping and quantification is then performed with RSEM using STAR as aligner (which follows the criteria of the ENCODE3’s STAR-RSEM pipeline). As each tool outputs a single file per sample, the count files are then merged into a single table for genes or miRNAs. The last step uses the BBMap suite and FastQC to gather some summary statistics on the trimmed/mapped reads and MultiQC is used to compile all information into a .html report.
Figure 2
Figure 2
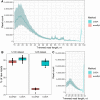
(A) Read length distribution of 1 × 100 dataset processed with exceRpt (red) or trimmed with CODA (blue). (B) Distribution of trimmed reads expressed as percentage of total raw read count. (C) Read length distribution of 1 × 35 dataset processed with exceRpt (red) or trimmed with CODA (blue). For plots A and C, the line represents the average count, while the edges of the shaded area correspond to the highest and lowest count among the replicates.
Figure 3
Figure 3
PCA plots showing PC1 and PC2 of PCA analysis carried out on variance-stabilized normalized gene counts for (A) 1 × 100 and (B) 1 × 35 samples processed with either pipeline. Plots showing PC1 and PC2 of PCA analysis carried out on variance-stabilized transformed miRNA counts for (C) 1 × 100 and (D) 1 × 35 samples processed with either pipeline (cyan = CODA, red = exceRpt).
Figure 4
Figure 4
Pearson correlation of normalized gene counts for (A) 1 × 100 and (B) 1 × 35 samples. Pearson correlation of normalized miRNA counts for (C) 1 × 100 and (D) 1 × 35 samples.
Figure 5
Figure 5
Average biotype composition of (A) 1 × 100 (six replicates) and (B) 1 × 35 (five replicates) DMSO control samples processed with either CODA or exceRpt. The values are expressed as percentage of total gene read counts. Read length distribution for (C) 1 × 100 and (D) 1 × 35 datasets expressed as percentage of total mapped reads grouped per biotype. Only the biotypes representing at least 1% of total reads on average are reported.
Figure 6
Figure 6
(A) PCA plot of variance-stabilized transformed gene counts of Nthy-ori 3-1 samples prepared using Combo-Seq or poly(A) libraries. (B) PCA plot of variance-stabilized transformed miRNA counts of Nthyori 3-1 samples prepared using Combo-Seq or small RNA libraries. (C) Person correlation of normalized gene counts for Nthy-ori 3-1 samples prepared with Combo-Seq or poly(A) libraries. (D) Spearman correlation of ranked miRNA counts of Nthy-ori 3-1 samples prepared using the Combo-Seq kit a small RNA kit. Combo-Seq libraries were sequenced on a 1 × 100 single-end flowcell, poly(A) libraries on a 2 × 200 paired-end flowcell and small RNA libraries on a 1 × 35 single-end flowcell.
Figure 7
Figure 7
(A) Overlap of DE genes after BAP treatment compared to the DMSO control in datasets prepared with Combo-Seq libraries (red) or poly(A) (yellow) libraries. (B) Results of GO (biological process) and (C) Reactome pathway analyses performed on the DE genes in BAP versus DMSO samples prepared with either Combo-Seq (red) or poly(A) (yellow) libraries. The top 10 GO terms with lowest P-adjusted value in each group were selected and then plotted together. If two or more terms had the same P-adjusted value, all terms were reported. The dotted grey line corresponds to the set FDR value of 0.01. (D) Overlap of DE miRNA after BAP treatment compared to the DMSO control in datasets prepared with Combo-Seq libraries (red) or small RNA (blue) libraries. (E) Scatterplot representing the rankings of miRNA in mean read count of Nthy-ori 3-1 DMSO control samples. The mean read count was calculated as the average of the replicate samples prepared with either a Combo-Seq or small RNA library prep kit. miRNAs were then ranked based on their level of expression in each condition (most highly expressed miRNA = highest rank). Each dot in the plot represents a miRNA, and miRNAs for which the mean count was 0 in both conditions were removed. A total of 1104 miRNAs were ranked and miRNAs with the same level of expression were assigned the same rank. The miRNA selected for qPCR validation are highlighted in red. (F) RT-qPCR analysis of the selected miRNAs. The bar represents the average Ct value for each sample, and the error bars represent the mean ± sd. Each sample was measured in four technical replicates.

References

    1. Boivin V, Faucher-Giguere L, Scott M, et al. . The cellular landscape of mid-size noncoding RNA. Wiley Interdiscip Rev RNA 2019;10(4):e1530. - PMC - PubMed
    1. Godoy PM, Bhakta NR, Barczak AJ, et al. . Large differences in small RNA composition between human biofluids. Cell Rep 2018;25(5):1346–58. - PMC - PubMed
    1. Potemkin N, Cawood SMF, Treece J, et al. . A method for simultaneous detection of small and long RNA biotypes by ribodepleted RNA-Seq. Sci Rep 2022;12(1):621. - PMC - PubMed
    1. Nolte-'t Hoen EN, Buermans HP, Waasdorp M, et al. . Deep sequencing of RNA from immune cell-derived vesicles uncovers the selective incorporation of small non-coding RNA biotypes with potential regulatory functions. Nucleic Acids Res 2012;40(18):9272–85. - PMC - PubMed
    1. Boivin V, Deschamps-Francoeur G, Couture S, et al. . Simultaneous sequencing of coding and noncoding RNA reveals a human transcriptome dominated by a small number of highly expressed noncoding genes. RNA 2018;24(7):950–65. - PMC - PubMed

Publication types