. 2022 Nov 30;7(4):219.
doi: 10.3390/biomimetics7040219.

Macromolecules Absorbed from Influenza Infection-Based Sera Modulate the Cellular Uptake of Polymeric Nanoparticles

Affiliations

Macromolecules Absorbed from Influenza Infection-Based Sera Modulate the Cellular Uptake of Polymeric Nanoparticles

Daniel Nierenberg et al. Biomimetics (Basel). .

Abstract

Optimizing the biological identity of nanoparticles (NPs) for efficient tumor uptake remains challenging. The controlled formation of a protein corona on NPs through protein absorption from biofluids could favor a biological identity that enables tumor accumulation. To increase the diversity of proteins absorbed by NPs, sera derived from Influenza A virus (IAV)-infected mice were used to pre-coat NPs formed using a hyperbranched polyester polymer (HBPE-NPs). HBPE-NPs, encapsulating a tracking dye or cancer drug, were treated with sera from days 3-6 of IAV infection (VS3-6), and uptake of HBPE-NPs by breast cancer cells was examined. Cancer cells demonstrated better uptake of HBPE-NPs pre-treated with VS3-6 over polyethylene glycol (PEG)-HBPE-NPs, a standard NP surface modification. The uptake of VS5 pre-treated HBPE-NPs by monocytic cells (THP-1) was decreased over PEG-HBPE-NPs. VS5-treated HBPE-NPs delivered a cancer drug more efficiently and displayed better in vivo distribution over controls, remaining stable even after interacting with endothelial cells. Using a proteomics approach, proteins absorbed from sera-treated HBPE-NPs were identified, such as thrombospondin-1 (TSP-1), that could bind multiple cancer cell receptors. Our findings indicate that serum collected during an immune response to infection is a rich source of macromolecules that are absorbed by NPs and modulate their biological identity, achieving rationally designed uptake by targeted cell types.

Keywords: drug delivery; nanomedicine; paclitaxel; protein corona; tumor.


Conflict of interest statement

ARK is a shareholder in Seva Therapeutics, Inc. No competing interests are among the other authors.

Figures

Figure 1
Figure 1
HBPE-NPs pre-treated with sera collected from IAV-infected mice are non-toxic. (A) Scheme showing the process of IAV infection in C57BL/6 mice, correlating the phase of the immune response with weight loss. (BD) MTT viability assay was performed to assess the toxicity of sera-coated NPs. MDA-MB-231 cells (B), HUVECs (C), and THP-1 cells (D) were treated with vehicle (water), HBPE-NPs pre-coated with sera collected from day 3 post-IAV infection [HBPE-NPs (VS3)], day 4 post-IAV infection [HBPE-NPs (VS4)], day 5 post-IAV infection [HBPE-NPs (VS5)], or day 6 post-IAV infection [HBPE-NPs (VS6)]. Data represent mean ± standard deviation (n = 3).
Figure 2
Figure 2
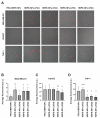
Increased cancer cell uptake and decreased monocyte uptake were observed with HBPE-NPs pre-treated with sera collected from mice at the later stages of the IAV infection. (A) HBPE-NPs (NPs) pre-coated with VS3-6 were compared to PEG-HBPE-NPs. Representative confocal microscopic images (upper plane) are shown of MDA-MB-231 cells (upper row), HUVEC cells (middle row), and THP-1 cells (bottom row). In columns are cells treated with DiI dye-encapsulated PEG-HBPE-NPs (first column), HBPE-NPs (VS3) (second column), HBPE-NPs (VS4) (third column), HBPE-NPs (VS5) (fourth column), and HBPE-NPs (VS6) (fifth column). Red fluorescence (DiI dye) is indicative of nanoparticle uptake in cells. The scale bar represents 50, 200, and 50 μm for MDA-MB-231 cells, HUVEC cells, and THP-1 cells, respectively. Images were acquired with a Zeiss LSM 710 microscope at 20× (MDA-MB-231 and THP-1 cells) and 10× (HUVECs) magnifications. (BD) Red fluorescence (DiI dye) quantification bar graphs of (B) MDA-MB-231, (C) HUVEC, and (D) THP-1 cells treated with PEG-HBPE-NPs, HBPE-NPs (VS3), HBPE-NPs (VS4), HBPE-NPs (VS5) or HBPE-NPs (VS6) after 24 h. Bar graphs represent the average DiI fluorescence per cell. Quantification data originate from images taken by a Cytation 5 Cell Imaging Multi-Mode Reader (representative images in Figure S2) to capture total nanoparticle fluorescence. MDA-MB-231 and HUVEC fluorescence data were acquired from a minimum of 100 cells. THP-1 fluorescence data were acquired from a minimum of 50 cells. Fluorescence was quantified using Zen Blue software. Data represent mean ± standard deviation. * p-value <0.001, ** p-value = 0.0034 and *** p-value = 0.0199 relative to PEG-HBPE-NPs. Representative data from three experimental replicates are shown.
Figure 3
Figure 3
Increased Taxol-mediated toxicity of breast cancer cells when the drug is delivered using HBPE-NPs coated with sera collected from IAV-infected mice. MTT viability assay was carried out to evaluate the toxicity of Taxol-loaded HBPE-NPs. MDA-MB-231 cells were treated with PBS vehicle, free Taxol, PEG-HBPE-NPs, HBPE-NPs (VS3), HBPE-NPs (VS4), HBPE-NPs (VS5), or HBPE-NPs (VS6). Data represent mean ± standard deviation (n = 3). * p-value < 0.05 relative to PEG-HBPE-NPs.
Figure 4
Figure 4
HBPE-NPs pre-treated with sera from IAV-infected mice are taken up by breast cancer cells after interaction with an endothelial layer. (A) Transwell experiment in which HUVECs (top chamber) were treated with DiI-loaded HBPE-NPs, and uptake was assessed by MDA-MB-231 cells (bottom chamber). Representative confocal microscopic images of MDA-MB-231 cells are shown after 24 h treatment of HUVECs with PEG-HBPE-NPs, HBPE-NPs (VS3), HBPE-NPs (VS4), HBPE-NPs (VS5), and HBPE-NPs (VS6). The scale bar represents 50 μm. Images were acquired at 20× magnification. (B) Red fluorescence (DiI nanoparticle presence) quantification bar graphs of bottom chamber MDA-MB-231cells after 24 h post-treatment of top chamber HUVECs with PEG-HBPE-NPs, HBPE-NPs (VS3), HBPE-NPs (VS4), HBPE-NPs (VS5), or HBPE-NPs (VS6). Average DiI fluorescence per cell was used for quantification from images of 100 cells taken by a Cytation 5 Cell Imaging Multi-Mode Reader (see Figure S4 for representative images). Fluorescence was quantified using Zen blue software. Data represent mean ± standard deviation. * p-value < 0.0001, ** p-value = 0.0002, and *** p-value = 0.0028 relative to PEG-NPs. Representative experiments from three replicates are shown.
Figure 5
Figure 5
Biodistribution of HBPE-NPs in mice is modulated by pre-treatment with VS5. Nu/Nu nude mice were orthotopically injected with 8 × 10⁵ MDA-MB-231 cells in the mammary fat pad. Upon tumors reaching 1000 mm3, mice were intravenously injected with DiR dye-encapsulated PEG-HBPE-NPs, HBPE-NPs, and HBPE-NPs (VS5) and imaged 7 h post-treatment. Images were acquired with an IVIS Lumina S5 and quantified with Living Image software. Fluorescence concentrated in each organ (nanoparticle presence) was quantified relative to PEG-HBPE-NPs; (A) bar graphs (upper panels) and (B) organ images (lower panels). Images represent nanoparticle uptake (DiR fluorescence) in the tumor, heart, lungs, spleen, kidneys, and liver. Blue color constitutes low nanoparticle accumulation and red/yellow color constitutes high nanoparticle accumulation. Data represent mean ± standard deviation (n = 3). * p-value < 0.05, ** p-value = 0.0034 and *** p-value = 0.0199 relative to HBPE-NPs.
Figure 6
Figure 6
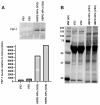
TSP-1 is found in the protein corona formed on HBPE-NPs after treatment with VS5. Proteins absorbed by HBPE-NPs treated with VS3 and VS5 were assessed by SDS-PAGE gels. (A) TSP-1 presence in sera alone or on NPs was determined using an anti-TSP-1 antibody (upper panel). The antibody signal was normalized to total protein and quantified using LI-COR Image Studio Lite software (graph, lower panel). (B) Total protein per lane was evaluated using REVERT total protein staining. HBPE-NPs were treated with sera at a ratio of 0.1 mg nanoparticle: 20 μg sera. A Precision-Plus Protein Dual Color protein reference ladder was used for molecular weight (MW) comparison. Data shown are representative of two experiments. Raw data is shown in Figure S6. Abbreviations: TSP-1 (thrombospondin-1).

Similar articles

Cited by

References

    1. Wang W., Huang Z., Li Y., Wang W., Shi J., Fu F., Huang Y., Pan X., Wu C. Impact of particle size and pH on protein corona formation of solid lipid nanoparticles: A proof-of-concept study. Acta Pharm. Sin. B. 2021;11:1030–1046. doi: 10.1016/j.apsb.2020.10.023. - DOI - PMC - PubMed
    1. Pustulka S.M., Ling K., Pish S.L., Champion J.A. Protein Nanoparticle Charge and Hydrophobicity Govern Protein Corona and Macrophage Uptake. ACS Appl. Mater. Interfaces. 2020;12:48284–48295. doi: 10.1021/acsami.0c12341. - DOI - PubMed
    1. Madathiparambil Visalakshan R., Gonzalez Garcia L.E., Benzigar M.R., Ghazaryan A., Simon J., Mierczynska-Vasilev A., Michl T.D., Vinu A., Mailander V., Morsbach S., et al. The Influence of Nanoparticle Shape on Protein Corona Formation. Small. 2020;16:e2000285. doi: 10.1002/smll.202000285. - DOI - PubMed
    1. Gref R., Luck M., Quellec P., Marchand M., Dellacherie E., Harnisch S., Blunk T., Muller R.H. ‘Stealth’ corona-core nanoparticles surface modified by polyethylene glycol (PEG): Influences of the corona (PEG chain length and surface density) and of the core composition on phagocytic uptake and plasma protein adsorption. Colloids Surf. B Biointerfaces. 2000;18:301–313. doi: 10.1016/S0927-7765(99)00156-3. - DOI - PubMed
    1. Kozma G.T., Shimizu T., Ishida T., Szebeni J. Anti-PEG antibodies: Properties, formation, testing and role in adverse immune reactions to PEGylated nano-biopharmaceuticals. Adv. Drug Deliv. Rev. 2020;154–155:163–175. doi: 10.1016/j.addr.2020.07.024. - DOI - PubMed

LinkOut - more resources