. 2022 Dec 19;29(12):9970-10017.
doi: 10.3390/curroncol29120783.

Abstracts of the Cell Therapy Transplant Canada 2022 Annual Conference

Affiliations

Abstracts of the Cell Therapy Transplant Canada 2022 Annual Conference

Stephanie A Maier et al. Curr Oncol. .

Abstract

On behalf of Cell Therapy Transplant Canada (CTTC), we are pleased to present the Abstracts of the CTTC 2022 Annual Conference. The conference was held in-person 15-18 June 2022, in Niagara Falls, Ontario. Poster authors presented their work during a lively and engaging welcome reception on Thursday, 16 June, and oral abstract authors were featured during the oral abstract session in the afternoon on Friday, 17 June 2022. Thirty-three (33) abstracts were selected for presentation as posters and six (6) as oral presentations. The top abstracts in each of four (4) categories, (1) Basic/Translational sciences, (2) Clinical Trials/Observations, (3) Laboratory/Quality, and (4) Pharmacy/Nursing/Other Transplant Support, received awards for both the oral and poster presentations. All of these were marked as "Award Recipient" with the relevant category. We congratulate all the presenters on their research and contribution to the field.

Keywords: GVHD; acute lymphoblastic leukemia; acute myeloid leukemia; cell therapy; hematopoietic stem cell transplantation; lymphoma; myelodysplastic syndrome.


Conflict of interest statement

T.B. was a co-author on abstract 5 and 17, J.B. was a co-author on abstract 5, C.B. was a co-author on abstract 20 and 38, A.D. was a co-author on abstract 19, M.E. was a co-author on abstract 11, W.L. was a co-author on abstract 14, 23 and 24, K.R.S. was a co-author on abstract 1, 4 and 25, and J.-S.D. was a co-author on abstract 8, 9 and 18. S.A.M., S.B., G.C., G.A.D., A.G.-H., A.L., K.L., L.M.G., R.V.N. and D.W. declare no conflict of interest. All Abstract Review Committee members abstained from adjudicating abstracts in which they were a co-author.

Figures

Figure 1
Figure 1
Evaluation of CD56brightCD16 NKreg cell ability to suppress CD4+ T cell proliferation. The graph is representative of the results of five experiments using cells derived from five healthy donors for the NK cell suppression assays, and two experiments using cells derived from two healthy donors for the Treg cell suppression assay. The error bars are indicative of standard deviation, and the brackets are indicative of significant differences in suppression between the three different cell groups at all ratios tested (p < 0.05 = *, p < 0.0005 = ***). The graph directly compares the suppressive capacity of CD56brightCD16 NKreg cells, CD56dimCD16+ NK cells, and Treg cells towards allogeneic CD4+ T cell proliferation at the 1:1, 1:2, 1:4, and 1:8 ratios as compared to the activated CD4+ T cells. The CD4+ T cell division index is scaled to 100% for calculation purposes, with all other condition indices scaled accordingly. This calculation was completed using the following standard formula: percentage of suppression = 1 − (division index of responder cells cultured with suppressor cells/division index of responder cells cultured without suppressor cells) × 100%.
Figure 2
Figure 2
Evaluation of cell-to-cell contact dependence for CD56brightCD16 NKreg cell suppression. The graph is representative of the results of five different experiments using cells derived from five different donors. The error bars are indicative of standard deviation, and the brackets are indicative of significant differences in the suppressive capacity of NKreg cells co-cultured with CD4+ T cells in a standard plate or a transwell plate as compared to the CD4+ T cell control (p < 0.0005 = ***, NS = not significant). The graph directly compares the suppressive capacity of the CD56brightCD16 NKreg cells towards allogeneic CD4+ T cells in a standard 96-well plate versus in a transwell 96-well plate.
Figure 1
Figure 1
Patient demographics n = 232 patients.
Figure 2
Figure 2
Subgroup evaluation from 2015–2018. Total n = 108; Adenovirus negative = 80, Adenovirus positive = 28.
Figure 3
Figure 3
Heathy state versus transplant. Adenovirus infection following transplant produces elevated IL-22 and Reg3a, and reciprocal reduction of IL-22BP, triggering a proinflammatory state.
Figure 1
Figure 1
CD34+ content in autologous, healthy donor allogeneic and cord blood stem cell products. p < 0.05 = **, p < 0.0005 = ****.
Figure 1
Figure 1
CIR according to DRSS score (l = low, i1-2 = intermediate 1 & 2, hvh = high & very high).
Figure 1
Figure 1
Cumulative incidence of non-relapse mortality with donors aged <50 years vs. ≥50 years (a) <60 years vs. ≥60 years (b). Adjusted hazard ratios (HR) of various donor ages for the association with non-relapse mortality (NRM) (c).
Figure 1
Figure 1
MMRM-based estimated changes from baseline by treatment arm. * p = 0.05; Axi-cel, axicabtagene ciloleucel; BL, baseline; CI, confidence interval; EORTC, European Organisation for Research and Treatment of Cancer; MMRM, mixed-effect model with repeated measures; SOC, standard of care.
Figure 1
Figure 1
Baseline characteristics of tisagenlecleucel (ELARA) versus SOC (ReCORD-FL) Cohorts. SMD = standard mean difference. a Enrolled patients are those who met inclusion/exclusion criteria and had a leukapheresis product accepted for manufacturing, regardless of infusion status (only 1 enrolled patient was not infused). b Sample size after weighting (i.e., sum of weights) was 99 for the ReCORD study and effective sample size was 95.
Figure 2
Figure 2
Indirect comparison of tisagenlecleucel (ELARA) versus SOC (ReCORD-FL) clinical outcomes. CI = confidence interval; NR = not reached; OS = overall survival; PFS = progression-free survival; TTNT = time to next treatment. Note: Outcomes across groups were compared using the weighting by odds method to adjust for differences in the following pre-specified baseline characteristics and prognostic factors: age, gender, geographic region, prior autologous hematopoietic stem cell transplant, number of previous LoTs, disease stage at initial FL diagnosis, time between diagnosis and treatment, extent of nodal involvement, double refractoriness at treatment start, and POD24 status. 1 PFS estimation considers new anti-cancer therapy as a progression event (in the absence of clinician-assessed progression or death before start of a new therapy). 2 TTNT estimation considers death as an event. 3 Hazard ratio calculated by weighted Cox proportional hazard model for indirect comparison between the ELARA and ReCORD-FL. 4 Sample size after weighting (i.e., sum of weights) was 99 and effective sample size was 95 for the main analysis. 5 Sample size after weighting (i.e., sum of weights) was 95 and effective sample size was 37 for the subgroup analysis.
Figure 1
Figure 1
Transplant characteristics.
Figure 1
Figure 1
Swimmer’s plot of first 30 patients treated with CLIC-1901 from time of cell infusion.
Figure 1
Figure 1
Efficacy of inotuzumab ozogamicin at a starting does of 1.2 mg/m2/cycle. * Unless otherwise noted; Among patients achieving CR/CRi (N = 11). CR = complete remission; CRi = complete remission with incomplete hematologic recovery; HCT = hematopoietic cell transplantation; mo = months; InO = inotuzumab ozogamicin; MRD = minimal residual disease, assessed using flow cytometry at Navigate, Carlsbad, CA, United States.
Figure 2
Figure 2
TEAEs occurring in ≥10% patients and AEs of special interest with inotuzumab ozogamicin at a starting dose of 1.2 mg/m2/cycle. * Includes the system organ class blood and lymphatic system disorders; Includes the system organ class infections and infestations. AE = adverse event; ALT = alanine aminotransferase; AST = aspartate aminotransferase; SOS = sinusoidal obstruction syndrome; TEAE = treatment–emergent adverse event.
Figure 1
Figure 1
Incidence of moderate to severe cGVHD after tandem auto/allo HCT in recipients of BTZ or not.
Figure 2
Figure 2
Systemic immunosuppression burden after transplant in patients with (a) or without (b) BTZ maintenance.
Figure 1
Figure 1
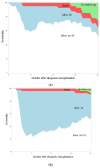
Comparison of survival probability between donor sources.
Figure 1
Figure 1
Ishikawa Fish Bone diagram detailing root causes of incomplete compliance.
Figure 2
Figure 2
Pareto Chart outlining major causes attributed by patients to problems accessing health care providers and the financial burden of certain vaccines. The most frequent causes are coloured.
Figure 3
Figure 3
Compliance distribution before and after intervention.
Figure 1
Figure 1
Examples of Matrix Variables and Pathogens. vCJD, Variant Creutzfeldt–Jakob Disease; PBMCs, Peripheral Blood Mononuclear Cells; TC, Transplant Centre.

Publication types

LinkOut - more resources