. 2023 Apr 20;32(9):1483-1496.
doi: 10.1093/hmg/ddac303.

An altered extracellular matrix-integrin interface contributes to Huntington's disease-associated CNS dysfunction in glial and vascular cells

Affiliations

An altered extracellular matrix-integrin interface contributes to Huntington's disease-associated CNS dysfunction in glial and vascular cells

Sarah J Hernandez et al. Hum Mol Genet. .

Abstract

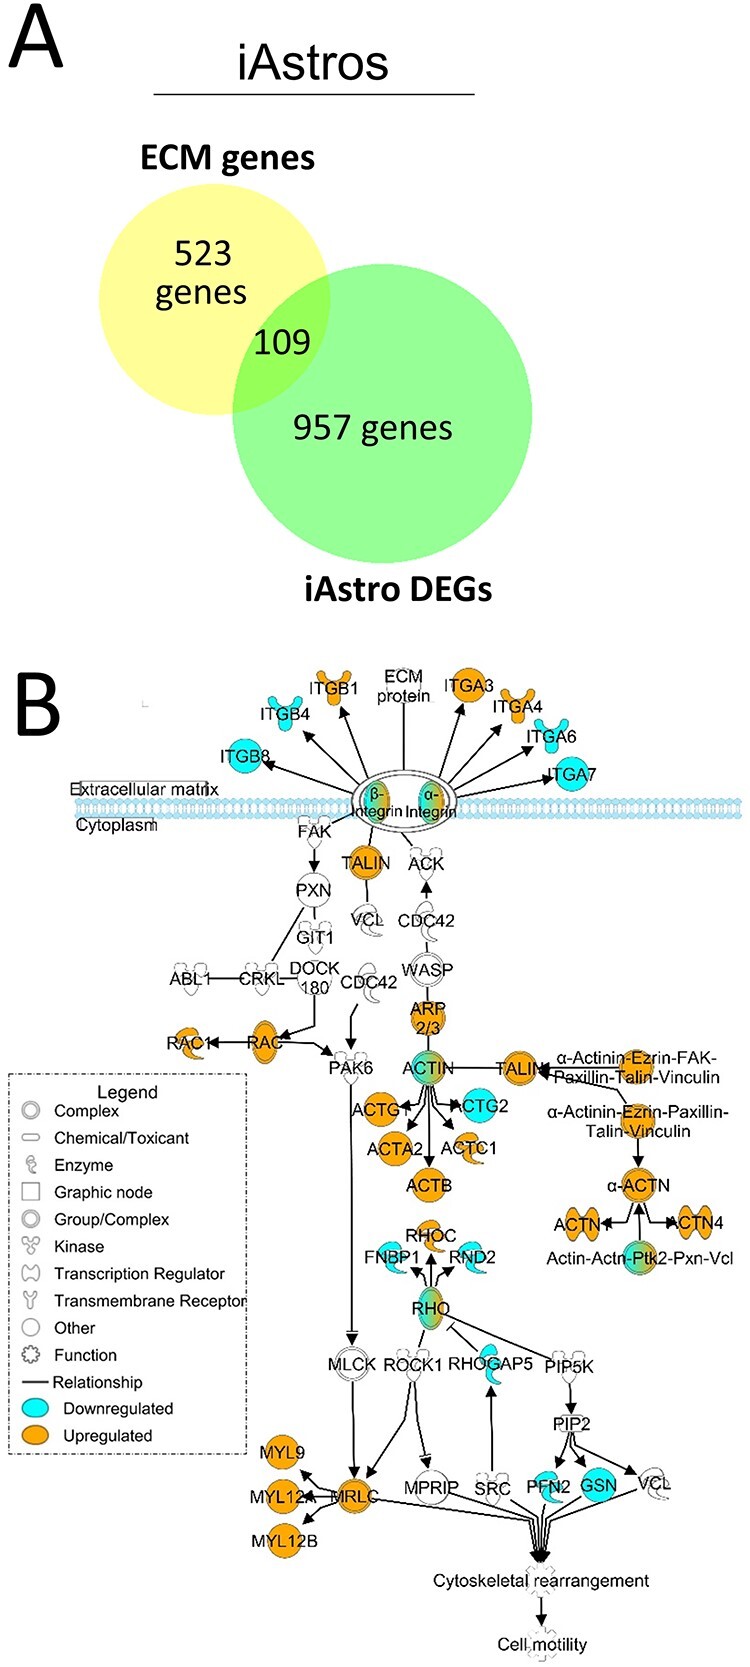
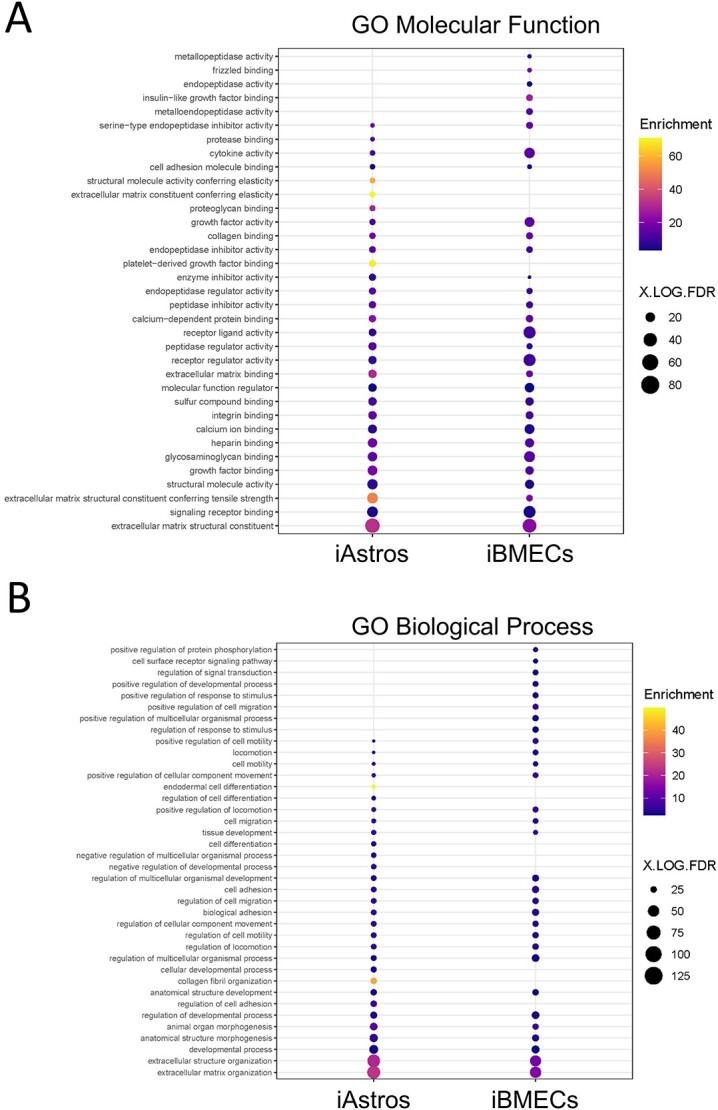
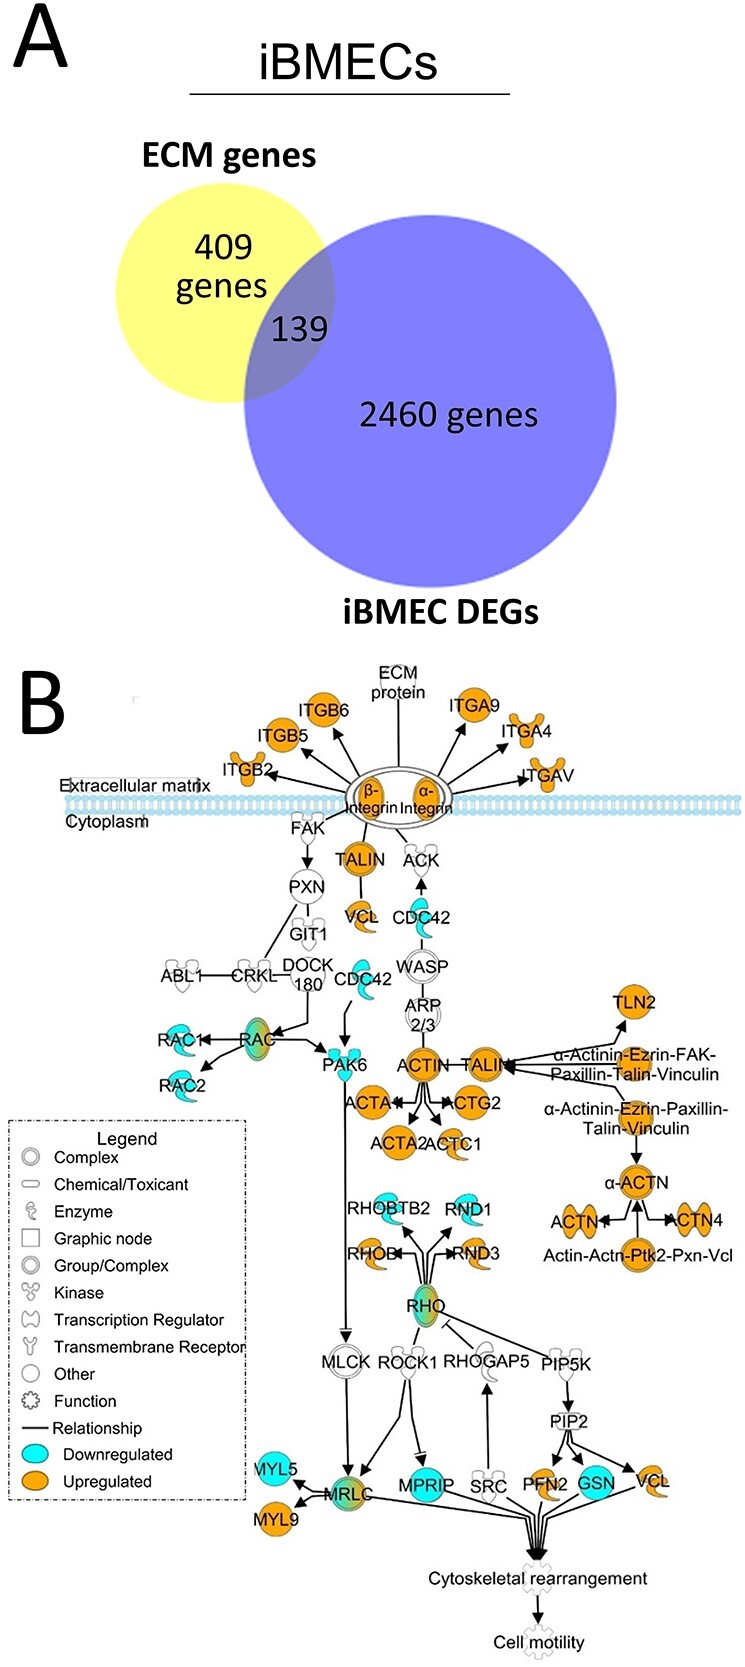
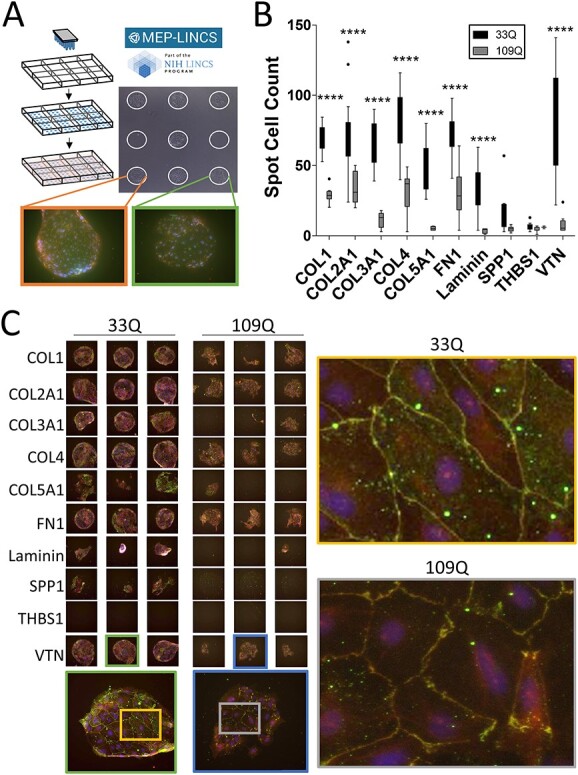
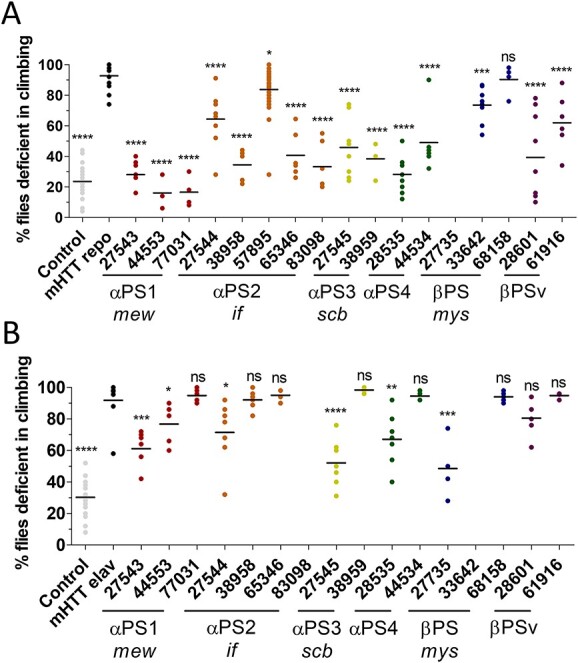
Astrocytes and brain endothelial cells are components of the neurovascular unit that comprises the blood-brain barrier (BBB) and their dysfunction contributes to pathogenesis in Huntington's disease (HD). Defining the contribution of these cells to disease can inform cell-type-specific effects and uncover new disease-modifying therapeutic targets. These cells express integrin (ITG) adhesion receptors that anchor the cells to the extracellular matrix (ECM) to maintain the integrity of the BBB. We used HD patient-derived induced pluripotent stem cell (iPSC) modeling to study the ECM-ITG interface in astrocytes and brain microvascular endothelial cells and found ECM-ITG dysregulation in human iPSC-derived cells that may contribute to the dysfunction of the BBB in HD. This disruption has functional consequences since reducing ITG expression in glia in an HD Drosophila model suppressed disease-associated CNS dysfunction. Since ITGs can be targeted therapeutically and manipulating ITG signaling prevents neurodegeneration in other diseases, defining the role of ITGs in HD may provide a novel strategy of intervention to slow CNS pathophysiology to treat HD.


Conflict of interest statement

None declared.

Figures

Figure 1
Figure 1
Matrix-associated and matrix-interacting genes are dysregulated in HD iAstros. (A) Overlap of iAstro DEGs with ECM genes expected to be expressed in astrocytes (6.87% of DEGs were ECM-related compared with 3.34% of ECM-related genes found within iAstros; chi = 112.8, P < 0.0001; N = 1, n = 2). Chi square with Yate’s correction. (B) IPA of the ITG signaling pathway overlaid with the RNAseq DEG list comparing HD with control iAstros. Blue genes are downregulated; orange are upregulated. N = 2.
Figure 2
Figure 2
Aberrant matrisome contributes to HD pathogenesis. GO analysis of biological functions (A) and processes (B) showing enrichment for terms with known association to HD pathogenesis in iAstros (left) and iBMECs (right). Figure made using GOrilla comparing a background list of genes expected to be expressed in specified cell types with genes of the matrisome that were dysregulated in HD compared with control samples. Gene enrichment was plotted.
Figure 3
Figure 3
Matrix-associated and matrix-interacting genes are dysregulated in HD iBMECs. (A) Overlap of iBMEC DEGs with ECM genes expected to be expressed in BMECs (5.37% of DEGs were ECM-related compared with 4.41% of ECM-related genes found within iBMECs; chi = 3.85, P < 0.0497; N = 2, n = 2). Chi square with Yate’s correction. (B) IPA of the ITG signaling pathway overlaid with the RNAseq DEG list comparing HD with control iBMECs. Blue genes are downregulated; orange are upregulated. N = 2.
Figure 4
Figure 4
HD iBMECs have reduced adhesion and morphological deficits on ITG ligands. (A) MEMA schematic. Each spot is ~300 μm and is a unique ECM substrate plated at random on the array in multiple technical replicates. iBMECs are seeded, fixed and stained. Certain spots prevent TJ formation (green box), whereas others enabled TJ formation (orange box). (B) 33Q and 109Q iBMECs were assessed for adhesion by counting the number of Hoechst-positive cells per spot. All ITG ligands from the MEMA are shown. Two-way ANOVA with Bonferroni post-hoc. N = 1, n ≥ 11. (C) iBMECs stained for TJ proteins CLDN5 (green) and ZO1 (red) with a DAPI counterstain. Three representative technical replicates are shown. All technical replicates can be found in Supplementary Material, Figure S2. All ITG ligands shown (left). Morphological disruption of TJs is shown on VTN (right). N = 1, n ≥ 11. Each spot is ~300 μm.
Figure 5
Figure 5
HD-associated CNS deficits are suppressed when ITG expression is reduced in glial, but not neuronal, cell populations. An HD fragment Drosophila model (HTT231NT128Q) was crossed with lines that reduce expression of various ITGs (X-axis) expressed using the Gal4 system. ITG orthologs are listed on the X-axis. Numbers represent BDSC stock numbers. A climbing assay was performed (A) at day 10 when mHTT was expressed in glia and (B) day 15 when mHTT was expressed in neurons. When mHTT was expressed in either glia (gray dots, A) or neurons (gray dots, B), most flies were unable to climb past 5 cm. When ITG mutants were crossed with flies that express mHTT only in glia (black dots, A), the climbing deficit was largely suppressed. When ITG mutants were crossed with flies that express mHTT only in neurons (black dots, B), the climbing deficit is less suppressed overall. Horizontal lines represent mean. One tailed, unpaired t-tests were performed comparing each line to the mHTT-expressing line within each data set. P-values for significant differences are: ****P<0.0001, ***P = 0.001. (A) 57895 P = 0.0174, 68158 P = 0.3103. (B) 27543 P = 0.0002, 44553 P = 0.0409, 27544 P = 0.0195, 28535 P = 0.0044, 27735 P = 0.0006. All flies were raised at 25°C. N = 3–9 with 8–10 animals per replicate, n=5.

References

    1. MacDonald, M.E., Ambrose, C.M., Duyao, M.P., Myers, R.H., Lin, C., Srinidhi, L., Barnes, G., Taylor, S.A., James, M. and Groot, N. (1993) A novel gene containing a trinucleotide repeat that is expanded and unstable on Huntington’s disease chromosomes. Cell, 72, 971–983. - PubMed
    1. Ross, C.A. and Tabrizi, S.J. (2011) Huntington’s disease: from molecular pathogenesis to clinical treatment. Lancet Neurol., 10, 83–98. - PubMed
    1. Khakh, B.S., Beaumont, V., Cachope, R., Munoz-Sanjuan, I., Goldman, S.A.Grantyn, R. et al. (2017) Unravelling and exploiting astrocyte dysfunction in Huntington’s disease. Trends Neurosci., 40, 422–437. - PMC - PubMed
    1. Wilton, D.K. and Stevens, B. (2020) The contribution of glial cells to Huntington’s disease pathogenesis. Neurobiol. Dis., 143, 104963. - PMC - PubMed
    1. Benraiss, A., Wang, S., Herrlinger, S., Li, X., Chandler-Militello, D., Mauceri, J., Burm, H., Toner, M., Osipovitch, M., Jim Xu, Q. et al. (2016) Human glia can both induce and rescue aspects of disease phenotype in Huntington disease. Nature communications, 71, 1–13. - PMC - PubMed

Publication types

MeSH terms