. 2022 Dec 22;18(12):e1010761.
doi: 10.1371/journal.pcbi.1010761. eCollection 2022 Dec.

An individualized causal framework for learning intercellular communication networks that define microenvironments of individual tumors

Affiliations

An individualized causal framework for learning intercellular communication networks that define microenvironments of individual tumors

Xueer Chen et al. PLoS Comput Biol. .

Abstract

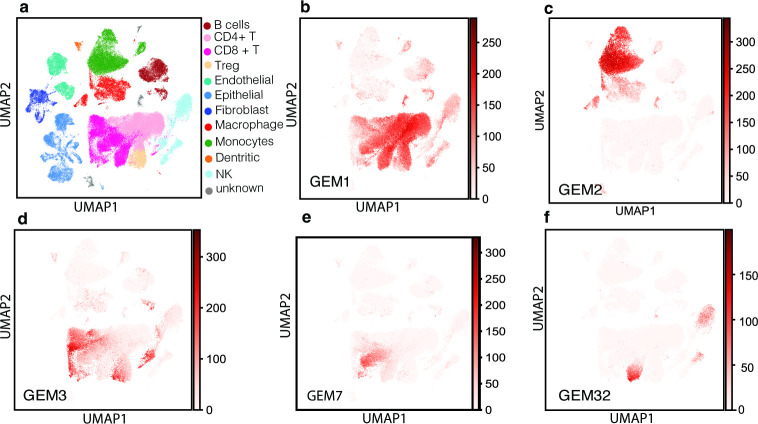
Cells within a tumor microenvironment (TME) dynamically communicate and influence each other's cellular states through an intercellular communication network (ICN). In cancers, intercellular communications underlie immune evasion mechanisms of individual tumors. We developed an individualized causal analysis framework for discovering tumor specific ICNs. Using head and neck squamous cell carcinoma (HNSCC) tumors as a testbed, we first mined single-cell RNA-sequencing data to discover gene expression modules (GEMs) that reflect the states of transcriptomic processes within tumor and stromal single cells. By deconvoluting bulk transcriptomes of HNSCC tumors profiled by The Cancer Genome Atlas (TCGA), we estimated the activation states of these transcriptomic processes in individual tumors. Finally, we applied individualized causal network learning to discover an ICN within each tumor. Our results show that cellular states of cells in TMEs are coordinated through ICNs that enable multi-way communications among epithelial, fibroblast, endothelial, and immune cells. Further analyses of individual ICNs revealed structural patterns that were shared across subsets of tumors, leading to the discovery of 4 different subtypes of networks that underlie disparate TMEs of HNSCC. Patients with distinct TMEs exhibited significantly different clinical outcomes. Our results show that the capability of estimating individual ICNs reveals heterogeneity of ICNs and sheds light on the importance of intercellular communication in impacting disease development and progression.


Conflict of interest statement

I have read the journal’s policy and the authors of this manuscript have the following competing interests: XL is a founder and director of Deep Rx Inc.

Figures

Fig 1
Fig 1
a. UMAP plot of all cells collected from 17 HNSCC tumors. Cells were represented in the original transcriptome and were projected to 2-D space using the UMAP method. Pseudo-colors illustrate the cell types. b–f. Distribution of example immune-cell GEMs among CD45+ cells. The sum of the probabilities of the genes expressed in a cell being a member of an indicated GEM is represented as pseudo-colors.
Fig 2
Fig 2. CD8+ T cell subtyping based on GEM compositions.
a. UMAP plot of CD8+ T cells. Eight subtypes were identified, which are indicated by pseudo-colors. b. Pseudo-time plot reflecting evolution of subtypes of CD8+ T cells (cell subtype indicated with the same pseudo color scheme as in a). c. A hierarchical tree reflecting GEM composition of cell subtypes.
Fig 3
Fig 3. Distinct immune environment of HNSCCs defined by GEMs and cell subtypes.
a. Heatmap reflecting relative expression levels of GEMs (columns) among TCGA tumors (rows). Tumors are organized according to the clustering results, with color bars that indicate the tumor subtype cluster id. Kaplan-Meier curves of patients belonging to different clusters are shown on the right, using the same color scheme ids. b. Heatmap reflecting relative enrichment of immune cell subtypes among TCGA HNSCC tumors. Tumors are organized according to clustering results, and Kaplan-Meier curves of patients belonging to different clusters are shown on the right. c. Immune GEMs (with id indicated by the number) that are associated with statistically significant hazard ratios. d. Immune cell subtypes (indicated by major cell type, followed by subtype cluster id) that are associated with statistically significant hazard ratios.
Fig 4
Fig 4. Intercellular communication among cells in HNSCC TMEs.
a. Pair-wise correlation between GEMs from different type of cells. GEMs from major cell categories are color-coded and the top 10 strongest correlated GEMs for each cell type are shown as edges connecting the GEMs. Positive and negative correlated pairs are indicated as red and blue edges, respectively. b. Scatter plot of predicted immune GEM enrichment values using non-immune GEMs as independent variables in a regression model vs observed GEMs values. The average R2 is 0.71. c. A subgraph of the PAG learned by GFCI algorithm. GEMs from different cell types are color-coded. A direct edge (A➔B) represents a direct causal relationship, i.e., A causes B. d. Scatter plot of predicted immune GEM enrichment values using the Markov boundary of a GEM as independent variables in a regression model vs observed GEM values. The mean of R2 is 0.67, and the standard deviation is 0.16.
Fig 5
Fig 5. Distinct intercellular communication networks revealed by individualized CBN discovery.
a. Clustering of tumor specific intercellular communication networks. Tumor specific causal networks returned by the iGFCI algorithm were represented in the space spanned by the union of edges, where the presence/absence of an edge is represented by a binary variable (“1” / “0” respectively). Tumors (rows) were divided into 4 clusters, and the presence/absence of edges (columns) is shown as a heatmap. b. Examples of causal edges with high variance among tumor clusters. Eight edges are shown, and the directions of the edges are indexed by the cause-effect GEMs. The height of a bar reflects the ratio (or percentage) of tumors in a cluster (indicated by a number from 1 to 4) that have the edge in their tumor specific network. c. Kaplan-Meier survival curves of patients assigned to different clusters. d. A list of the causal edges that are associated with a statistically significant proportional hazard ratios according to a Cox proportional hazard analysis.
Fig 6
Fig 6. Causal modeling of an intercellular cellular communication network.
A. A biological scenario to be modeled by our framework. The activation states of the pathway X in Cell A can be affected by physiological signal (e.g., an extracellular signal W) or genomic alteration (e.g., V). Activation of pathway X in Cell A may lead to release or cell-surface presentation of a ligand L, which may be produced through de novo transcription. Ligand-receptor interaction (LR) leads to activation of pathway Y in Cell B. Activation of X and Y may be deterministically associated with expression of corresponding GEMs. B. A Causal Bayesian network (CBN) for modeling the signal transduction depicted in A. The CBN on the left side explicitly represents the relationships of pathways X and Y, their upstream signals (V and W), and the GEMs regulated by them. In a CBN, observed variables are represented as filled nodes, and latent variables are represented as open nodes. In general, variables V and W can be any type of observed variable, including the expression values of GEMs reflecting the states of corresponding latent signaling pathways in other cells. Under the above assumption, we can use GEM-X and GEM-Y as proxies of latent variables X and Y, such that the causal edge between X and Y can be represented and estimated as a causal edge between GEM-X and GEM-Y as reported in this work.
Fig 7
Fig 7. A hypothetical medical Bayesian network structure with 7 variables represented as nodes.
This structure is presented for illustration only and is not intended to present an accurate and complete model of the causal relationships involving pneumonia and mortality. The variables cytokine1 and cytokine2 represent two specific types of circulating cytokines associated with inflammatory disease. SNP1 and SNP2 are particular single nucleotide polymorphisms (SNPs) that represent genetic point variations. AKI is acute kidney injury.
Fig 8
Fig 8. A MAG representing the causal model in Fig 7 when the node pneumonia is unmeasured.
Fig 9
Fig 9. The MAGs consistent with the CBN shown in Fig 7, assuming pneumonia is an unmeasured variable.
Fig 10
Fig 10. A PAG representing the four MAGs shown in Fig 9.
Fig 11
Fig 11. A simple, hypothetical example of CSI.
(a) The data-generating CBN for variable X4 given its parents X1, X2, X3; (b) the individualized CBN that represents the CSI relationship X4X3|(X1 = 1, X2 = 1); (c) the individualized PAG that is learnable in the large sample limit from observational data generated by the CBN in b, given the assumptions described above.

References

    1. Spranger S, Bao R, Gajewski TF. Melanoma-intrinsic beta-catenin signalling prevents anti-tumour immunity. Nature. 2015;523(7559):231–5. doi: 10.1038/nature14404 . - DOI - PubMed
    1. Collins DC, Chenard-Poirier M, Lopez JS. The PI3K Pathway at the Crossroads of Cancer and the Immune System: Strategies for Next Generation Immunotherapy Combinations. Curr Cancer Drug Targets. 2018;18(4):355–64. Epub 2017/10/04. doi: 10.2174/1568009617666170927114440 . - DOI - PubMed
    1. Concha-Benavente F, Ferris RL. Oncogenic growth factor signaling mediating tumor escape from cellular immunity. Curr Opin Immunol. 2017;45:52–9. Epub 2017/02/17. doi: 10.1016/j.coi.2017.01.004 ; PubMed Central PMCID: PMC5449256. - DOI - PMC - PubMed
    1. Seton-Rogers S. Oncogenes: Driving immune evasion. Nat Rev Cancer. 2018;18(2):67. Epub 2018/01/26. doi: 10.1038/nrc.2018.5 . - DOI - PubMed
    1. Spranger S, Gajewski TF. Mechanisms of tumor cell–intrinsic immune evasion. Annual Review of Cancer Biology. 2018;2:213–8.

Publication types