

Restored Thymic Output after Androgen Blockade Participates in Antitumor Immunity
- PMID: 36548468
- PMCID: PMC9898132
- DOI: 10.4049/jimmunol.2200696
Restored Thymic Output after Androgen Blockade Participates in Antitumor Immunity
Abstract
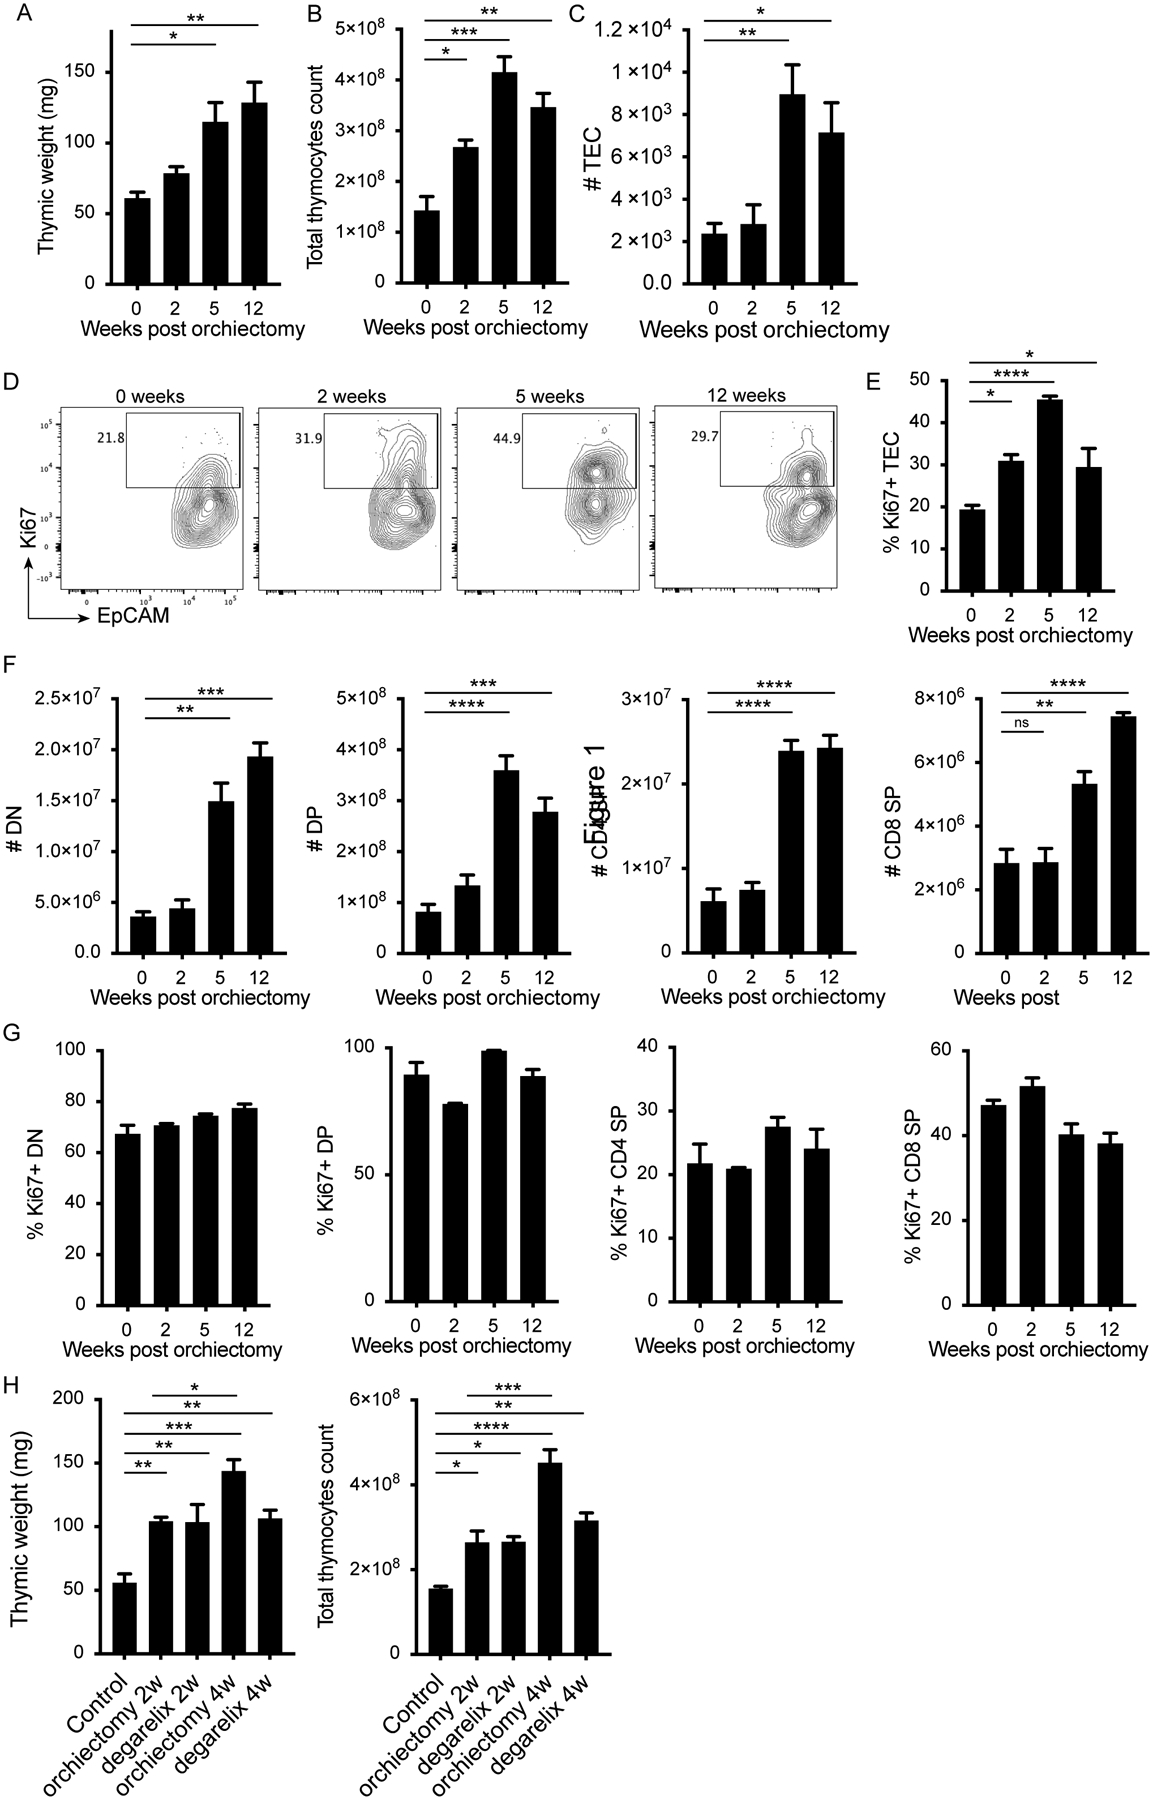
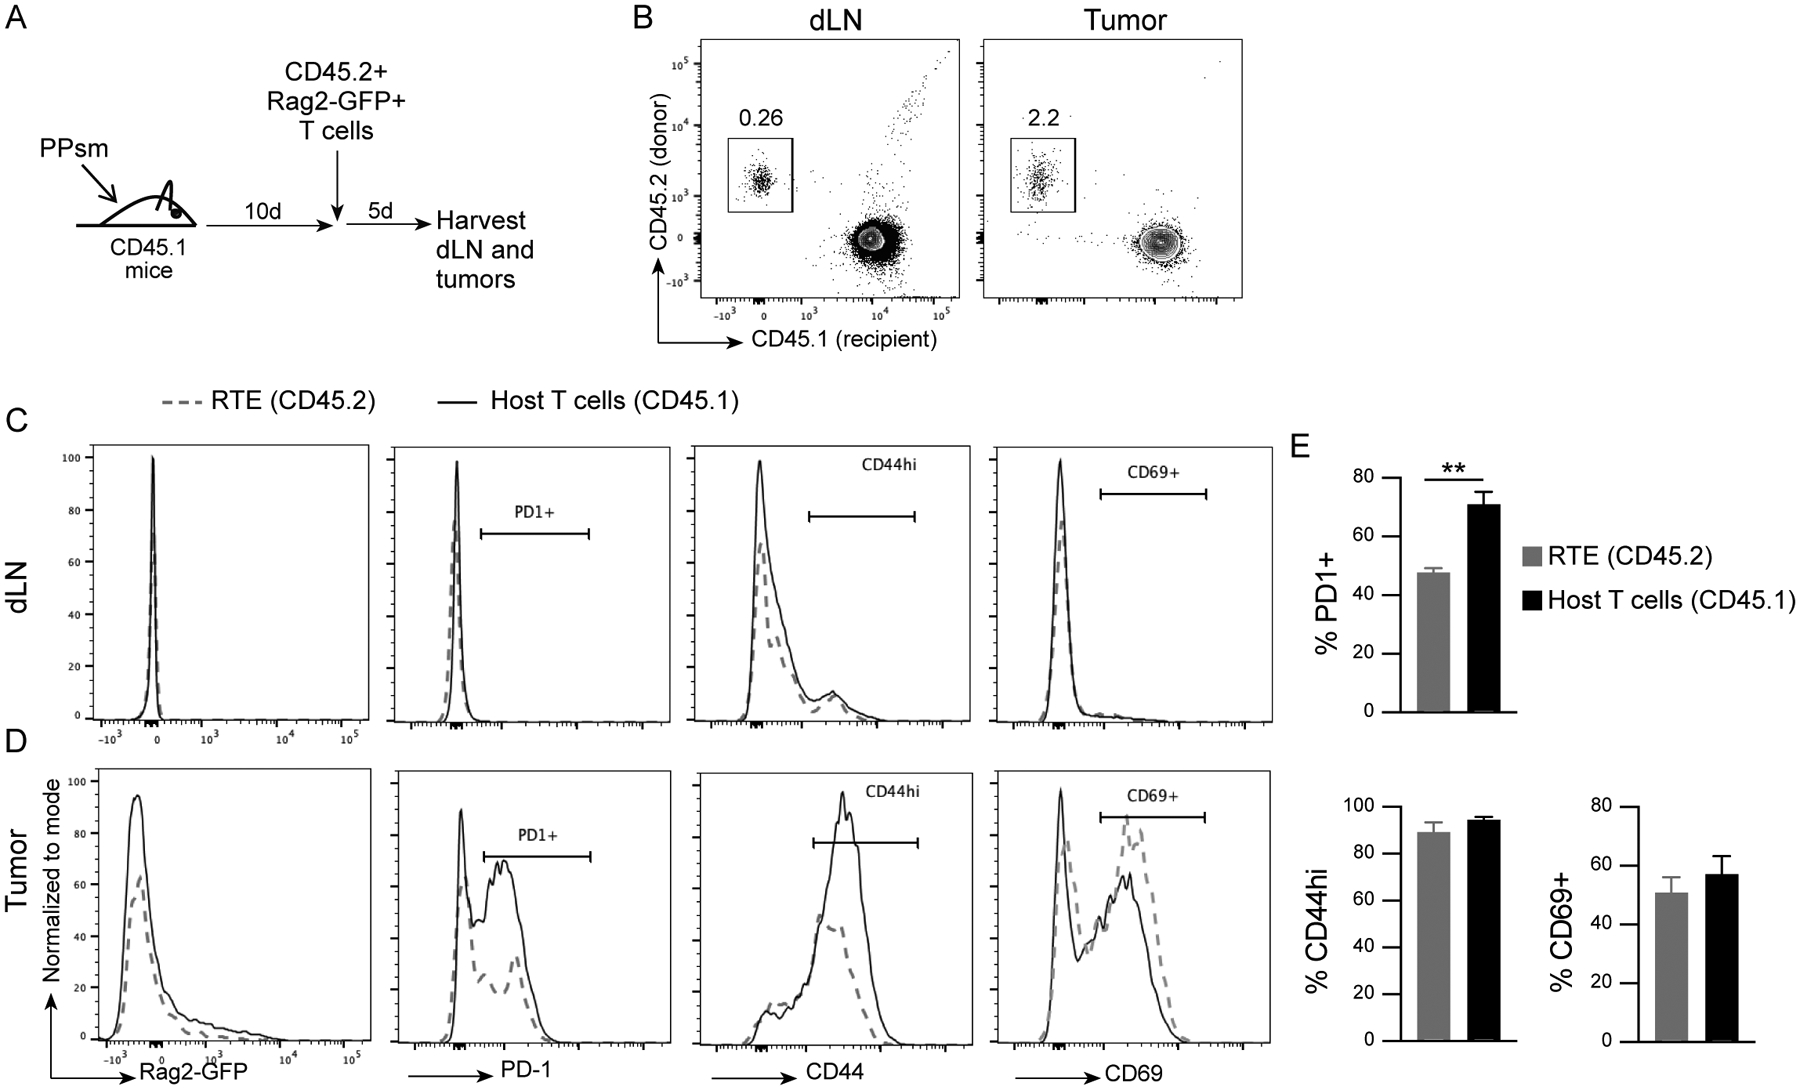
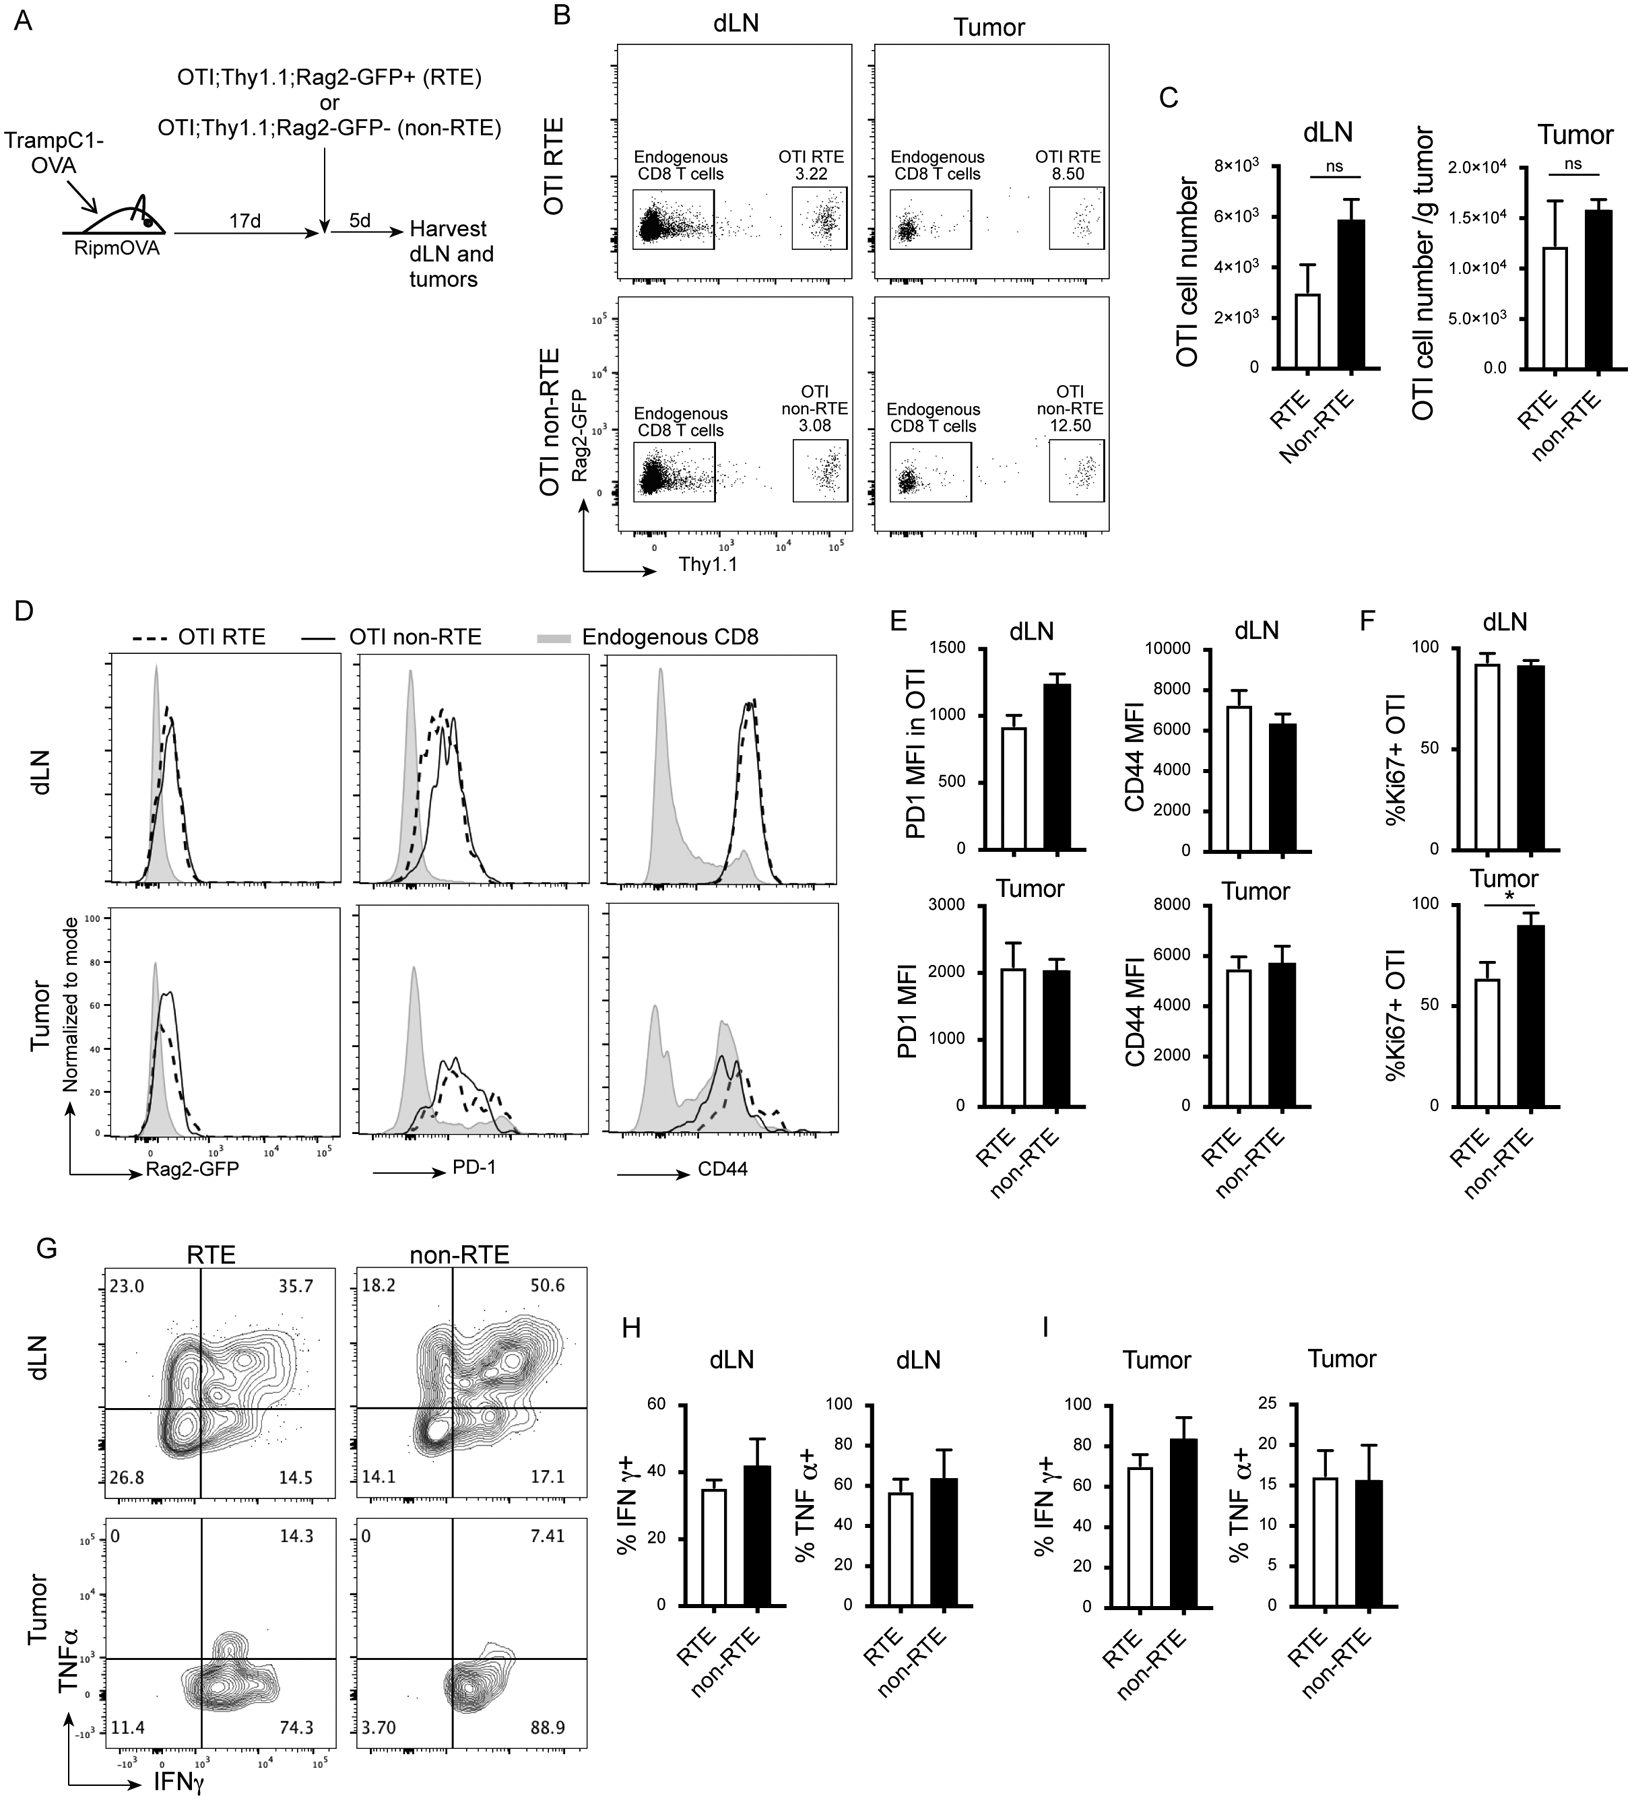
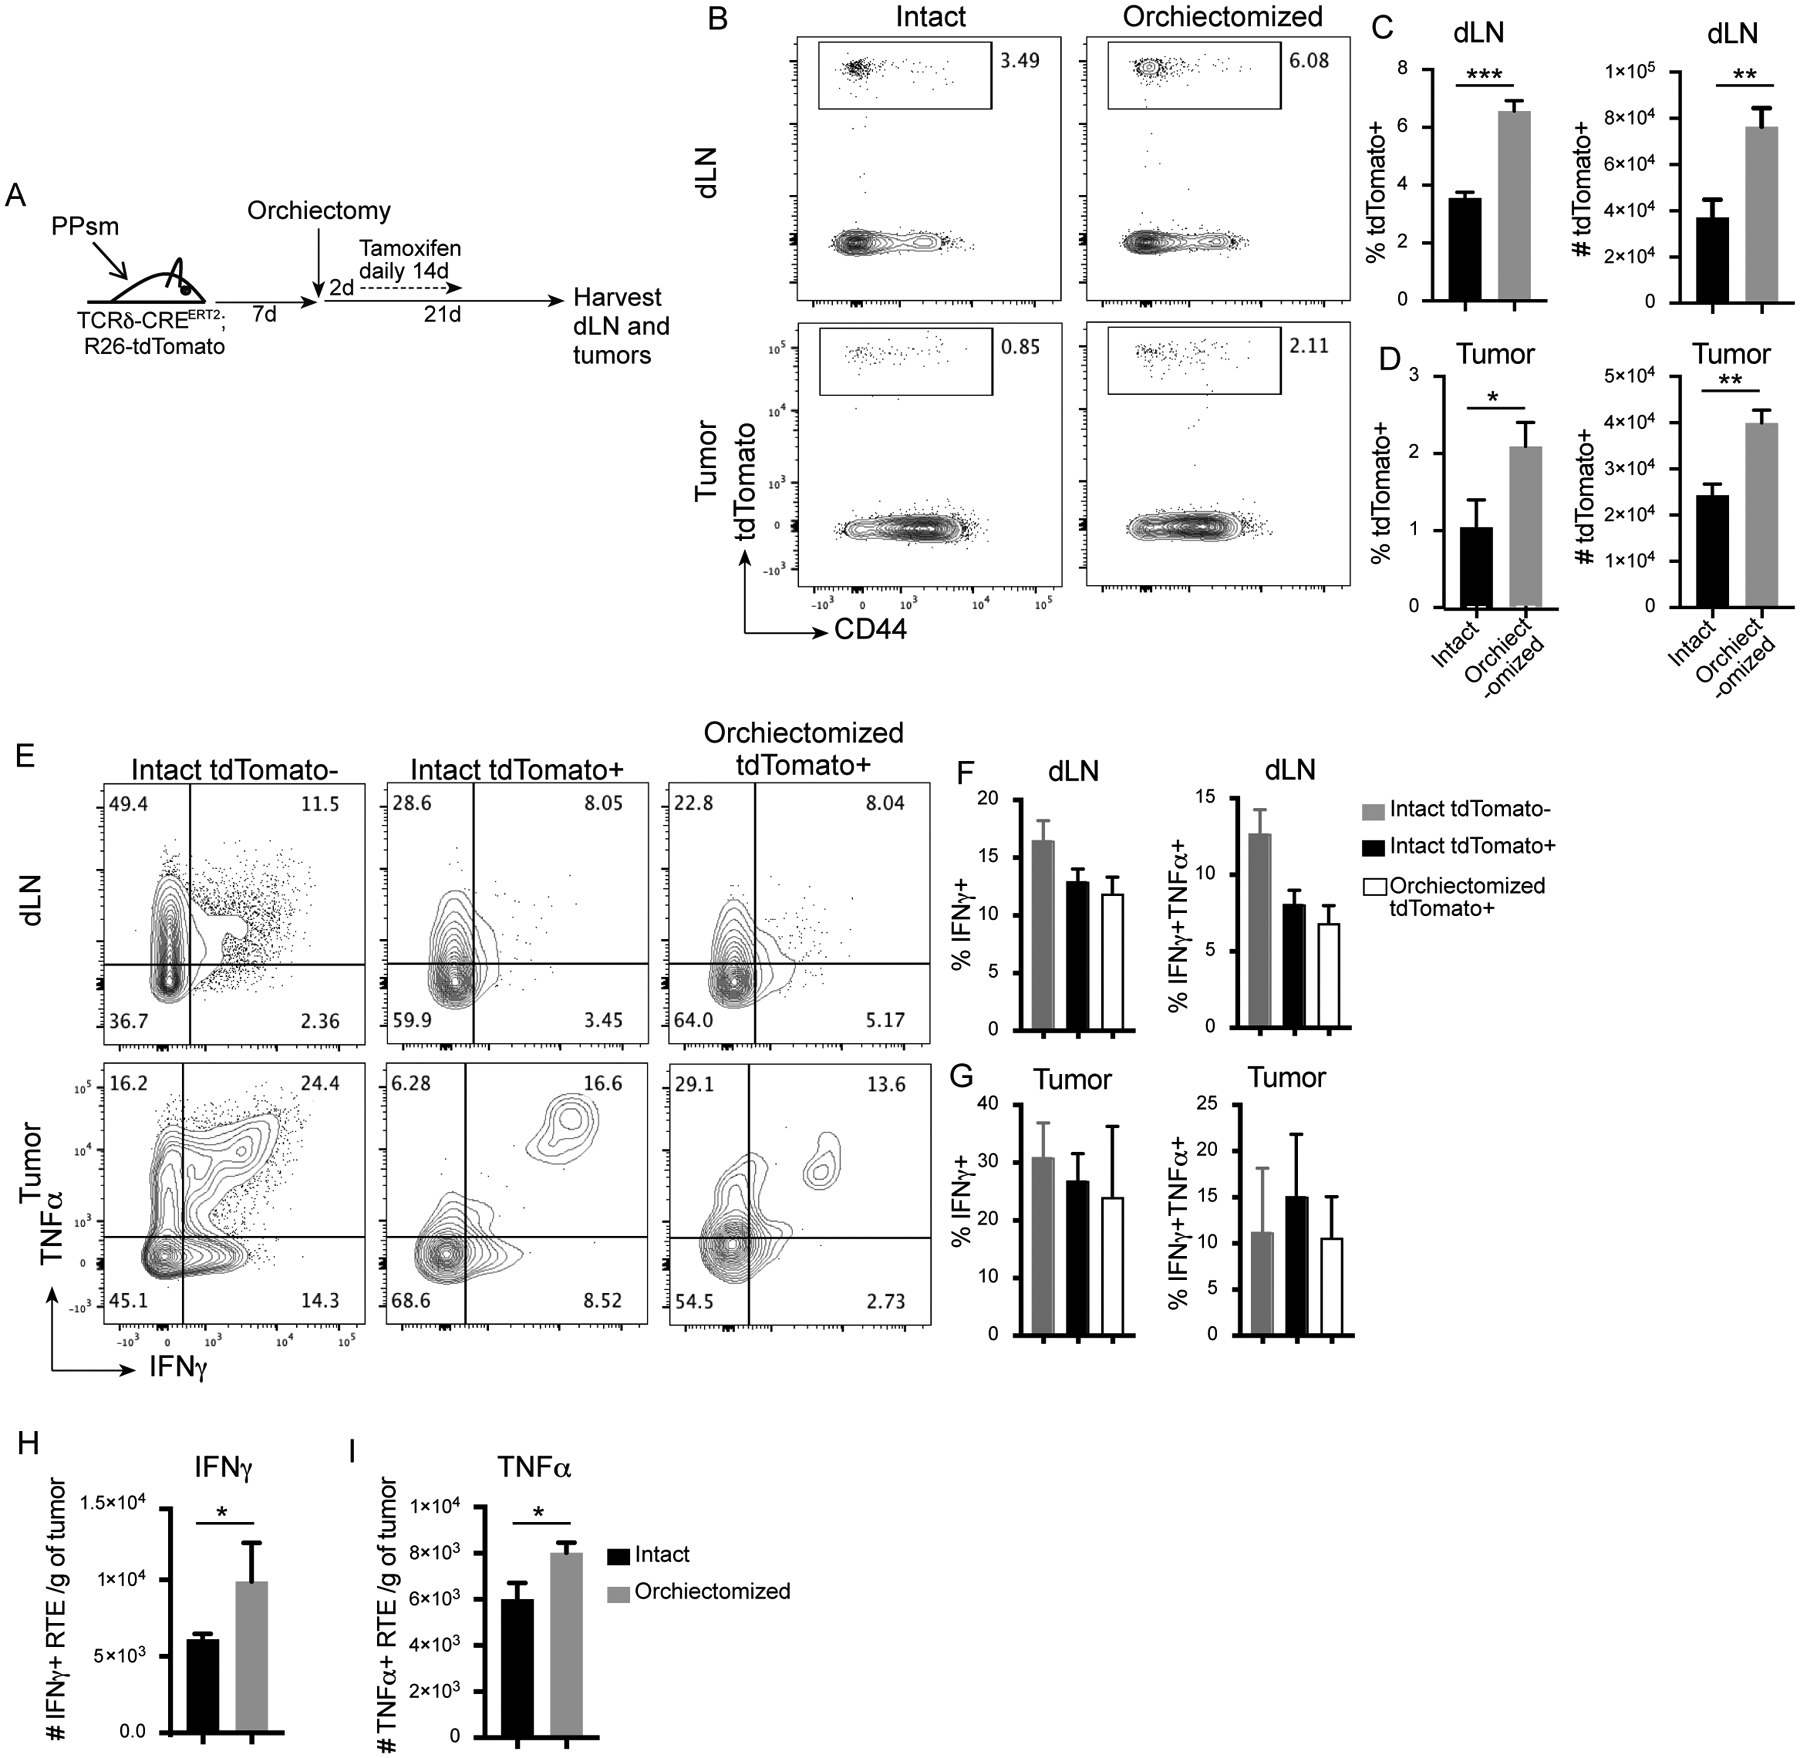
The thymus is a hormone-sensitive organ, which involutes with age in response to production of sex steroids. Thymic involution leads to a decrease in the generation of recent thymic emigrants (RTEs), resulting in a reduced response to immune challenges such as cancer. Interestingly, the standard of care for prostate cancer patients is androgen deprivation therapy (ADT), which leads to thymic regeneration and an increase in thymic output. It remains unknown whether these newly produced T cells can contribute to the antitumor immune response. This study defines the kinetics of thymic regeneration in response to ADT in mice, determining that thymic epithelial cell proliferation is critical for the increase in RTE output. Using a mouse model to track RTE in vivo, we demonstrate that these newly generated RTEs can traffic to tumors, where they become activated and produce effector cytokines at levels similar to more mature T cells. Collectively, these data suggest that RTEs produced from ADT-induced thymic regeneration could be harnessed for the antitumor immune response.
Copyright © 2023 by The American Association of Immunologists, Inc.
Figures
Similar articles
-
Androgen Receptors in Epithelial Cells Regulate Thymopoiesis and Recent Thymic Emigrants in Male Mice.Front Immunol. 2020 Jun 29;11:1342. doi: 10.3389/fimmu.2020.01342. eCollection 2020. Front Immunol. 2020. PMID: 32714327 Free PMC article.
-
Immune system and intestinal microbiota determine efficacy of androgen deprivation therapy against prostate cancer.J Immunother Cancer. 2022 Mar;10(3):e004191. doi: 10.1136/jitc-2021-004191. J Immunother Cancer. 2022. PMID: 35296557 Free PMC article.
-
Impact of androgen-deprivation therapy on the immune system: implications for combination therapy of prostate cancer.Front Biosci. 2007 Sep 1;12:4957-71. doi: 10.2741/2441. Front Biosci. 2007. PMID: 17569623 Review.
-
Human CD4+ T cell recent thymic emigrants are identified by protein tyrosine kinase 7 and have reduced immune function.J Exp Med. 2009 Feb 16;206(2):275-85. doi: 10.1084/jem.20080996. Epub 2009 Jan 26. J Exp Med. 2009. PMID: 19171767 Free PMC article.
-
Thymic Function Associated With Cancer Development, Relapse, and Antitumor Immunity - A Mini-Review.Front Immunol. 2020 Apr 30;11:773. doi: 10.3389/fimmu.2020.00773. eCollection 2020. Front Immunol. 2020. PMID: 32425946 Free PMC article. Review.
Cited by
-
Age-Related Thymic Involution.Adv Exp Med Biol. 2025;1471:285-299. doi: 10.1007/978-3-031-77921-3_11. Adv Exp Med Biol. 2025. PMID: 40067592 Review.
-
Endogenous thymic regeneration: restoring T cell production following injury.Nat Rev Immunol. 2025 Jun;25(6):407-424. doi: 10.1038/s41577-024-01119-0. Epub 2025 Jan 6. Nat Rev Immunol. 2025. PMID: 39762553 Review.
-
OncoSexome: the landscape of sex-based differences in oncologic diseases.Nucleic Acids Res. 2025 Jan 6;53(D1):D1443-D1459. doi: 10.1093/nar/gkae1003. Nucleic Acids Res. 2025. PMID: 39535034 Free PMC article.
-
Targeting a STING agonist to perivascular macrophages in prostate tumors delays resistance to androgen deprivation therapy.J Immunother Cancer. 2024 Jul 25;12(7):e009368. doi: 10.1136/jitc-2024-009368. J Immunother Cancer. 2024. PMID: 39060021 Free PMC article.
References
-
- Olsen NJ, Olson G, Viselli SM, Gu X, and Kovacs WJ. 2001. Androgen receptors in thymic epithelium modulate thymus size and thymocyte development. Endocrinology 142: 1278–1283. - PubMed
-
- Sempowski GD, Gooding ME, Liao HX, Le PT, and Haynes BF. 2002. T cell receptor excision circle assessment of thymopoiesis in aging mice. Mol Immunol 38: 841–848. - PubMed
-
- Callahan JE, Kappler JW, and Marrack P. 1993. Unexpected expansions of CD8-bearing cells in old mice. J Immunol 151: 6657–6669. - PubMed
-
- Ricalton NS, Roberton C, Norris JM, Rewers M, Hamman RF, and Kotzin BL. 1998. Prevalence of CD8+ T-cell expansions in relation to age in healthy individuals. J Gerontol A Biol Sci Med Sci 53: B196–203. - PubMed
Publication types
MeSH terms
Substances
Grants and funding
LinkOut - more resources
Full Text Sources
Medical
