Comment
. 2022 Dec 21;13(12):974-988.e7.
doi: 10.1016/j.cels.2022.11.007.

Benchmarking transcriptional host response signatures for infection diagnosis

Affiliations
Comment

Benchmarking transcriptional host response signatures for infection diagnosis

Daniel G Chawla et al. Cell Syst. .

Abstract

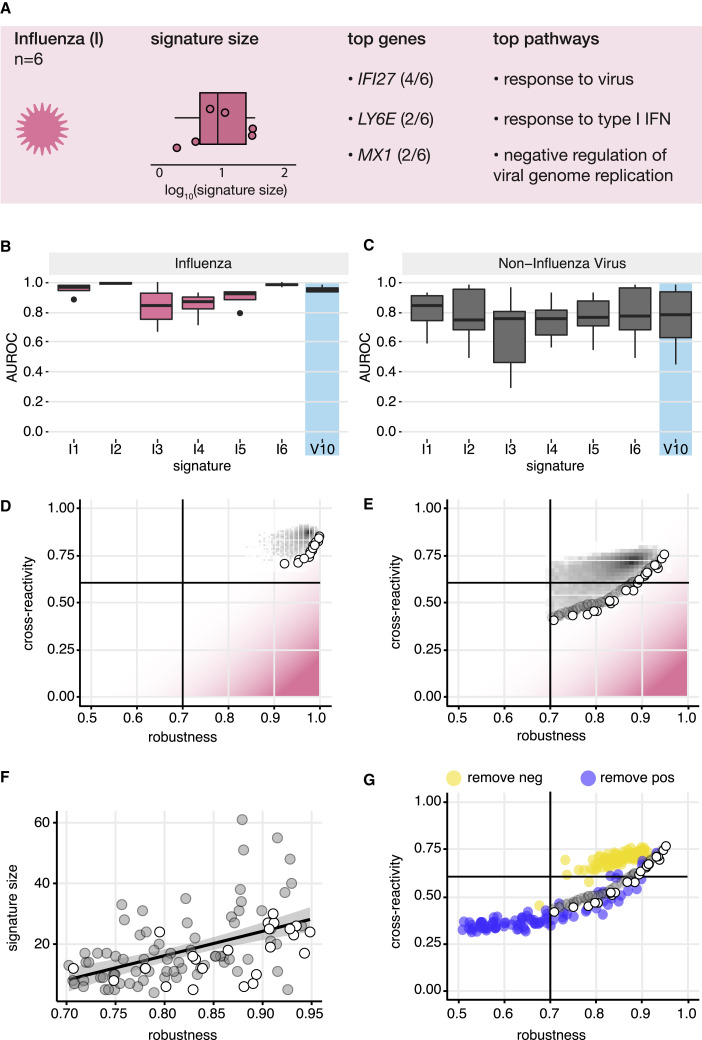
Identification of host transcriptional response signatures has emerged as a new paradigm for infection diagnosis. For clinical applications, signatures must robustly detect the pathogen of interest without cross-reacting with unintended conditions. To evaluate the performance of infectious disease signatures, we developed a framework that includes a compendium of 17,105 transcriptional profiles capturing infectious and non-infectious conditions and a standardized methodology to assess robustness and cross-reactivity. Applied to 30 published signatures of infection, the analysis showed that signatures were generally robust in detecting viral and bacterial infections in independent data. Asymptomatic and chronic infections were also detectable, albeit with decreased performance. However, many signatures were cross-reactive with unintended infections and aging. In general, we found robustness and cross-reactivity to be conflicting objectives, and we identified signature properties associated with this trade-off. The data compendium and evaluation framework developed here provide a foundation for the development of signatures for clinical application. A record of this paper's transparent peer review process is included in the supplemental information.

Keywords: aging; bacteria; cross-reactivity; data compendium; infection diagnosis; influenza signature; non-infectious conditions; robustness; signature evaluation framework; transcriptional host response signature; virus.


Conflict of interest statement

Declaration of interests Icahn School of Medicine at Mount Sinai has submitted a provisional patent related to this work. A.C., D.G.C., S.C.S., S.H.K., and E.Z. are inventors of the technology filed through ISMMS related to this manuscript. S.H.K. receives consulting fees from Peraton.

Figures

None
Graphical abstract
Figure 1
Figure 1
A curated set of human transcriptional infection signatures (A) A standardized process was used to identify and curate published blood-based (whole blood or PBMC) transcriptional signatures of infection in humans from NCBI PubMed. Selection focused on signatures to detect general responses to viral (V) and bacterial (B) infections compared with control subjects. Signatures developed to differentiate viral from bacterial infections in a direct contrast (V/B) were also included. Signatures were parsed into positive (upregulated with respect to the intended contrast) and negative (downregulated) gene lists. Each signature was annotated with metadata including method of derivation, cohort details, and accessions for discovery datasets. Overall, this workflow produced 24 signatures curated for evaluation. (B–D) The composition of each group of signatures (11 viral, 7 bacterial, and 6 V/B signatures) was characterized, including signature size, most frequently occurring genes and significantly enriched pathways (FDR < 0.05, selected examples are displayed). Frequency of occurrence for each gene is listed in parentheses. Enrichments were computed based on the total pool of genes in each signature group. (E) Pairwise Jaccard similarity coefficients were computed between signatures using concatenated positive and negative gene lists.
Figure 2
Figure 2
A compendium of human transcriptional infection datasets (A) A standardized procedure was used to build a compendium of human transcriptional infection datasets profiling PBMCs or whole blood. After a systematic search of NCBI GEO, 150 datasets were selected that profile in vivo responses to viral, bacterial, and parasitic infections, as well as immunomodulating non-infectious conditions. Datasets were passed through a standardized pre-processing pipeline. A total of 17,501 individual samples were annotated with condition type (e.g., infectious, non-infectious, or healthy control) as well as infection type (e.g., viral, bacterial, or parasitic) and the corresponding causative pathogen (e.g., influenza virus). Datasets were annotated with a study design (either cross-sectional or longitudinal). (B) Datasets were labeled hierarchically by condition(s) profiled: infectious/non-infectious, viral/bacterial/other, and by unique pathogen. Within each layer of the hierarchy, bar heights correspond to the relative frequency of dataset labels. (C–F) We evaluated technical characteristics of the viral and bacterial datasets within our compendium that may impact downstream analyses. We compared the number of samples per dataset (C), the number of datasets following each study design (D), the frequency of platform manufacturers (E), and the frequency of whole blood and PBMC samples (F). The number of studies refers to the number of datasets in each category.
Figure 3
Figure 3
Establishing a general framework for signature evaluation (A) Given a signature as input, a standardized evaluation framework was developed to calculate performance metrics across the data compendium. Signatures are scored for each subject in a target transcriptomic dataset using a geometric mean score approach that accommodates both cross-sectional and longitudinal study designs. The subject scores, paired with group labels, are used to compute an AUROC. AUROC statistics measuring performance for the intended and unintended conditions of a signature are reported as robustness and cross-reactivity, respectively. (B) Performance of curated signatures was computed in their respective discovery datasets. Shading indicates increasing AUROC in arbitrary units. Signature B7 and V/B1 are not included here because discovery datasets were not available (see Dataset search and selection in STAR Methods).
Figure 4
Figure 4
Existing signatures of bacterial and viral infection are generally robust when evaluated in independent data (A and B) Viral (A) and bacterial (B) signature robustness was evaluated in independent datasets profiling intended infections and healthy controls. Ridge plots indicate AUROC distributions for each signature. Signatures with a median AUROC greater than 0.70 were considered robust. ‡ indicates a signature derived using non-infectious illness controls. (C) V/B signature robustness was evaluated by computing AUROCs for distinguishing viral infections from bacterial infections in independent datasets profiling both infection types. ‡ indicates a signature derived using non-infectious illness controls. (D and E) Signature robustness was also evaluated separately for selected pathogens that were not included during signature discovery. Viral signature performance was evaluated in HIV infection (D), where the only available datasets were those profiling HIV infected subjects and healthy controls. Bacterial signature performance was evaluated in B. pseudomallei infection compared with healthy controls (E) and with non-infectious illness controls (Figure S2C). (F) One dataset in the compendium (GSE103119, median V/B signature AUROC < 0.50) was unique in its profiling of Mycoplasma infection. V/B signature AUROCs were compared for this dataset when including (+) or excluding (−) this pathogen (paired Wilcoxon signed-rank test, n = 6 V/B signature pairs). For (A)–(F), distributions shown in color indicate signature robustness. (G) All 24 signatures were evaluated in male and female subjects separately. (H) Viral signature performance was compared between acute and chronic infection datasets (Wilcoxon signed-rank test, n = 11 viral signature pairs). (I) Viral signature performance was compared between symptomatic and asymptomatic subjects in a dataset profiling H3N2 influenza virus infections confirmed by viral shedding (GSE73072, paired Wilcoxon signed-rank test, n = 11 viral signature pairs).
Figure 5
Figure 5
Nearly all infection signatures are cross-reactive with unintended infections or non-infectious conditions (A) Robust viral signatures were evaluated for cross-reactivity in datasets profiling bacterial infections and healthy controls. Signatures with median AUROCs greater than 0.60 were considered cross-reactive. (B) This cross-reactivity was further separated by bacterial class, using datasets in the compendium where this information was available. (C) Robust bacterial signatures were evaluated for cross-reactivity in datasets profiling viral infections and healthy controls. (D–F) All 22 robust signatures were evaluated for cross-reactivity in parasitic infection (D), obesity (E), and aging (F) datasets. V/B signatures were considered cross-reactive if they had a median AUROC greater than 0.60 or less than 0.40 (‡). This latter condition reflects that the designation of positive and negative genes in V/B signatures is arbitrary, and prediction in either direction is relevant to cross-reactivity. Signatures indicated in bold lettering were derived from discovery cohorts containing both pediatric and adult subjects. For (A)–(F), distributions shown in color indicate a lack of signature cross-reactivity.
Figure 6
Figure 6
Analysis of influenza signatures demonstrates a trade-off between robustness and cross-reactivity (A) A targeted literature search for influenza signatures was performed as a case study of single-pathogen signatures. (B and C) Robustness (B) and cross-reactivity (C) of influenza signatures were evaluated using healthy control samples. General viral signature V10 was included as a positive control for viral detection. (D) A meta-analysis procedure (see STAR Methods) was adapted to generate a pool of 124 candidate genes that are differentially expressed between influenza infection and healthy control samples. 100,000 synthetic signatures were generated by randomly sampling these candidate genes. For consistency with the meta-analysis procedure, performance was characterized using a weighted average AUROC () across validation datasets. Robustness ( in influenza datasets) and cross-reactivity ( in non-influenza datasets) were evaluated for all candidate signatures (gray shading depicting density). Signatures comprising the Pareto front (white points) were identified to define signatures with locally optimal robustness and cross-reactivity characteristics. Pink shading indicates proximity to an ideal influenza signature with perfect robustness and no cross-reactivity. (E) A similar analysis was carried out using a new set of candidate genes generated from the results of a meta-analysis directly contrasting influenza infection with non-influenza viral infection samples. (F) A local neighborhood along the Pareto front in (E) was defined (gray points), and the relationship between signature size and signature robustness was examined. (G) Each synthetic signature was separated into two signatures by removing either its positive (blue points) or negative (yellow points) gene sets. Performance was evaluated independently for each of these signatures.

Comment on

References

    1. Ferrer R., Martin-Loeches I., Phillips G., Osborn T.M., Townsend S., Dellinger R.P., Artigas A., Schorr C., Levy M.M. Empiric antibiotic treatment reduces mortality in severe sepsis and septic shock from the first hour: results from a guideline-based performance improvement program. Crit. Care Med. 2014;42:1749–1755. doi: 10.1097/CCM.0000000000000330. - DOI - PubMed
    1. CDC . Centers for Disease Control and Prevention; 2020. Antibiotic Resistance is a National Priority.https://www.cdc.gov/drugresistance/us-activities.html
    1. Killingley B., Mann A.J., Kalinova M., Boyers A., Goonawardane N., Zhou J., Lindsell K., Hare S.S., Brown J., Frise R., et al. Safety, tolerability and viral kinetics during SARS-CoV-2 human challenge in young adults. Nat. Med. 2022;28:1031–1041. doi: 10.1038/s41591-022-01780-9. - DOI - PubMed
    1. Kucirka L.M., Lauer S.A., Laeyendecker O., Boon D., Lessler J. Variation in false-negative rate of reverse transcriptase polymerase chain reaction-based SARS-CoV-2 tests by time since exposure. Ann. Intern. Med. 2020;173:262–267. doi: 10.7326/M20-1495. - DOI - PMC - PubMed
    1. Self W.H., Balk R.A., Grijalva C.G., Williams D.J., Zhu Y., Anderson E.J., Waterer G.W., Courtney D.M., Bramley A.M., Trabue C., et al. Procalcitonin as a marker of etiology in adults hospitalized with community-acquired pneumonia. Clin. Infect. Dis. 2017;65:183–190. doi: 10.1093/cid/cix317. - DOI - PMC - PubMed

Publication types