

Evaluation of Nanopore sequencing for Mycobacterium tuberculosis drug susceptibility testing and outbreak investigation: a genomic analysis
- PMID: 36549315
- PMCID: PMC9892011
- DOI: 10.1016/S2666-5247(22)00301-9
Evaluation of Nanopore sequencing for Mycobacterium tuberculosis drug susceptibility testing and outbreak investigation: a genomic analysis
Erratum in
-
Correction to Lancet Microbe 2022; published online Dec 19, 2022. https://doi.org/10.1016/S2666-5247(22)00301-9.Lancet Microbe. 2023 Feb;4(2):e72. doi: 10.1016/S2666-5247(22)00381-0. Epub 2022 Dec 22. Lancet Microbe. 2023. PMID: 36566753 Free PMC article. No abstract available.
Abstract
Background: Mycobacterium tuberculosis whole-genome sequencing (WGS) has been widely used for genotypic drug susceptibility testing (DST) and outbreak investigation. For both applications, Illumina technology is used by most public health laboratories; however, Nanopore technology developed by Oxford Nanopore Technologies has not been thoroughly evaluated. The aim of this study was to determine whether Nanopore sequencing data can provide equivalent information to Illumina for transmission clustering and genotypic DST for M tuberculosis.
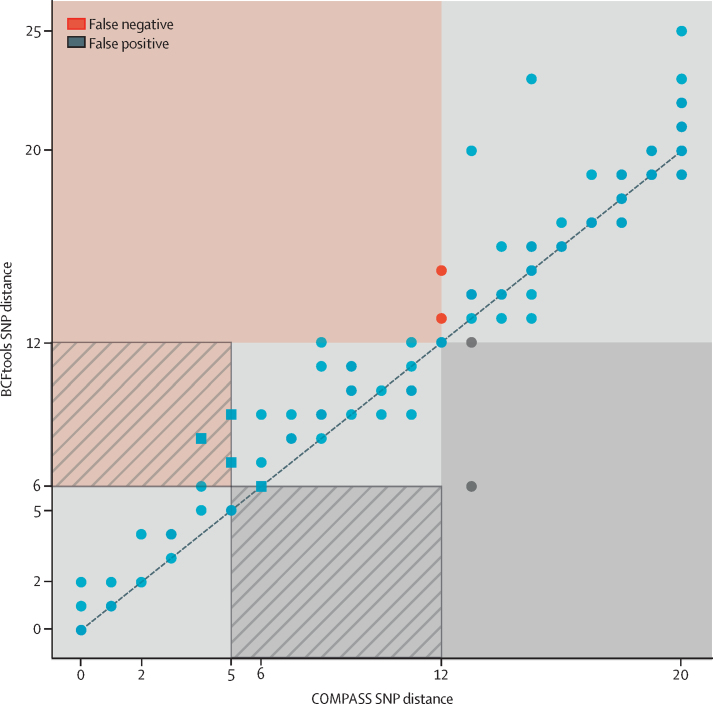
Methods: In this genomic analysis, we analysed 151 M tuberculosis isolates from Madagascar, South Africa, and England, which were collected between 2011 and 2018, using phenotypic DST and matched Illumina and Nanopore data. Illumina sequencing was done with the MiSeq, HiSeq 2500, or NextSeq500 platforms and Nanopore sequencing was done on the MinION or GridION platforms. Using highly reliable PacBio sequencing assemblies and pairwise distance correlation between Nanopore and Illumina data, we optimise Nanopore variant filters for detecting single-nucleotide polymorphisms (SNPs; using BCFtools software). We then used those SNPs to compare transmission clusters identified by Nanopore with the currently used UK Health Security Agency Illumina pipeline (COMPASS). We compared Illumina and Nanopore WGS-based DST predictions using the Mykrobe software and mutation catalogue.
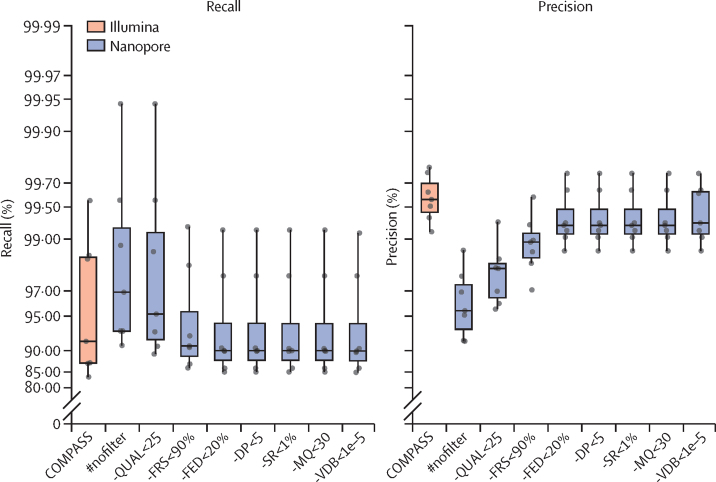
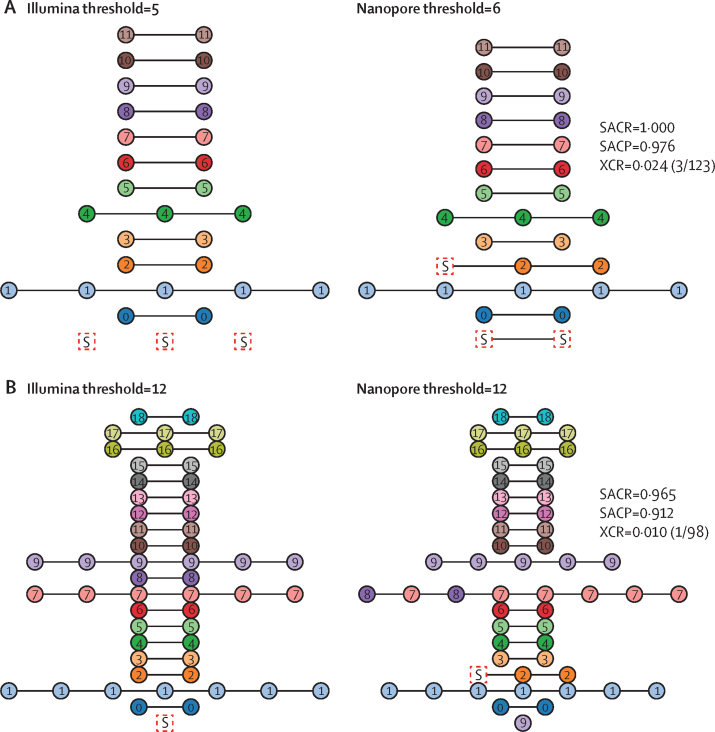
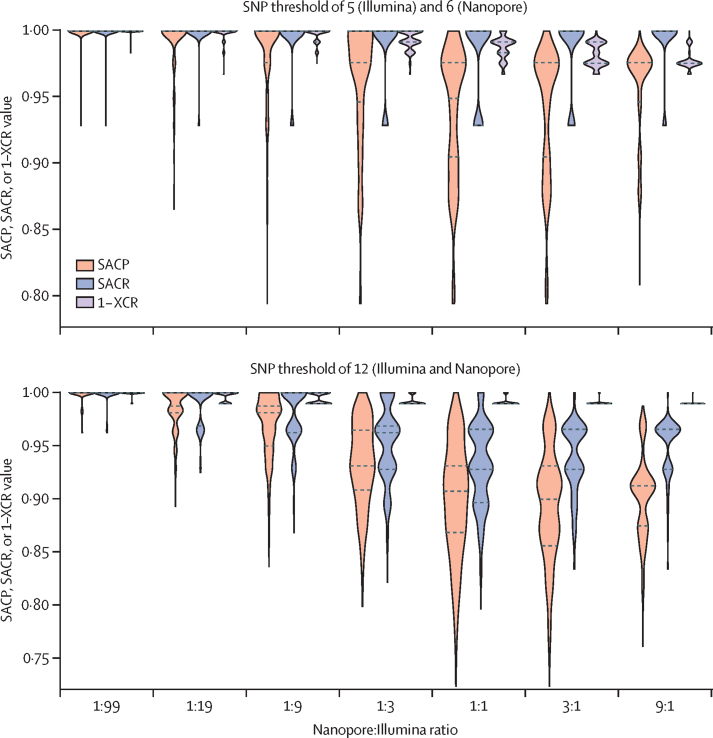
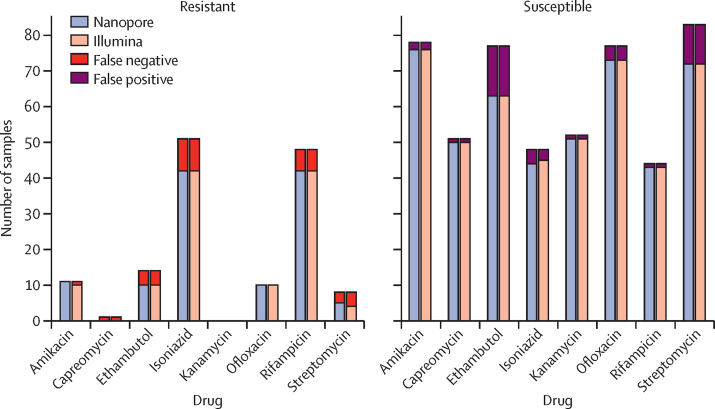
Findings: The Nanopore BCFtools pipeline identified SNPs with a median precision of 99·3% (IQR 99·1-99·6) and recall of 90·2% (88·1-94·2) compared with a precision of 99·6% (99·4-99·7) and recall of 91·9% (87·6-98·6) using the Illumina COMPASS pipeline. Using a threshold of 12 SNPs for putative transmission clusters, Illumina identified 98 isolates as unrelated and 53 as belonging to 19 distinct clusters (size range 2-7). Nanopore reproduced 15 out of 19 clusters perfectly; two clusters were merged into one cluster, one cluster had a single sample missing, and one cluster had an additional sample adjoined. Illumina-based clusters were also closely replicated using a five SNP threshold and clustering accuracy was maintained using mixed Illumina and Nanopore datasets. Genotyping resistance variants with Nanopore was highly concordant with Illumina, having zero discordant SNPs across more than 3000 SNPs and four insertions or deletions (indels), across 60 000 indels.
Interpretation: Illumina and Nanopore technologies can be used independently or together by public health laboratories performing M tuberculosis genotypic DST and outbreak investigations. As a result, clinical and public health institutions making decisions on which sequencing technology to adopt for tuberculosis can base the choice on cost (which varies by country), batching, and turnaround time.
Funding: Academy for Medical Sciences, Oxford Wellcome Institutional Strategic Support Fund, and the Swiss South Africa Joint Research Award (Swiss National Science Foundation and South African National Research Foundation).
Copyright © 2023 The Author(s). Published by Elsevier Ltd. This is an Open Access article under the CC BY 4.0 license. Published by Elsevier Ltd.. All rights reserved.
Conflict of interest statement
Declaration of interests ZI, SGL, and NR had travel and accommodation costs reimbursed when speaking at an Oxford Nanopore Technology (ONT) conference in 2017. SGL and NR previously received consumables from ONT when establishing Nanopore sequencing capacity in Madagascar. ONT matched the contributions from the Longitude Prize Discovery Award to ZI and TMW in 2017 to provide consumables for sequencing in Viet Nam and India. All other authors declare no competing interests. ONT did not provide funding (direct or in kind) for this project, and had no input or knowledge of the design, data analysis, or paper writing. Funders had no input into the design, data analysis, or paper writing of this project.
Figures
References
-
- WHO . World Health Organization; Geneva: 2021. Global tuberculosis report 2021.
-
- Pai M, Kasaeva T, Swaminathan S. Covid-19's devastating effect on tuberculosis care – a path to recovery. N Engl J Med. 2022;386:1490–1493. - PubMed
-
- WHO . World Health Organization; Geneva: 2015. The end TB strategy.
-
- Walker TM, Cruz ALG, Peto TE, Smith EG, Esmail H, Crook DW. Tuberculosis is changing. Lancet Infect Dis. 2017;17:359–361. - PubMed
Publication types
MeSH terms
Associated data
Grants and funding
LinkOut - more resources
Full Text Sources
Medical
Research Materials
