. 2023 Mar 16;61(3):2201335.
doi: 10.1183/13993003.01335-2022. Print 2023 Mar.

Dupilumab increases aspirin tolerance in NSAID-exacerbated respiratory disease

Affiliations

Dupilumab increases aspirin tolerance in NSAID-exacerbated respiratory disease

Sven Schneider et al. Eur Respir J. .

Abstract

Background: Nonsteroidal anti-inflammatory drug (NSAID)-exacerbated respiratory disease (N-ERD) comprises the triad of chronic rhinosinusitis with nasal polyps, asthma and intolerance to NSAIDs. Dupilumab treatment, targeting the interleukin-4 (IL-4) receptor α, significantly reduces polyp burden as well as asthma symptoms. Here we aimed to investigate the effect of dupilumab on aspirin intolerance, burden of disease and nasal cytokine profiles in patients with N-ERD.

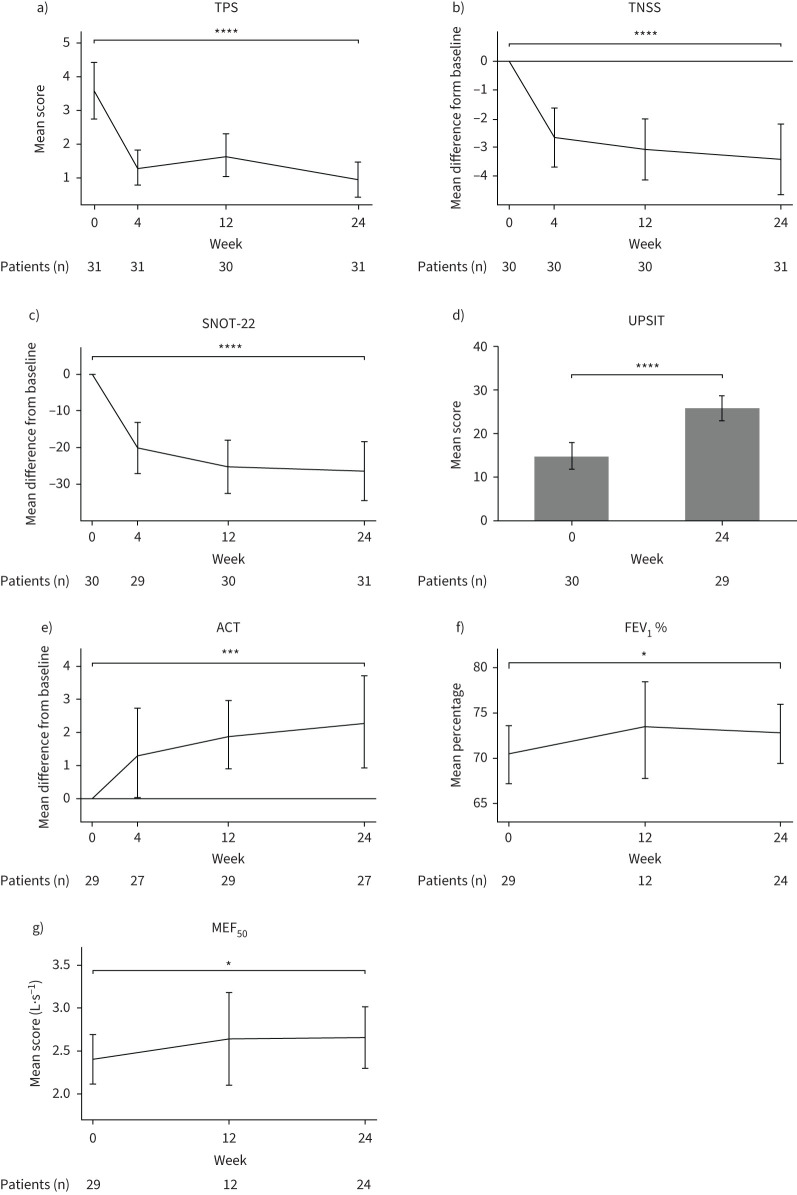
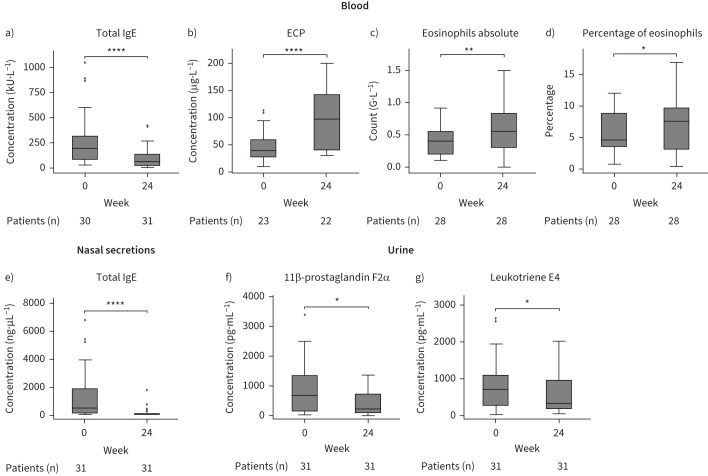
Methods: In this open-label trial, adult patients with confirmed N-ERD were treated with dupilumab for 6 months. Clinical parameters (e.g. total polyp scores, quality of life questionnaires, smell test, spirometry), oral aspirin provocation testing and blood, nasal and urine sampling were monitored at regular intervals for up to 6 months after starting dupilumab therapy.

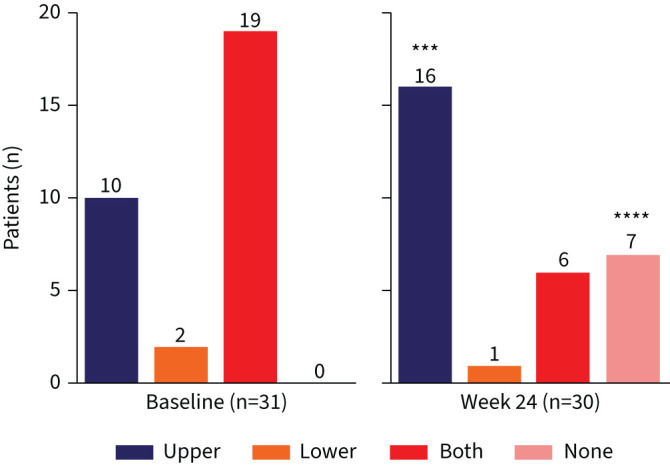
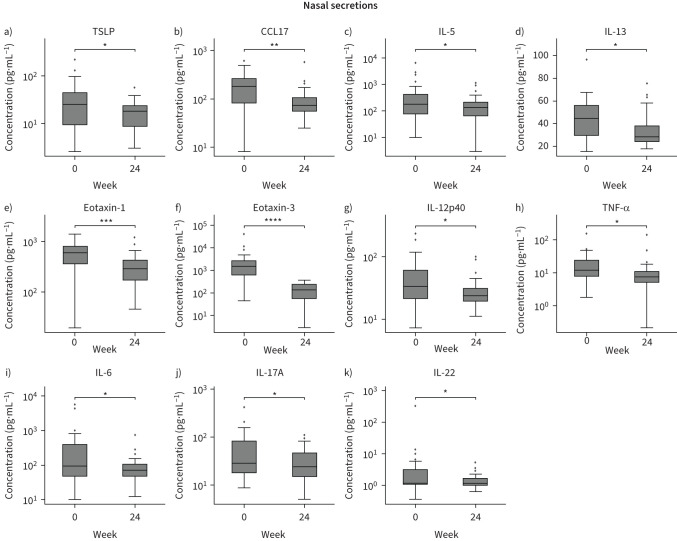
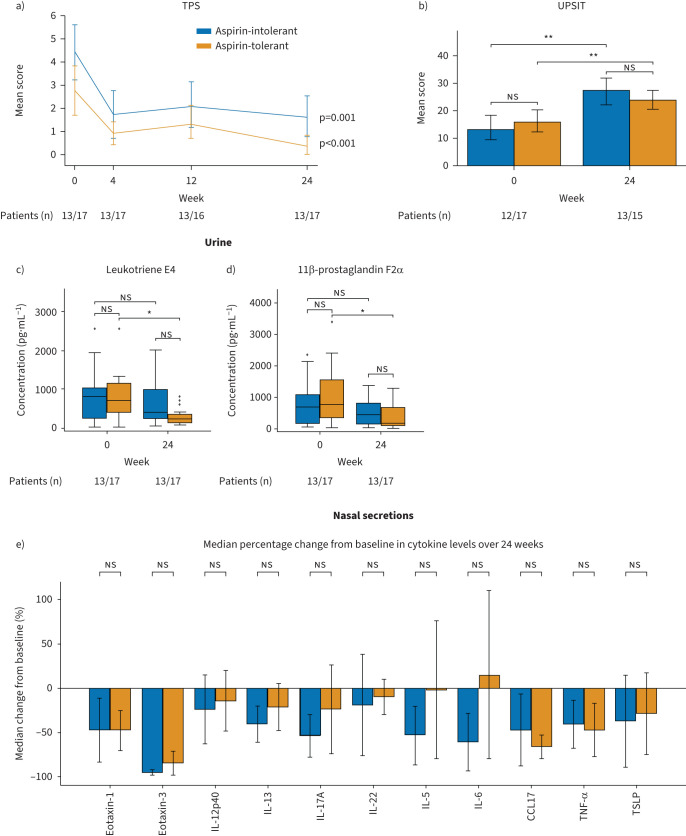
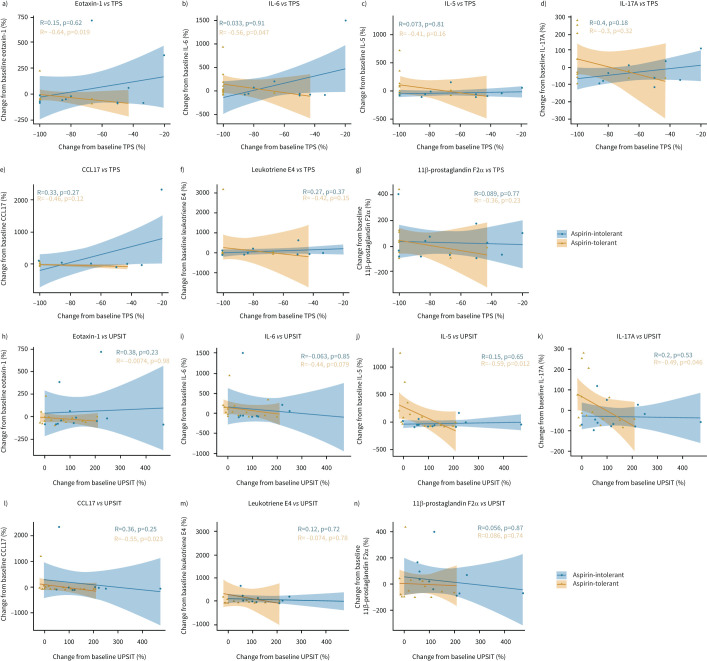
Results: Of the 31 patients included in the study, 30 completed both aspirin provocation tests. After 6 months of treatment with dupilumab, 23% of patients (n=7 of 30) developed complete aspirin tolerance and an additional 33% of patients (n=10 of 30) tolerated higher doses. Polyp burden was significantly reduced (total polyp score: -2.68±1.84, p<0.001), while pulmonary symptoms (asthma control test: +2.34±3.67, p<0.001) and olfactory performance improved (University of Pennsylvania Smell Identification Test: +11.16±9.54, p<0.001) in all patients after therapy. Patients with increased aspirin tolerance showed a significant decrease in urinary leukotriene E4 levels and their improvement in clinical parameters was associated with a reduction of eotaxin-1, C-C motif chemokine ligand 17, IL-5, IL-17A and IL-6.

Conclusion: In this study, 57% of N-ERD patients tolerated higher doses of aspirin under dupilumab therapy.


Conflict of interest statement

Conflict of interest: S. Schneider served as a speaker and/or consultant and/or advisory board member for Sanofi and Novartis; and is an investigator for Novartis and AstraZeneca (grants paid to his institution). T. Bartosik received personal fees from Sanofi. L.D. Landegger served as an independent consultant for Conclave Capital and Gerson Lehrman Group, is an investigator for Decibel Therapeutics and Amgen (grants paid to his institution), and acts as Chair of the Membership Committee for Association for Research in Otolaryngology (ARO). M. Rocha-Hasler reports grants from AstraZeneca. C. Bangert has received personal fees from Mylan, LEO Pharma, Pfizer, Sanofi Genzyme, Eli Lilly, Novartis, AstraZeneca and AbbVie, and is an investigator for Novartis, Sanofi, AbbVie, Elli Lilly, LEO Pharma and Galderma (grants paid to her institution). J. Eckl-Dorna served as a speaker and/or consultant and/or advisory board member for Sanofi, Allergopharma, AstraZeneca, GSK, Bencard and Novartis, and is an investigator for Novartis and AstraZeneca (grants paid to her institution). All other authors declare no conflict of interest.

Figures

FIGURE 1
FIGURE 1
Different respiratory symptoms in response to oral aspirin provocation before and 24 weeks after dupilumab treatment. Number of patients at each visit and significance of changes between baseline and week 24 are indicated in individual graphs. ***: p<0.001; ****: p<0.0001.
FIGURE 2
FIGURE 2
Changes in clinical responses from baseline over time in nonsteroidal anti-inflammatory drug-exacerbated respiratory disease patients during 24 weeks of dupilumab treatment. a) Mean of total polyp score (TPS), b) mean difference from baseline in total nasal symptom score (TNSS), c) mean difference from baseline in Sino-Nasal Outcome Test-22 (SNOT-22), d) mean score of University of Pennsylvania Smell Identification Test (UPSIT), e) mean difference from baseline in Asthma Control Test (ACT), f) mean % predicted forced expiratory volume in 1 s (FEV1) and g) mean score of maximal expiratory flow at 50% of forced vital capacity (MEF50) are displayed at baseline as well as 4, 12 and 24 weeks after treatment where applicable. Number of patients at each visit and significance of changes between baseline and week 24 are indicated in individual graphs. *: p<0.05; ***: p<0.001; ****: p<0.0001.
FIGURE 3
FIGURE 3
Analysis of biomarkers in blood and urine of nonsteroidal anti-inflammatory drug-exacerbated respiratory disease patients in response to 24 weeks of dupilumab treatment. a–d) Levels of a) total IgE and b) eosinophilic cationic protein (ECP) as well as c) absolute (count) and d) percentage of eosinophils in blood at baseline and after 24 weeks of dupilumab treatment. e) Levels of total IgE in nasal secretions at baseline and after 24 weeks of dupilumab treatment. f, g) Levels of f) 11β-prostaglandin F2α and g) leukotriene E4 levels in urine at week 0 and 24 of dupilumab treatment. Line within each box represents the median, bottom border represents the 25th percentile and top border the 75th percentile of the data. Whiskers extend 1.5 times the interquartile range and diamond-shaped points are outliers. Number of patients at each visit and significance of changes between baseline and week 24 are indicated in individual graphs. *: p<0.05; **: p<0.01; ****: p<0.0001.
FIGURE 4
FIGURE 4
Analysis of selected biomarkers in nasal secretions of nonsteroidal anti-inflammatory drug-exacerbated respiratory disease (N-ERD) patients in response to dupilumab treatment. Levels of a) thymic stromal lymphopoietin (TSLP), b) C-C motif chemokine ligand 17 (CCL17), c) interleukin (IL) 5, d) IL-13, e) eotaxin-1, f) eotaxin-3, g) IL-12p40, h) tumour necrosis factor α (TNF-α), i) IL-6, j) IL-17A and k) IL-22 in N-ERD patients (n=31) are displayed at baseline and after 24 weeks of dupilumab treatment. Line within each box represents the median, bottom border represents the 25th percentile and top border the 75th percentile of the data. Whiskers extend 1.5 times the interquartile range and diamond-shaped points are outliers. Significance of changes between baseline and week 24 are indicated in individual graphs. *: p<0.05; **: p<0.01; ***: p<0.001; ****: p<0.0001.
FIGURE 5
FIGURE 5
Analysis of clinical responses and urinary and nasal secretion biomarkers in aspirin-tolerant and aspirin-intolerant nonsteroidal anti-inflammatory drug-exacerbated respiratory disease patients after 24 weeks of dupilumab treatment. a) Change in total polyp score (TPS) represented as mean score. b) University of Pennsylvania Smell Identification Test (UPSIT) mean score before and after 24 weeks of treatment. c, d) Levels of urinary c) leukotriene E4 and d) 11β-prostaglandin F2α. Line within each box represents the median, bottom border represents the 25th percentile and top border the 75th percentile of the data. Whiskers extend 1.5 times the interquartile range and diamond-shaped points are outliers. e) Median percentage change from baseline of selected biomarkers (cytokines) in nasal secretions. All analyses performed in patients showing aspirin tolerance (orange) or no aspirin tolerance (blue) at the second provocation after 24 weeks of treatment. Significance of changes between baseline and week 24 are indicated in individual graphs. ns: nonsignificant; IL: interleukin; CCL17: C-C motif chemokine ligand 17; TNF-α: tumour necrosis factor α; TSLP: thymic stromal lymphopoietin. *: p<0.05; **: p<0.01.
FIGURE 6
FIGURE 6
Correlation between clinical parameters and nasal biomarkers in aspirin-tolerant and aspirin-intolerant nonsteroidal anti-inflammatory drug-exacerbated respiratory disease patients after 24 weeks of dupilumab treatment. a–g) Correlation of change from baseline (%) of total polyp score (TPS) versus nasal a) eotaxin-1, b) interleukin (IL) 6, c) IL-5, d) IL-17A and e) C-C motif chemokine ligand 17 (CCL17) as well as urinary f) leukotriene E4 and g) 11β-prostaglandin F2α. h–n) Correlation of change from baseline (%) of University of Pennsylvania Smell Identification Test (UPSIT) versus nasal h) eotaxin-1, i) IL-6, j) IL-5, k) IL-17A and l) CCL17 as well as urinary m) leukotriene E4 and n) 11β-prostaglandin F2α. Correlation as determined by Spearman correlation coefficient and significance levels are indicated in the figure for aspirin-tolerant (orange, n=17) and aspirin-intolerant (blue, n=13) patients. The respective lines within the scatter plots represent the linearly regressed trend line and the shaded regions the 95% confidence interval.

Comment in

References

    1. Ledford DK, Wenzel SE, Lockey RF. Aspirin or other nonsteroidal inflammatory agent exacerbated asthma. J Allergy Clin Immunol Pract 2014; 2: 653–657. doi:10.1016/j.jaip.2014.09.009 - DOI - PubMed
    1. Li KL, Lee AY, Abuzeid WM. Aspirin exacerbated respiratory disease: epidemiology, pathophysiology, and management. Med Sci (Basel) 2019; 7: 45. - PMC - PubMed
    1. Khan A, Vandeplas G, Huynh TMT, et al. . The Global Allergy and Asthma European Network (GALEN) rhinosinusitis cohort: a large European cross-sectional study of chronic rhinosinusitis patients with and without nasal polyps. Rhinology 2019; 57: 32–42. doi:10.4193/Rhin17.255 - DOI - PubMed
    1. Rajan JP, Wineinger NE, Stevenson DD, et al. . Prevalence of aspirin-exacerbated respiratory disease among asthmatic patients: a meta-analysis of the literature. J Allergy Clin Immunol 2015; 135: 676–81. doi:10.1016/j.jaci.2014.08.020 - DOI - PubMed
    1. Ta V, White AA. Survey-defined patient experiences with aspirin-exacerbated respiratory disease. J Allergy Clin Immunol Pract 2015; 3: 711–718. doi:10.1016/j.jaip.2015.03.001 - DOI - PubMed

Publication types