. 2022 Dec;10(12):e004794.
doi: 10.1136/jitc-2022-004794.

TIGIT blockade repolarizes AML-associated TIGIT+ M2 macrophages to an M1 phenotype and increases CD47-mediated phagocytosis

Affiliations

TIGIT blockade repolarizes AML-associated TIGIT+ M2 macrophages to an M1 phenotype and increases CD47-mediated phagocytosis

Franziska Brauneck et al. J Immunother Cancer. 2022 Dec.

Abstract

Background: Leukemia-associated macrophages (LAMs) represent an important cell population within the tumor microenvironment, but little is known about the phenotype, function, and plasticity of these cells. The present study provides an extensive characterization of macrophages in patients with acute myeloid leukemia (AML).

Methods: The phenotype and expression of coregulatory markers were assessed on bone marrow (BM)-derived LAM populations, using multiparametric flow cytometry. BM and blood aspirates were obtained from patients with newly diagnosed acute myeloid leukemia (pAML, n=59), patients in long-term remission (lrAML, n=8), patients with relapsed acute myeloid leukemia (rAML, n=7) and monocyte-derived macrophages of the blood from healthy donors (HD, n=17). LAM subpopulations were correlated with clinical parameters. Using a blocking anti-T-cell immunoreceptor with Ig and ITIM domains (TIGIT) antibody or mouse IgG2α isotype control, we investigated polarization, secretion of cytokines, and phagocytosis on LAMs and healthy monocyte-derived macrophages in vitro.

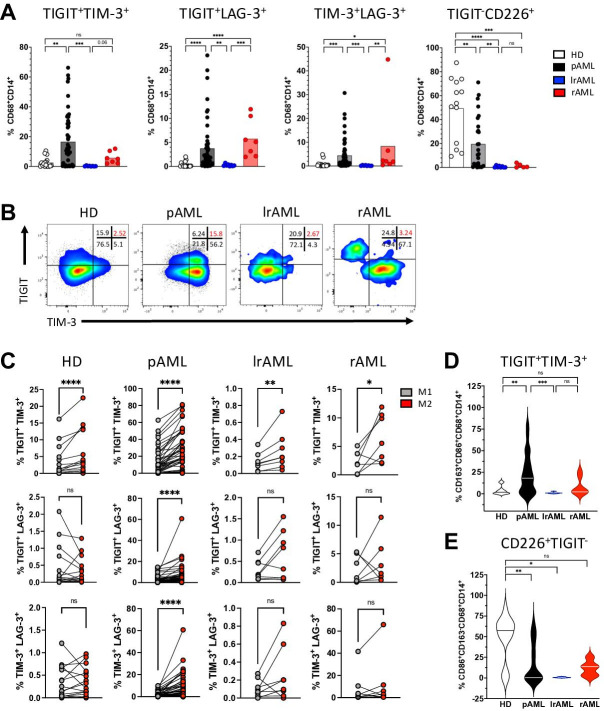
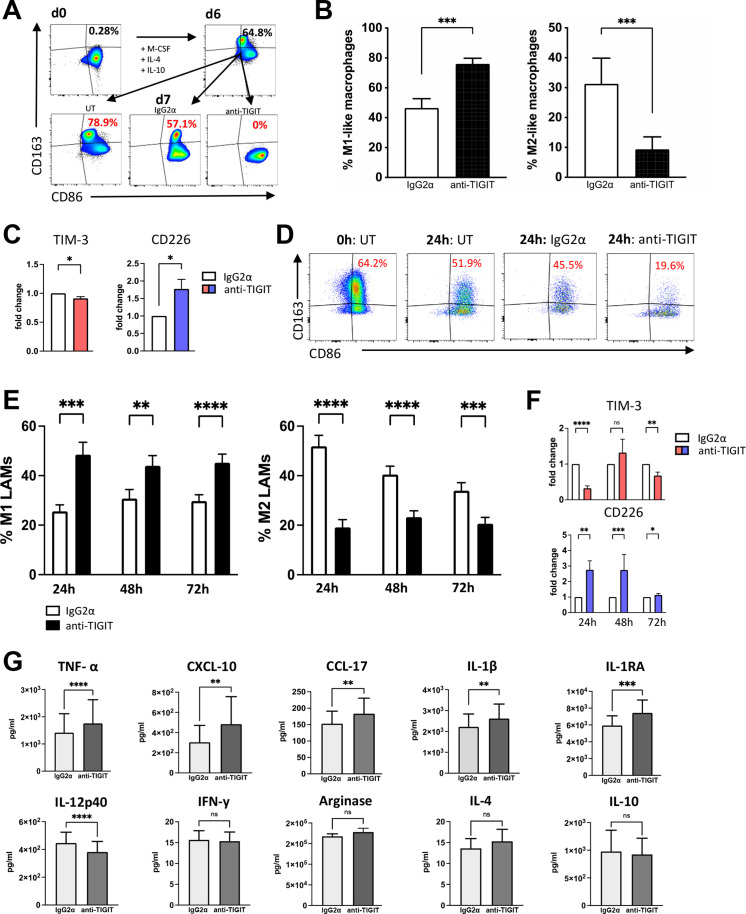
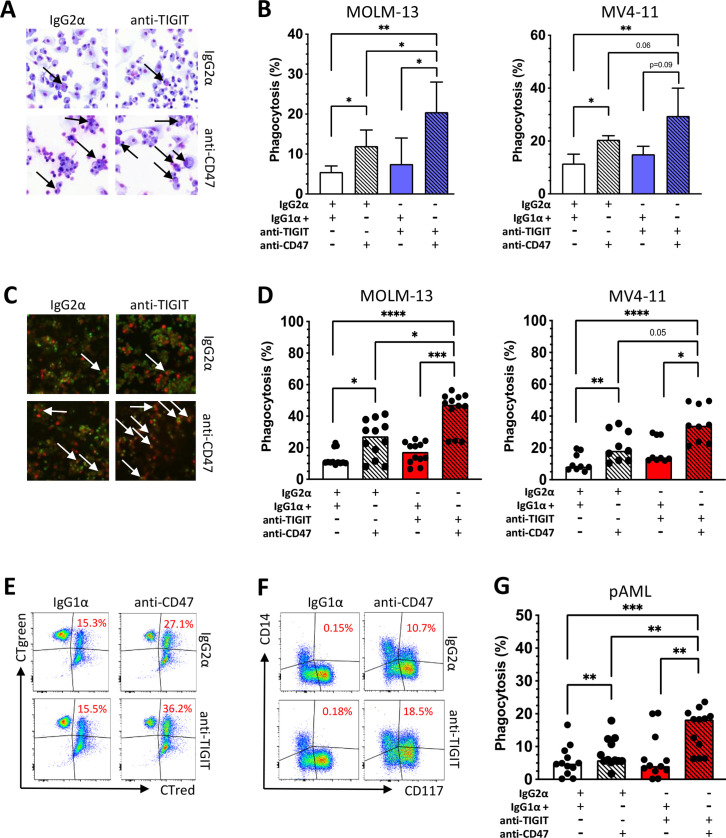
Results: In pAML and rAML, M1 LAMs were reduced and the predominant macrophage population consisted of immunosuppressive M2 LAMs defined by expression of CD163, CD204, CD206, and CD86. M2 LAMs in active AML highly expressed inhibitory receptors such as TIGIT, T-cell immunoglobulin and mucin-domain containing-3 protein (TIM-3), and lymphocyte-activation gene 3 (LAG-3). High expression of CD163 was associated with a poor overall survival (OS). In addition, increased frequencies of TIGIT+ M2 LAMs were associated with an intermediate or adverse risk according to the European Leukemia Network criteria and the FLT3 ITD mutation. In vitro blockade of TIGIT shifted the polarization of primary LAMs or peripheral blood-derived M2 macrophages toward the M1 phenotype and increased secretion of M1-associated cytokines and chemokines. Moreover, the blockade of TIGIT augmented the anti-CD47-mediated phagocytosis of AML cell lines and primary AML cells.

Conclusion: Our findings suggest that immunosuppressive TIGIT+ M2 LAMs can be redirected into an efficient effector population that may be of direct clinical relevance in the near future.

Keywords: Costimulatory and Inhibitory T-Cell Receptors; Hematologic Neoplasms; Macrophages; Metabolic Networks and Pathways; Tumor Escape.


Conflict of interest statement

Competing interests: FB: travel grant from Daiichi Sankyo, Servier, and Novartis; advisory board by Jazz, GmbH, Daiichi Sankyo. WF: personal fees and non-financial support from AbbVie; grants, personal fees, and non-financial support from Amgen and Pfizer; and personal fees from Jazz Pharmaceuticals, Celgene, Morphosys, Ariad/Incyte, Stemline Therapeutics, Daiichi Sankyo, and Servier outside the submitted work; in addition, WF has a patent for Amgen issued; and support for medical writing: Amgen, Pfizer, and AbbVie. The remaining authors declare that they have no conflict of interest.

Figures

Figure 1
Figure 1
LAMs display a shift into an immunosuppressive M2 phenotype. (A) Characteristics of M1 and M2 LAMs. (B–H) Multiparametric flow cytometry of the coexpression of CD86 and CD163 on CD14+CD68+ LAMS was performed for BM aspirates from patients with pAML (n=59), patients in lrAML (n=8), patients with rAML (n=7) and PB-derived macrophages from HDs (n=17). (B) The M1:M2 ratio is depicted for each donor. (C) tSNE analyses showing the distribution of CD86+ and CD163+ cells within the total CD14+CD68+ macrophages in BM aspirates from five patients with pAML, lrAML, rAML and PB-derived CD14+CD68+ macrophages of HDs, respectively. (D) Pie charts and exemplary flow plots illustrate the distribution of M1 and M2 macrophages in all four cohorts. (E) Summary data show the frequency of CD86+CD163 (M1) and CD163+CD86+ (M2) cells among CD14+CD68+ macrophages from patients with pAML, lrAML, rAML and HDs. (F) Exemplary flow plots display the coexpression of CD204 and CD206 with CD163 in HDs and patients with pAML. (G) Summary data show the frequency of CD163, CD204 and CD206 in patients with pAML (n=27) and HDs (n=5). (H) Summary data demonstrate the coexpression of CD163 with CD204 and CD206 in pAML. (I) Summary data show the frequency of human leukocyte antigen (HLA)-DR on M1 (CD86+CD163CD14+CD68+) macrophages from HDs (n=4) and patients with pAML (n=16). (J) Exemplary histograms show the coexpression of HLA-DR on M1 (CD86+CD163CD14+CD68+) macrophages in comparison to the control. Frequencies are displayed with the means. P values were obtained by analysis of variance, Kruskal-Wallis test and Mann-Whitney test. *P<0.05, **P<0.01. AML, acute myeloid leukemia; BM, bone marrow; FMO, fluorescence minus one; HD, healthy donor; IL, interleukin; lrAML, acute myeloid leukemia in long-term remission; LAM, leukemia-associated macrophage; ns, not significant; pAML, newly diagnosed acute myeloid leukemia; PB, peripheral blood; rAML, relapsed acute myeloid leukemia; TNF-α, tumor necrosis factor alpha; tSNE, t-distributed stochastic neighbor embedding; VEGF-A, vascular endothelial growth factor A.
Figure 2
Figure 2
TIM-3 and LAG-3 are more frequently coexpressed by M2 LAMs in pAML and rAML. Expression analyses were assessed of the coregulatory receptors TIGIT, TIM-3 and LAG-3 on CD14+CD68+ LAMs from patients with pAML (n=53), patients in lrAML (n=8), patients with rAML (n=7) and HDs (n=17). CD226 expression analyses were performed on macrophages from patients with pAML (n=29), lrAML (n=8), rAML (n=7) and HDs (n=13) using multiparametric flow cytometry. (A) Summary data showing the expression of TIGIT, CD226, TIM-3 and LAG-3 on CD14+CD68+ macrophages. (B) tSNE heat maps illustrate the expression of the coregulatory receptors on CD14+CD68+ LAMs from five PB samples of HDs (upper row), from BM aspirates of five patients with pAML (second row), BM aspirates of five patients with lrAML (third row) and five BM samples of patients with rAML (lowest row). (C) Representative histograms illustrate M2 macrophages (red histograms) and M1 macrophages (dark histograms) with their expression of TIGIT, CD226, TIM-3 and LAG-3 in comparison to the FMO controls (gray histograms), respectively. (D) The expression of coregulatory receptors was compared between paired M1 and M2 LAMs in pAML (upper panel) and rAML (lower panel). Frequencies are displayed with the means. P values were obtained by the analysis of variance and Kruskal-Wallis test and the Wilcoxon matched-pairs signed-rank test. *P<0.05, **P<0.01, ***P<0.001, ****P<0.0001. AML, acute myeloid leukemia; FMO, fluorescence minus one; HD, healthy donor; lrAML, acute myeloid leukemia in long-term remission; LAG-3, lymphocyte-activation gene 3; LAM, leukemia-associated macrophage; ns, not significant; pAML, newly diagnosed acute myeloid leukemia; PB, peripheral blood; rAML, relapsed acute myeloid leukemia; TIGIT, T-cell immunoreceptor with Ig and ITIM domains; TIM-3, T-cell immunoglobulin and mucin-domain containing-3 protein; tSNE, t-distributed stochastic neighbor embedding.
Figure 3
Figure 3
TIGIT, TIM-3 and LAG-3 are more frequently coexpressed with each other by M2 macrophages. Coexpression of coinhibitory receptors by CD14+CD68+ cells was analyzed for HDs (n=17), patients with pAML (n=53), patients in lrAML (n=8) and with rAML (n=7). (A) Coexpression of TIGIT, CD226, TIM-3 and LAG-3 is depicted on CD14+CD68+cells. (B) Exemplary flow plots illustrate coexpression of TIGIT with TIM-3. (C) Coexpression of coregulatory markers is compared between M1 and M2 LAMs. (D) M2 LAMS coexpressing TIGIT and TIM-3 are compared between different patient cohorts. (E) Expression of CD226 within the TIGIT-negative M1 population is demonstrated for the different patient cohorts. Frequencies are depicted with the means. P values were obtained by the analysis of variance and Kruskal-Wallis test and by the Wilcoxon matched-pairs signed-rank test. *P<0.05, **P<0.01, ***P<0.001, ****P<0.0001. AML, acute myeloid leukemia; HD, healthy donor; lrAML, acute myeloid leukemia in long-term remission; LAG-3, lymphocyte-activation gene 3; LAM, leukemia-associated macrophage; ns, not significant; pAML, newly diagnosed acute myeloid leukemia; rAML, relapsed acute myeloid leukemia; TIGIT, T-cell immunoreceptor with Ig and ITIM domains; TIM-3, T-cell immunoglobulin and mucin-domain containing-3 protein.
Figure 4
Figure 4
LAMs expressing TIGIT are associated with adverse risk in AML. The phenotype and receptor expression of LAMs was correlated with clinical parameters from patients with pAML (n=50). (A) The distribution of M1 and M2 LAMs is depicted according to the ELN risk classification. (B) The proportion of TIGIT+ M2 LAMs is presented according to the ELN risk classification. (C) Comparison of the frequencies of TIGIT+ M2 LAMs from patients with different molecular aberrations (FLT3 ITD mutated n=13 vs FLT3 WT n=37 and NPM1 mutated n=20 vs WT n=30). (D) Kaplan-Meier curves for high versus low CD163 expressors from GSE37642 and GSE12417 datasets (n=137 and n=240 patients, respectively). (E) Kaplan-Meier curve for CD163 high versus low expressors (left panel) and the subgroup of CD163 high/TIGIT high expressors compared with the subgroup that included all CD163 high/TIGIT low, CD163 low/TIGIT high and CD163 low/TIGIT low cases (referred to as ‘other’, right panel) in the TCGA LAML cohort. (F) Expression of CD163 correlated to the expression of CD204 and CD206 in the TCGA AML cohort. For further statistical analyses including multivariate analyses of the TCGA LAML cohort, please refer to the online supplemental 7 and online supplemental table 3A, B. P values were obtained by analysis of variance, Kruskal-Wallis test and Mann-Whitney test. Pearson test was used to test for correlations. *P<0.05, **P<0.01, ***P<0.001, ****P<0.0001. TIGIT, T-cell immunoreceptor with Ig and ITIM domains. AML, acute myeloid leukemia; ELN, European Leukemia Network; LAM, leukemia-associated macrophage; ns, not significant; pAML, newly diagnosed acute myeloid leukemia; TIGIT, T-cell immunoreceptor with Ig and ITIM domains; WT, wild type.
Figure 5
Figure 5
Blockade of TIGIT reprograms TIGIT+ M2 LAMs into M1 LAMs and increases cytokine secretion in vitro. The effect of blocking TIGIT on M2+ macrophages was examined on the polarization and cytokine secretion of PB monocyte-derived macrophages and BM-derived LAMs in vitro. (A) Exemplary FACS plots of M2-like macrophages gained by 6 days in vitro differentiation from CD14+ monocytes of HDs (n=5) that were treated with anti-TIGIT antibodies (mAb) or controls for additional 24 hours. (B) The percentages of M1-like (CD86+CD163CD68+CD14+) macrophages (left panel) or M2-like (CD163+CD86+CD68+CD14+, right panel) macrophages are depicted as the median frequency±SD. (C) Expression of TIM-3 and CD226 was compared between anti-TIGIT treated and control mAb treated M0-like (CD68+CD14+) macrophages. (D) Exemplary FACS plots of primary LAMS from patients with pAML. (E) The percentages of M1 (left panel) and M2 LAMS (right panel) are depicted as the median frequency±SD. (F) Illustration of the frequency of TIM-3+ and CD226+ LAMs after treatment with the anti-TIGIT antibody or control mAb. (G) Cytokine levels (pg/mL) were compared between the supernatants of anti-TIGIT or control mAb treated LAMs using the BioLegend Legendplex kit (n=10). P values were obtained by the Wilcoxon matched-pairs signed-rank test. *P<0.05, **P<0.01, ***P<0.001, ****P<0.0001. BM, bone marrow; HD, healthy donor; IL, interleukin; LAM, leukemia-associated macrophage; M-CSF, macrophage colony-stimulating factor; pAML, newly diagnosed acute myeloid leukemia; PB, peripheral blood; TIGIT, T-cell immunoreceptor with Ig and ITIM domains; TIM-3, T-cell immunoglobulin and mucin-domain containing-3 protein.
Figure 6
Figure 6
Blockade of TIGIT increases CD47-dependent phagocytosis of AML cell lines and primary AML cells in vitro. To assess antibody-mediated phagocytosis, monocyte-derived M2 macrophages from HDs were incubated for 24 hours with a blocking anti-TIGIT or isotype control antibody and then cocultured for 4 hours with AML cells (MOLM-13 n=4 and MV4-11 n=4) in the presence or absence of an anti-CD47 antibody or an IgG1α isotype control mAb. (A) Phagocytosis analyzed by light microscopy following Pappenheim staining. (B) Summary data show the cellular phagocytosis of AML cells measured by light microscopy. (C) In addition, phagocytosis is displayed by epifluorescence microscopy following CTgreen and CT red staining. (D) Antibody-mediated phagocytosis of CTgreen labeled AML cell lines MOLM-13 (n=4) and MV4-11 (n=3) and CT red-labeled PB-derived macrophages analyzed by multiparametric flow cytometry (% phagocytosis was defined by CT green+ and CT red+ cells). (E) Representative flow cytometry plots showing phagocytosis of AML cells by PB-derived macrophages (double-positive cells in the right upper quadrants). (F) Phagocytosis of primary bone marrow-derived CD117+CD14 AML cells by autologous CD117CD14+ macrophages is illustrated in exemplary FACS plots (indicated by double positivity for CD14 and CD117). (G) Antibody-mediated phagocytosis of primary AML cells is demonstrated (% phagocytosis was defined by CD14+ and CD117+ cells). Measurements were performed in technical triplicates. P values were obtained by analysis of variance and Friedman test. *P<0.05, **P<0.01, ***P<0.001, ****P<0.0001. AML, acute myeloid leukemia; HD, healthy donor; pAML, newly diagnosed acute myeloid leukemia; PB, peripheral blood; TIGIT, T-cell immunoreceptor with Ig and ITIM domains.

References

    1. Sallman DA, Asch AS, Kambhampati S. The first-in-class anti-CD47 antibody magrolimab combined with azacitidine is well-tolerated and effective in AML patients: phase 1B results.. 2020 ASH Annu Meet Expo 2020 ASH Annu Meet Expo Abstr 330 Present December 6, 2020;2020:64–6.
    1. Haddad F, Daver N. Targeting CD47/sirpα in acute myeloid leukemia and myelodysplastic syndrome: preclinical and clinical developments of magrolimab. J Immunother Precis Oncol 2021;4:67–71. 10.36401/JIPO-21-X2 - DOI - PMC - PubMed
    1. Tahk S, Schmitt S, Augsberger CP, et al. . Evaluation of a bifunctional Sirpα-CD123 fusion antibody for the elimination of acute myeloid leukemia stem cells. Blood 2019;134:2544. 10.1182/blood-2019-128145 - DOI
    1. Ponce LP, Fenn NC, Moritz N, et al. . SIRPα-antibody fusion proteins stimulate phagocytosis and promote elimination of acute myeloid leukemia cells. Oncotarget 2017;8:11284–301. 10.18632/oncotarget.14500 - DOI - PMC - PubMed
    1. Li Y, You MJ, Yang Y, et al. . The role of tumor-associated macrophages in leukemia. Acta Haematol 2020;143:112–7. 10.1159/000500315 - DOI - PubMed

Publication types