. 2022 Dec 22;13(1):7890.
doi: 10.1038/s41467-022-35452-6.

Cross-kingdom synthetic microbiota supports tomato suppression of Fusarium wilt disease

Affiliations

Cross-kingdom synthetic microbiota supports tomato suppression of Fusarium wilt disease

Xin Zhou et al. Nat Commun. .

Erratum in

Abstract

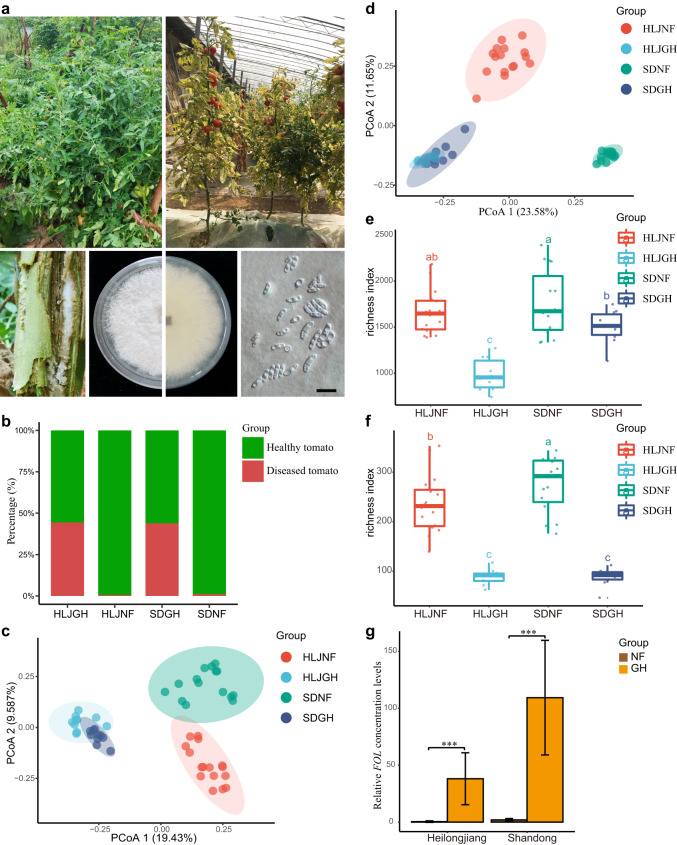
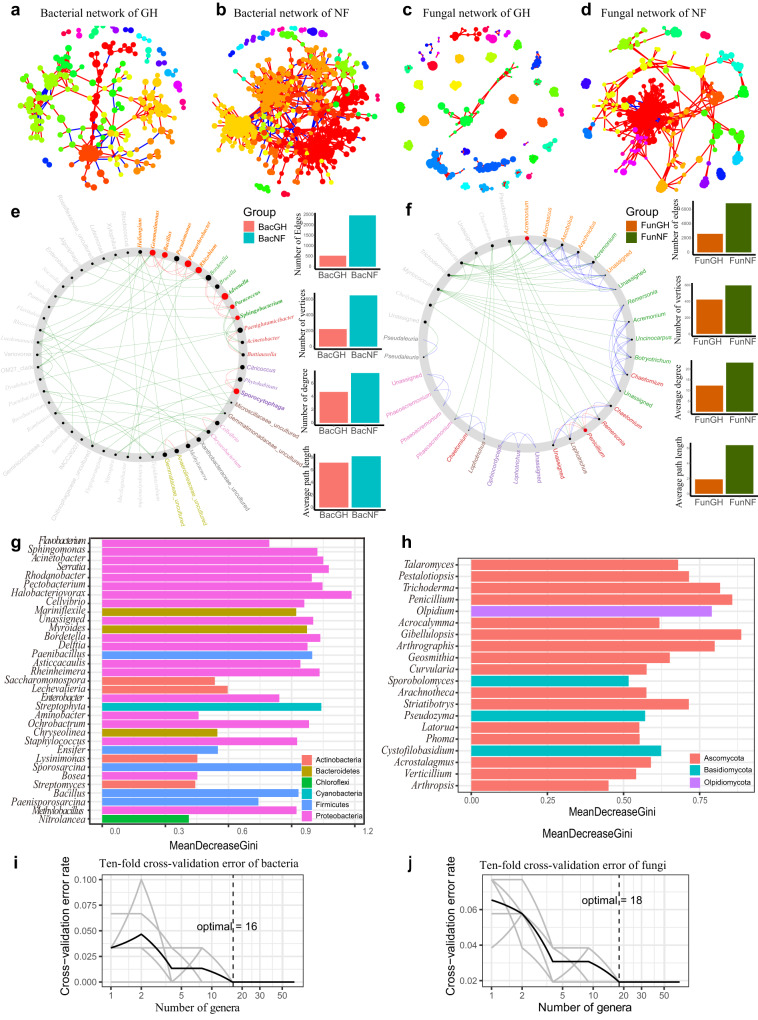
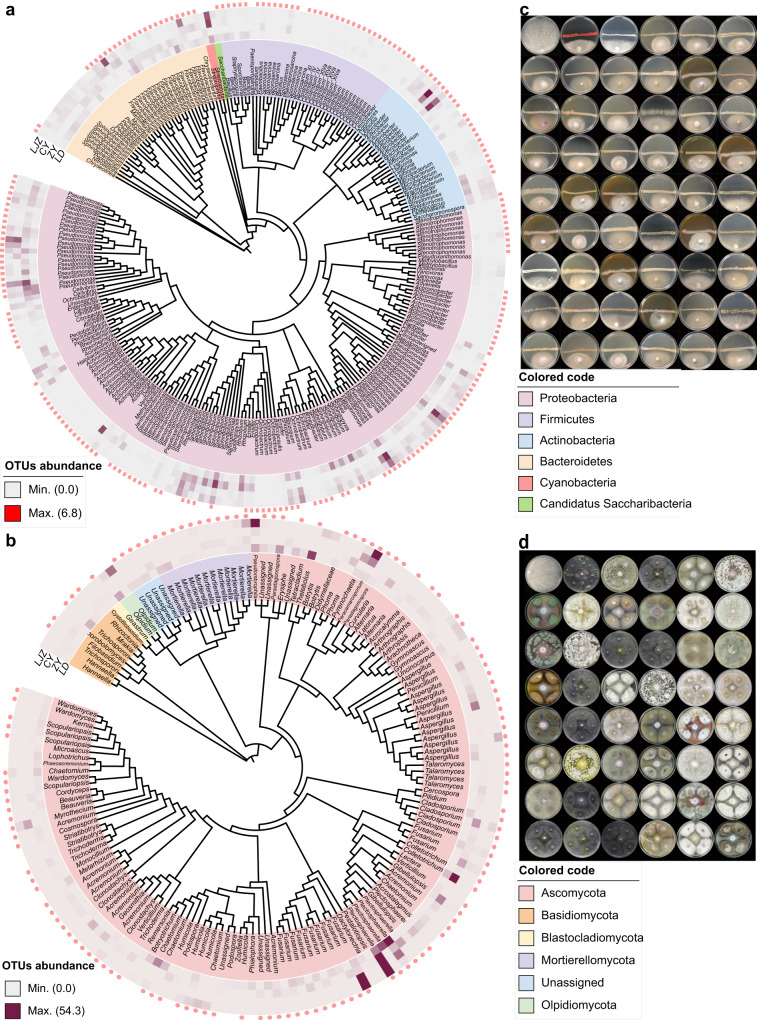
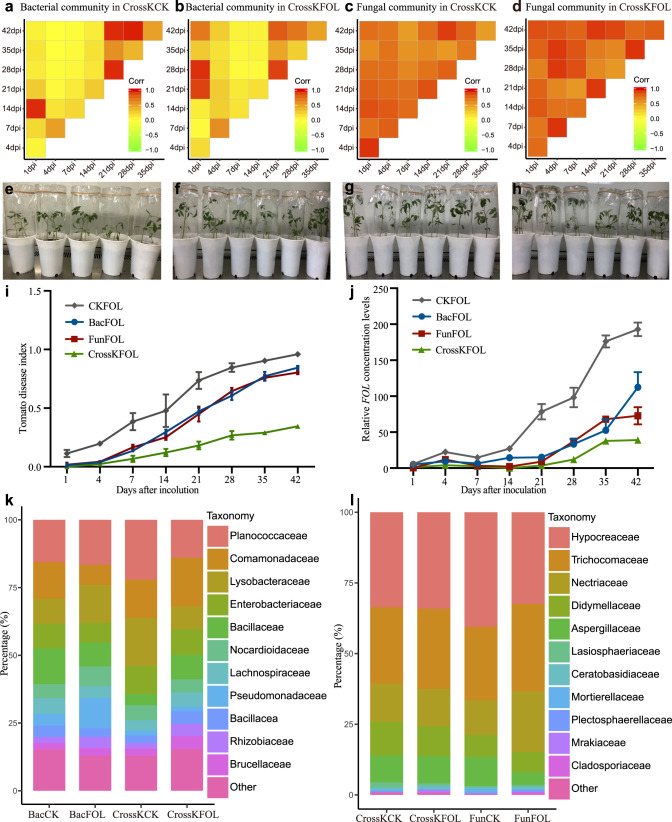
The role of rhizosphere microbiota in the resistance of tomato plant against soil-borne Fusarium wilt disease (FWD) remains unclear. Here, we showed that the FWD incidence was significantly negatively correlated with the diversity of both rhizosphere bacterial and fungal communities. Using the microbiological culturomic approach, we selected 205 unique strains to construct different synthetic communities (SynComs), which were inoculated into germ-free tomato seedlings, and their roles in suppressing FWD were monitored using omics approach. Cross-kingdom (fungi and bacteria) SynComs were most effective in suppressing FWD than those of Fungal or Bacterial SynComs alone. This effect was underpinned by a combination of molecular mechanisms related to plant immunity and microbial interactions contributed by the bacterial and fungal communities. This study provides new insight into the dynamics of microbiota in pathogen suppression and host immunity interactions. Also, the formulation and manipulation of SynComs for functional complementation constitute a beneficial strategy in controlling soil-borne disease.


Conflict of interest statement

The authors declare no competing interests.

Figures

Fig. 1
Fig. 1. Images of natural field-grown (NF) and greenhouse-grown (GH) tomato plants, and microbial diversity and community composition at different sites.
a Top row: representative NF and GH tomato sampling sites. Different tomato plants were collected at each natural field and greenhouse sites (left and right, accordingly) and 10–16 tomato plants were sampled as biological replicates for each site, respectively. Bottom row: isolation of F. oxysporum f. sp. lycopersici (FOL) from tomato (far left); representative FOL colony growing on PDA, photographed from above and from below (center left and center right, respectively); and representative FOL conidial morphology (far right) (black scale bar = 10 μm). b FWD disease incidence rates in different plant groups (HLJNF, HLJGH, SDNF, and SDGH). c Bray–Curtis dissimilarity analysis of fungal communities. The NF rhizosphere fungal communities from both Shandong and Heilongjiang Provinces are separated from their respective GH communities along the two axes (P < 0.001, PERMANOVA by Adonis). Ellipses cover 80% of the data for each sampling site. d Bray–Curtis dissimilarity analysis of bacterial communities (principal coordinates PCo1 and PCo2). The NF rhizosphere microbiota from both Shandong and Heilongjiang Provinces are separated from their respective GH microbiota along the two axes (P < 0.001, PERMANOVA by Adonis). Ellipses cover 80% of the data for each sampling site. e, f Bacterial (e) and fungal (f) zOTUs richness in tomato rhizosphere samples collected at different sites. Different lowercase letters denote significant differences between the groups (HLJNF, HLJGH, SDNF, and SDGH) (P < 0.05, one-way ANOVA and Tukey HSD). HLJNF, field tomato of Heilongjiang province; HLJGH, greenhouse tomato of Heilongjiang province; SDNF, field tomato of Shandong province; SDGH, greenhouse tomato of Shandong province. The number of samples per group is as follows: HLJNF (n = 16 biologically independent plants), HLJGH (n = 10 biologically independent plants), SDNF, (n = 15 biologically independent plants), and SDGH (n = 10 biologically independent plants). The horizontal line within boxes represent medians, tops and bottoms of boxes represent the 75th and 25th percentiles, and upper and lower whiskers extend to data no more than 1.5 times the interquartile range from the upper edge and lower edge of the box, respectively. g Comparison of FOL levels in NF and GH tomato plants from Heilongjiang and Shandong Provinces (n = 5 biologically independent plants). Data bars represent means, and error bars represent the standard error of mean (s.e.m). *** indicate significant differences between NF and GH groups at P < 0.001 (two-sided Wilcoxon rank-sum test).
Fig. 2
Fig. 2. Selection of bacterial and fungal taxa for SynComs based on co-occurrence, NetShift, and random-forest analyses.
a, b Bacterial networks. GH (a) and NF (b) networks are shown. The nodes are colored to indicate different bacterial modules. c, d Fungal networks. GH (c) and NF (d) networks are shown. The nodes are colored to indicate different fungal modules. The correlations were inferred from zOTUs abundance profiles using the Spearman method and only the robust and significant (correlation values <−0.7 or >0.7 and P < 0.001) correlations were maintained for the construction of co-occurrence networks. Each node corresponds to the bacterial or fungal zOTUs, and edges between nodes correspond to either positive (red line) or negative (blue line) correlations. The statistical test used was two-sided. e, f Potential NF keystone taxa determined based on bacterial co-occurrence networks in NF and GH plant microbiomes. Data for bacteria (e) and fungi (f) are shown. Bar plots illustrate comparisons of network edges, vertices, degrees, and average path lengths in NF and GH. The big red nodes were calculated based on scaled NESH score and represent particularly important NF driver taxa. The corresponding taxon names are shown in bold. Red lines indicate node (taxa) connections present only in the NF plant microbiome; green lines indicate associations present only in the GH plant microbiome; and blue lines indicate associations present in both the NF and GH plant microbiomes. g Sixteen biomarker bacterial genera identified by employing random-forest classification of the relative abundance in the tomato rhizosphere. h Eighteen biomarker fungal genera identified by employing random-forest classification of the relative abundance in the tomato rhizosphere. Horizontal length indicates the importance to the accuracy of the random-forest mode. The tenfold cross-validation error and the identified numbers of bacterial biomarkers (i), and fungal biomarkers (j), were used to differentiate field tomato groups from greenhouse tomato groups.
Fig. 3
Fig. 3. Tomato root-associated bacterial and fungal culture collections that cover the majority of species detectable by culture-independent sequencing.
a, b Phylogenetic trees showing the diversities of root-associated bacterial (a) and fungal (b) zOTUs frequently detected in the NF tomato (with a relative abundance over 0.1%). The middle ring (heatmap) represents the relative abundance of each node zOTUs presented at four different sampling locations. The outer ring (pink elliptical points) represents bacterial zOTU identified among the isolated and cultivated bacterial and fungal strains derived from NF tomato plants. LJZ, Luojiazhuang; CY, Changyi; ZY, Zhaoyuan; LD, Lindian. c Representative images of bacterial species that strongly inhibited FOL in antagonism tests. The bacterial species names, inhibition rate (%), and inhibition zone (cm) of different bacterial strain have been provided in Supplementary Data 12. In the images, the top left photograph shows the control FOL medium without inoculation of the tested bacterial strain; the middle horizontal line is the growth of the tested bacterial strain, and the growth below the line is the FOL strain. d Representative images of fungal species that strongly inhibited FOL in antagonism tests. The fungal species names are provided in Supplementary Data 13. In the images, the first top left photograph shows the control FOL medium without inoculation of the tested fungal strain; the FOL strain grows in the middle of the plate, and the tested fungal strain grows in the four corners of each plate.
Fig. 4
Fig. 4. Relative abundance dynamics of the constituents of different SynComs after inoculation of germ-free tomato seedlings, and FWD index under different treatments after 42 d of growth in a sterile growth chamber.
ad The pairwise correlations between CrossKCK and CrossKFOL SynComs of bacterial or fungal communities at different time points as reflected by Pearson’s correlation coefficients. The yellow color indicates the value of Pearson’s correlation coefficients lower than 0.5, and the red color indicates the value of Pearson’s correlation coefficients greater than 0.5. eh Representative images of germ-free tomato seedlings at 14 d inoculated only with FOL (e), FOL together with bacterial SynComs (f), FOL together with fungal SynComs (g), or FOL together with cross-kingdom (bacteria and fungi) SynComs (h). i FOL disease indexes of tomato inoculated with CKFOL, BacFOL SynComs, FunFOL SynComs, and CrossKFOL SynComs during 42 d of growth in a sterile growth chamber were compared (P < 0.05, Kruskal–Wallis test with Dunn’s post hoc test, n = 24 biologically independent plants). Each time point represents the mean FWD index ± s.e.m. (n = 24 biologically independent plants). j The FOL levels in the CKFOL, BacFOL SynComs, FunFOL SynComs, and CrossKFOL SynComs were compared (P < 0.05, Kruskal–Wallis test with Dunn’s post hoc test, n = 3 biologically independent plants). Each vertical bar represents the s.e.m from three biologically replicates. k, l Relative abundance of dominant bacterial (k) and fungal taxa (l) in different SynComs groups at the family level. CKFOL, germ-free tomato plants inoculated with FOL; BacFOL, germ-free tomato plants inoculated with Bac SynComs and FOL; FunFOL, germ-free tomato plants inoculated with Fun SynComs and FOL; CrossKCK, germ-free tomato plants inoculated with cross-kingdom SynComs without FOL; CrossKFOL, germ-free tomato plants inoculated with cross-kingdom SynComs and FOL.
Fig. 5
Fig. 5. Longitudinal dynamics of bacterial and fungal communities in tomato seedlings after inoculation of different SynComs.
a The dynamics of bacterial alpha diversity of CrossKCK, CrossKFOL, BacCK, and BacFOL (n = 3 biologically independent plants). b The dynamics of fungal alpha diversity of CrossKCK, CrossKFOL, FunCK, and FunFOL (n = 3 biologically independent plants). The horizontal lines within boxes represent medians; tops and bottoms of boxes represent the 75th and 25th percentiles; and upper and lower whiskers extend to data no more than 1.5 times of the interquartile range from the upper edge and lower edge of the box, respectively. Bacterial abundance in BacFOL (c) and CrossKFOL (d) SynComs, at the genus level, with the changes in relative abundance traced at different growth time points. Fungal abundance in the FunFOL (e) and CrossKFOL (f) SynComs, at the genus level, with the changes in relative abundance traced at different growth time points.
Fig. 6
Fig. 6. Relative abundance of plant transcripts and expression of biomarker genes in different SynComs groups based on real-time reverse-transcription-quantitative polymerase chain reaction (RT-qPCR), transcriptome sequencing, and metagenomic sequencing.
a, b Expression of genes for salicylic acid (SA)-responsive LOX defensin (a) and jasmonic acid (JA) pathogenesis-related protein 1 acidic (PR1α) (b), determined using RT-qPCR, in different SynComs groups at the specified time points. The statistical significance was calculated based on two-way ANOVA and Tukey HSD (P < 0.05) and the statistical test used was two-sided. Values are means of three independent replicates with standard error (SE). The expression of each gene was normalized to that of the β-actin reference gene (n = 3 biologically independent plants). c Comparison of tomato plant GO term enrichment in plants inoculated with cross-kingdom, bacterial, and fungal SynComs (Benjamini–Hochberg adjusted two-way ANOVA P value <0.05). The q value means FDR-adjusted P values and the size of “Count” indicates the number of significantly enriched genes contained in the corresponding pathways; the larger the point the greater the number of significantly enriched genes. d Venn diagram of significantly differentially expressed genes (compared with CK group, FDR < 0.05) in tomato plants inoculated with cross-kingdom, bacterial, and fungal SynComs. e Bar plot of relative abundance of biomarkers of resistance pathway genes in cross-kingdom, bacterial, and fungal SynComs. Bac, germ-free tomato plants inoculated with bacterial SynComs; Fun, germ-free tomato plants inoculated with fungal SynComs; CrossK, germ-free tomato plants inoculated with cross-kingdom SynComs.

Similar articles

Cited by

References

    1. Gordon TR. Fusarium oxysporum and the Fusarium wilt syndrome. Annu. Rev. Phytopathol. 2017;55:23–39. doi: 10.1146/annurev-phyto-080615-095919. - DOI - PubMed
    1. Srinivas C, et al. Fusarium oxysporum f. sp. lycopersici causal agent of vascular wilt disease of tomato: biology to diversity—a review. Saudi J. Biol. Sci. 2019;26:1315–1324. doi: 10.1016/j.sjbs.2019.06.002. - DOI - PMC - PubMed
    1. Zhou X, Wang J-T, Wang W-H, Tsui CKM, Cai L. Changes in bacterial and fungal microbiomes associated with tomatoes of healthy and infected by Fusarium oxysporum f. sp. lycopersici. Microb. Ecol. 2021;81:1004–1017. doi: 10.1007/s00248-020-01535-4. - DOI - PubMed
    1. Preece C, Peñuelas J. A return to the wild: root exudates and food security. Trends Plant Sci. 2020;25:14–21. doi: 10.1016/j.tplants.2019.09.010. - DOI - PubMed
    1. Liu H, et al. Evidence for the plant recruitment of beneficial microbes to suppress soil-borne pathogens. N. Phytol. 2021;229:2873–2885. doi: 10.1111/nph.17057. - DOI - PubMed

Publication types