. 2022 Dec 22;13(1):7872.
doi: 10.1038/s41467-022-35383-2.

Astrocytes amplify neurovascular coupling to sustained activation of neocortex in awake mice

Affiliations

Astrocytes amplify neurovascular coupling to sustained activation of neocortex in awake mice

Adam Institoris et al. Nat Commun. .

Abstract

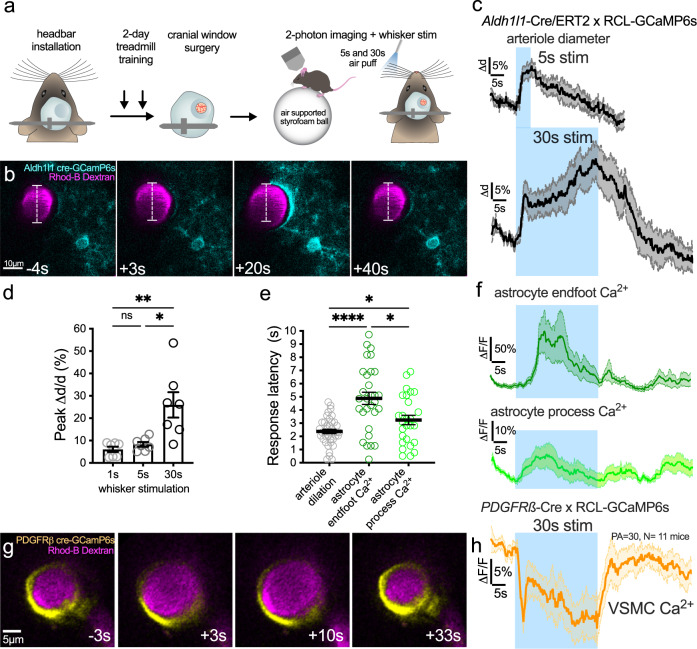
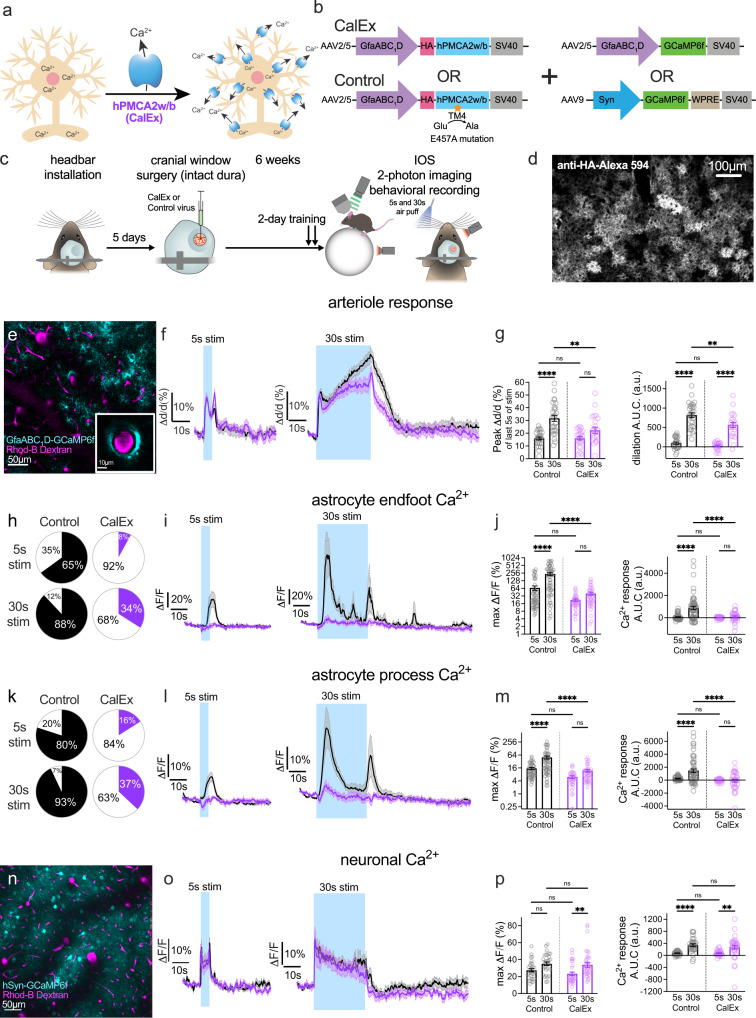
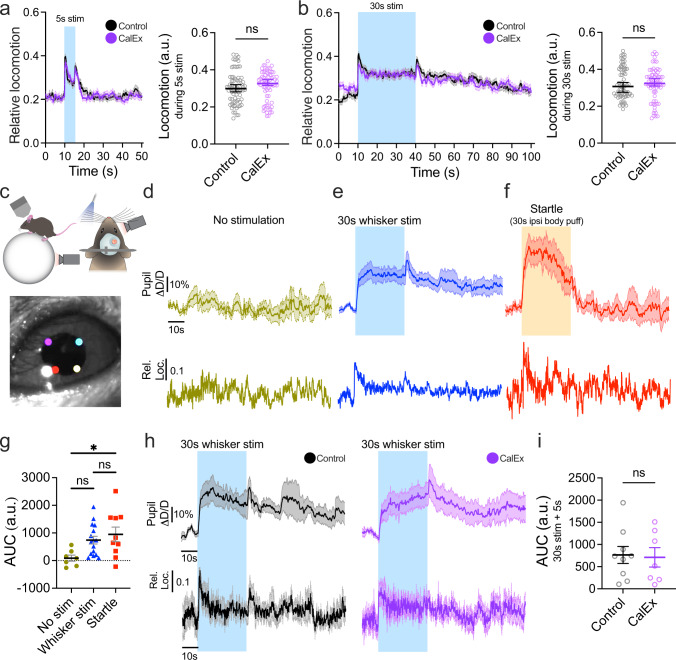
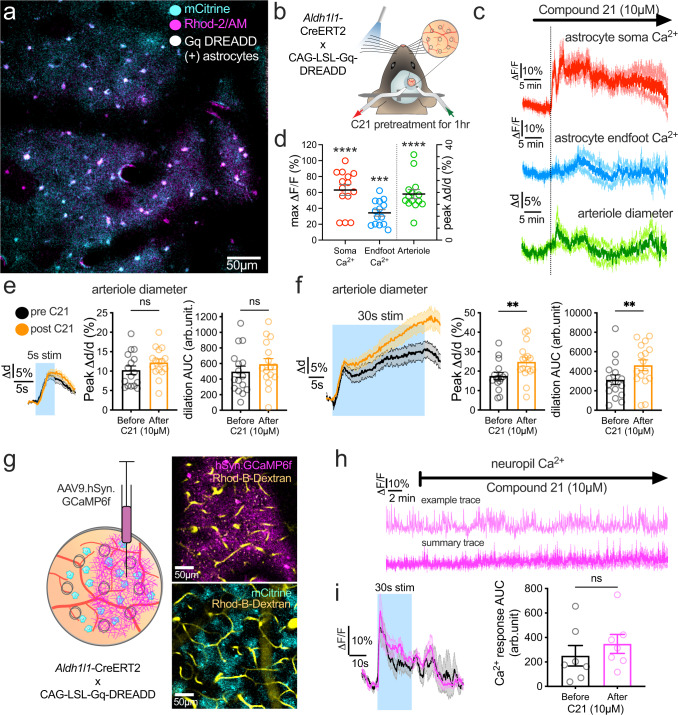
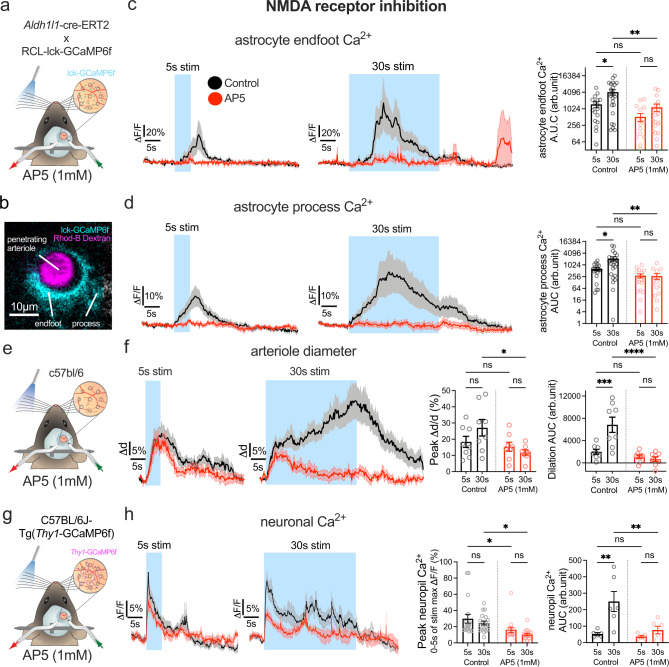
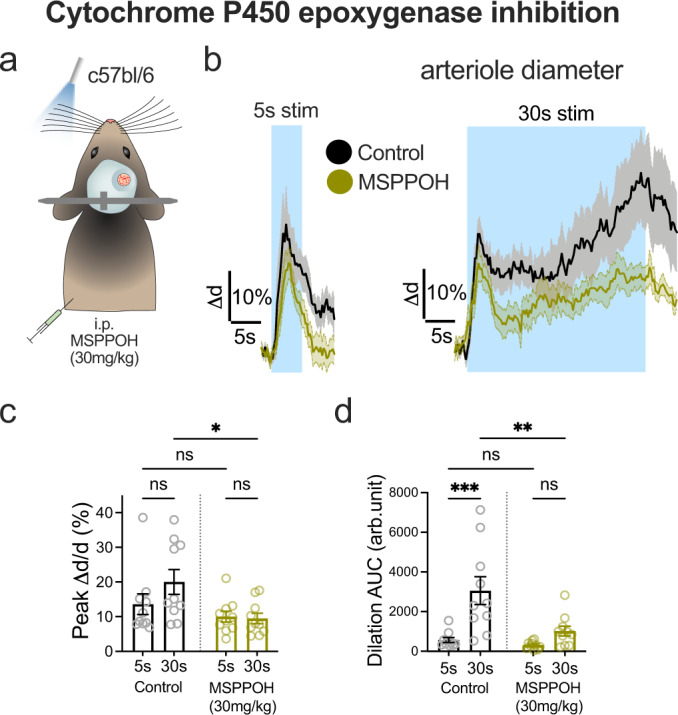
Functional hyperemia occurs when enhanced neuronal activity signals to increase local cerebral blood flow (CBF) to satisfy regional energy demand. Ca2+ elevation in astrocytes can drive arteriole dilation to increase CBF, yet affirmative evidence for the necessity of astrocytes in functional hyperemia in vivo is lacking. In awake mice, we discovered that functional hyperemia is bimodal with a distinct early and late component whereby arteriole dilation progresses as sensory stimulation is sustained. Clamping astrocyte Ca2+ signaling in vivo by expressing a plasma membrane Ca2+ ATPase (CalEx) reduces sustained but not brief sensory-evoked arteriole dilation. Elevating astrocyte free Ca2+ using chemogenetics selectively augments sustained hyperemia. Antagonizing NMDA-receptors or epoxyeicosatrienoic acid production reduces only the late component of functional hyperemia, leaving brief increases in CBF to sensory stimulation intact. We propose that a fundamental role of astrocyte Ca2+ is to amplify functional hyperemia when neuronal activation is prolonged.


Conflict of interest statement

The authors declare no competing interests.

Figures

Fig. 1
Fig. 1. Sustained functional hyperemia escalates and is associated with delayed astrocyte Ca2+ transients.
a Cartoon and timeline of the awake mouse, acute cranial window (skull + dura removal), 2-photon imaging experiment in barrel cortex. b Time series images showing dilation of a Rhodamine (Rhod)-B-dextran labeled penetrating arteriole (magenta, median filtered image) and Ca2+ responses (cyan) of a GCaMP6s-expressing astrocyte in response to 30 s whisker stimulation at 3, 20 and 40 s in an Aldh1l1-CreERT2 × RCL-GCaMP6s mouse (representative of n = 9 mice). Time stamps refer to stimulation onset as 0 s. c Traces of arteriole dilation (black) to 5 and 30 s whisker stimulation. N = 28 trials (T) of 12 penetrating arterioles (PA) from 9 mice. d Summary data of peak arteriole dilation to 1, 5, and 30 s whisker stimulation. Friedman test (one-sided). N = 7 PA from 6 mice. e Summary of response onset (calculated from each trial as 3 × SD above baseline) for dilation and astrocyte Ca2+ from 13 PA of 9 mice. Arteriole dilation T = 39, astrocyte endfoot Ca2+:T = 30 astrocyte process Ca2+: T = 27. Mixed effect analysis (two-sided) with Holm–Sidak’s multiple comparison. f Astrocyte endfoot (dark green) and astrocyte arbor (light green) Ca2+ traces to 30 s whisker stimulation. g Time series images of GcaMP6s expressing vascular smooth muscle cells (VSMC)(yellow) within a penetrating arteriole loaded with Rhod-B-Dextran (magenta). Each image is an average projection of 4 raw images. h VSMC Ca2+ trace during 30 s whisker stimulation. N = 30 PA from 11 mice. All average trace and summary dot plot data show mean ± SEM. For further statistical details see Supplementary Table 1. Source data are provided as a Source Data file.
Fig. 2
Fig. 2. Clamping astrocyte Ca2+ reduces the late phase of functional hyperemia.
a Cartoon of astrocyte Ca2+ extrusion tool: a high-affinity plasma membrane Ca2+ ATPase hPMCA2w/b (CalEx). b Viral vector strategy to express CalEx (Top Left) in astrocyte (or control virus- Bottom Left) plus GCaMP6f targeting astrocytes (Top Right) or neurons (Bottom Right). c Timeline from viral vector intracortical injection to the imaging experiment. d Representative post hoc immunofluorescence of CalEx expression against the fused Hemagglutinin (HA) reporter completed in 7 CalEx and 5 Control mice. e Representative image of gfaABC1D-GCaMP6f expressing astrocytes (cyan, median filtered) and Rhodamine (Rhod)-B-Dextran loaded vasculature (magenta, median filtered) during startle in layer 2/3 of the barrel cortex in a control mouse (similar in 5 more mice) (channels were merged from separate acquisitions as startle experiments were performed before vascular dye loading). f Average arteriole diameter traces in CalEx and Control for 5 s (Left) and 30 s (Right) whisker stimulation. g Left: summary data showing peak arteriole dilation of the last 5 s of the stimulation period. Right: net Area Under the Curve (AUC: 40 s from stimulation onset) in the four conditions. Control, 5 s stim: n = 26 penetrating arterioles (PA), Control 30 s stim: n = 28 PA from 11 mice; CalEx, 5 s and 30 s stim: n = 23 PA from 10 mice. h Evoked astrocyte endfoot Ca2+ event occurrence. Black (control) and purple (CalEx) slices are events, white is no event detected. An event is >3 standard deviation of baseline. i Summary time series data of astrocyte endfoot Ca2+ in CalEx vs control for both 5 s (Left) and 30 s (Right) whisker stimulation. j Left: Summary bar graph of peak astrocyte endfoot Ca2+ signal. Right: net AUC (stimulation + 10 s) data in the four conditions. Control, 5s stim: n = 51 trials, penetrating arterioles (PA), Control 30 s stim: n = 57 trials, 18 PA from 6 mice; CalEx, 5 s stim: n = 36 trials, and 30 s stim: n = 38 trials 12 PA from 5 mice. km Same as hj but for astrocyte arbor Ca2+. Control, 5 s stim: n = 48 trials, 16 PA, Control 30 s stim: n = 54 trials, 17 PA from 6 mice; CalEx, 5 s stim: n = 36 trials, and 30 s stim: n = 37 trials 12 PA from 5 mice. n AAV9.hSyn.GCaMP6f expressing neurons (cyan) and Rhodamine-B-Dextran loaded vasculature (magenta, median filtered image) in layer 2/3 of the barrel cortex. Representative example of 10 experiments. o Average neuronal Ca2+ traces in CalEx and Control for 5 s (Left) and 30 s (Right) whisker stimulation. p Left: summary data showing peak neuronal Ca2+ during the stimulation period. Right: net AUC of the stimulation period in the four conditions. Control, 5 s stim: n = 30 trials, 10 PA; Control 30 s stim: n = 30 trials, 10 PA from 5 mice; CalEx, 5 s stim: n = 32 trials, and 30 s stim: n = 38 trials 11 PA from 5 mice. All average trace and summary dot plot data show mean ± SEM. All statistical tests are Two-way ANOVA with Tukey’s multiple comparisons (two-sided). For further statistical details see Supplementary Table 2. Source data are provided as a Source Data file.
Fig. 3
Fig. 3. Locomotion and arousal changes do not underlie CalEx effect on sustained functional hyperemia.
a Left: Average traces and (Right) summary data of relative locomotion during 5 s whisker stimulation for Control and CalEx mice. Mann-Whitney test (two-tailed). Control, 5 s stim: n = 73 trials from 11 mice. CalEx, 5 s stim: n = 67 trials from 10 mice. b Same as a but for 30 s whisker stimulation. Control, 30s stim: n = 75 trials from 11 mice. CalEx, 30 s stim: n = 69 trials from 10 mice. c Cartoon of locomotion (Top Left) and pupil (Top Right) recording with infrared cameras. Bottom: Pupil diameter tracking in two axes with the DeepLabCut tracking toolbox performed in n = 16 mice. d Average traces of relative pupil diameter and relative locomotion (mean only) during no stimulation recording, n = 28 trials, 7 mice; during e 30 s whisker stimulation, n = 68 trials, 16 mice; and during f startle evoked by 30 s ipsilateral neck air puff, n = 22 trials, 10 mice (df: CalEx and Control combined). g Summary data of net Area Under the Curve (AUC) for pupil diameter for 35 s of no stimulation (n = 7 mice), for 30 s whisker stimulation + 5 s post-stimulation (n = 16 mice) and 30 s startle + 5 s post-startle period (n = 10 mice). One-way ANOVA with Tukey’s multiple comparisons. h Average traces of relative pupil diameter and relative locomotion during 30 s whisker stimulation in Control (Left) and CalEx mice (Right). Control: n = 38 trials from 9 mice. CalEx: n = 30 trials from 7 mice. i Summary data of net AUC for relative pupil diameter changes (stimulation + 5 s) in the Control (n = 9 mice) and CalEx (n = 7 mice) groups. Mann-Whitney test (two-tailed). All average trace and summary dot plot data show mean ± SEM. For further statistical details see Supplementary Table 3. Source data are provided as a Source Data file.
Fig. 4
Fig. 4. Chemogenetic stimulation of astrocytes enhances the late phase of sustain functional hyperemia.
a Representative 2-photon image in barrel cortex (one from seven animals) of a Aldh1l1-Cre x CAG-LSL-Gq-DREADD mouse. Astrocytes are loaded with Rhod-2/AM (magenta, median filtered) and express Gq-DREADD-mCitrine (cyan, median filtered). b Cartoon of awake mouse sensory stimulation experiment in the presence of C21 delivered via a perforated window. c Average traces of astrocyte soma and endfoot Ca2+ and penetrating arteriole (PA) diameter in response to the local superfusion of the DREADD agonist C21 into the perforated window (n = 7 mice). d Summary data of peak responses to C21 application. All comparisons were Paired t tests (two-sided). Astrocyte soma Ca2+: n = 14 astrocyte somata and endfeet (average of 38 cells), and n = 14 PA. All data are from 7 mice. e Left: Average arteriole diameter traces in pre-drug control (black) and in the presence of C21 (orange), in response to 5 s whisker stimulation (n = 16 PA from 6 mice). Right: summary data showing peak dilation and Area Under the Curve (AUC) for 5 s in control and C21. Peak dilation and AUC of dilation: Paired t test (two-sided). N = 16 PA, 6 mice. f Same as e but for 30 s whisker stimulation. g Left: Cartoon showing the site of AAV9.hSyn.GCaMP6f injection 4 weeks prior to acute cranial window experiment. Top Right: Representative image from experiments in 5 mice of neuronal AAV9.hSyn.GCaMP6f expression (magenta) and Rhodamine-B-Dextran (yellow, median filtered image) labeled vasculature in the lateral side of the window imaged at 920 nm. Bottom Right: image of astrocytic mCitrine expression (cyan) in the medial side of the window imaged at 980 nm. h Time series measurements of neuronal Ca2+ in response to the local superfusion of the DREADD agonist C21 into the perforated window. Upper trace shows a representative region of interest (ROI). Lower trace shows averaged data, n = 5 ROI from 5 mice. i Average neuronal Ca2+ traces in pre-drug control (black) and in the presence of C21 (magenta), in response to 30 s whisker stimulation. n = 7 perivascular ROI from 5 mice. Right: summary data showing AUC for 30 s stimulation before and after C21. Paired t test (two-sided). All average trace and summary dot plot data show mean ± SEM. For further statistical details see Supplementary Table 4. Source data are provided as a Source Data file.
Fig. 5
Fig. 5. NMDA receptor inhibition abolishes astrocyte activation and reduces the late component of sustained functional hyperemia.
a Cartoon of awake mouse 2-photon imaging experiment with sensory stimulation and perforated window for AP5 superfusion in Aldh1l1-CreERT2 × R26-lck-GCaMP6f mice. b 2-photon image of a penetrating arteriole (PA) (magenta, median filtered image) and surrounding astrocyte expressing membrane targeted lck-GCaMP6f (cyan). One example from 8 experiments from 8 mice. c Left: Average time series trace data of astrocyte endfoot Ca2+ in pre-drug control (black) and in the presence of AP5 (red) surrounding a PA in response to 5 s (n = 18 trials at 7 PA from 7 mice) and 30 s (n = 25 trials at 8 PA from 8 mice) whisker stimulation. Right: summary data of Area Under the Curve (AUC). d Same as for c but for astrocyte arbor Ca2+. 5 s stimulation: n = 18 trials at 7 PA from 7 mice 30 s stimulation: n = 24 trials at 8 PA from 8 mice. e Cartoon of a C57Bl/6 mouse with whisker puffer and perforated cranial window for superfusion of AP5. f Left: Average traces of penetrating arteriole diameter in pre drug control (black) or in the presence of AP5 (red), in response to 5 s or 30 s (n = 8 PA from 7 mice) whisker stimulation. Right: summary data of dilation peak and AUC (average of 3–4 trials per vessel). Peak dilation and AUC. g Cartoon of a Thy1-GCaMP6f mouse with whisker air puffer and perforated cranial window for superfusion of AP5. h Left: Average traces of neuronal Ca2+ in pre drug control (black) or in the presence of AP5 (red), in response to 5 s (control n = 18 trials, AP5 n = 15 trials) or 30 s whisker stimulation (control n = 19 trials, AP5 n = 18 trials) recorded from 6 perivascular ROIs from 6 mice. Right: summary data of maximum neuronal Ca2+ signal in the first 5 s of stimulation and neuropil Ca2+ signal AUC of stimulation period. Max ΔF/F and AUC. Control 5 s and 30 s: n = 6 ROIs, AP5 5 s: n = 5 ROIs; 30 s: n = 6 ROIs. All average trace and summary dot plot data show mean ± SEM. All statistical tests were Two-way ANOVA with Tukey’s multiple comparisons (two-sided). For further statistical details see Supplementary Table 5. Source data are provided as a Source Data file.
Fig. 6
Fig. 6. Epoxyeicosatrienoic acids explain amplification of sustained functional hyperemia.
a Cartoon of a c57Bl/6 mouse with a sealed cranial window and a whisker air puffer receiving the epoxygenase inhibitor MSPPOH i.p. b Average traces of penetrating arteriole (PA) diameter in pre drug control (black) or after MSPPOH treatment (green), in response to 5 s (Left) or 30 s (Right) whisker stimulation. N = 10 PA from 4 mice. c Summary data of dilation peak (average of 3–4 trials per vessel). N = 10 PA from 4 mice. d Summary data of dilation AUC. N = 10 PA from 4 mice. All average trace and summary dot plot data show mean ± SEM. All statistical tests were Two-way ANOVA with Tukey’s multiple comparisons (two-sided). For further statistical details see Supplementary Table 6. Source data are provided as a Source Data file.

References

    1. He Y, et al. Ultra-slow single-vessel BOLD and CBV-based fMRI spatiotemporal dynamics and their correlation with neuronal intracellular calcium signals. Neuron. 2018;97:925–939.e5. doi: 10.1016/j.neuron.2018.01.025. - DOI - PMC - PubMed
    1. Mateo C, Knutsen PM, Tsai PS, Shih AY, Kleinfeld D. Entrainment of arteriole vasomotor fluctuations by neural activity is a basis of blood-oxygenation-level-dependent ‘resting-state’ connectivity. Neuron. 2017;96:936–948.e3. doi: 10.1016/j.neuron.2017.10.012. - DOI - PMC - PubMed
    1. Chow BW, et al. Caveolae in CNS arterioles mediate neurovascular coupling. Nature. 2020;579:106–110. doi: 10.1038/s41586-020-2026-1. - DOI - PMC - PubMed
    1. Grubb S, et al. Precapillary sphincters maintain perfusion in the cerebral cortex. Nat. Commun. 2020;11:395. doi: 10.1038/s41467-020-14330-z. - DOI - PMC - PubMed
    1. Hill RA, et al. Regional blood flow in the normal and ischemic brain is controlled by arteriolar smooth muscle cell contractility and not by capillary pericytes. Neuron. 2015;87:95–110. doi: 10.1016/j.neuron.2015.06.001. - DOI - PMC - PubMed

Publication types