Effects of phytoplankton, viral communities, and warming on free-living and particle-associated marine prokaryotic community structure
- PMID: 36550140
- PMCID: PMC9780322
- DOI: 10.1038/s41467-022-35551-4
Effects of phytoplankton, viral communities, and warming on free-living and particle-associated marine prokaryotic community structure
Abstract
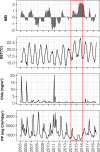
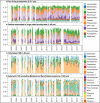
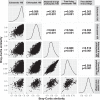
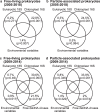
Free-living and particle-associated marine prokaryotes have physiological, genomic, and phylogenetic differences, yet factors influencing their temporal dynamics remain poorly constrained. In this study, we quantify the entire microbial community composition monthly over several years, including viruses, prokaryotes, phytoplankton, and total protists, from the San-Pedro Ocean Time-series using ribosomal RNA sequencing and viral metagenomics. Canonical analyses show that in addition to physicochemical factors, the double-stranded DNA viral community is the strongest factor predicting free-living prokaryotes, explaining 28% of variability, whereas the phytoplankton (via chloroplast 16S rRNA) community is strongest with particle-associated prokaryotes, explaining 31% of variability. Unexpectedly, protist community explains little variability. Our findings suggest that biotic interactions are significant determinants of the temporal dynamics of prokaryotes, and the relative importance of specific interactions varies depending on lifestyles. Also, warming influenced the prokaryotic community, which largely remained oligotrophic summer-like throughout 2014-15, with cyanobacterial populations shifting from cold-water ecotypes to warm-water ecotypes.
© 2022. The Author(s).
Conflict of interest statement
The authors declare no competing interests.
Figures


Similar articles
-
Metagenomic analysis provides functional insights into seasonal change of a non-cyanobacterial prokaryotic community in temperate coastal waters.PLoS One. 2021 Oct 12;16(10):e0257862. doi: 10.1371/journal.pone.0257862. eCollection 2021. PLoS One. 2021. PMID: 34637433 Free PMC article.
-
Pronounced daily succession of phytoplankton, archaea and bacteria following a spring bloom.Nat Microbiol. 2016 Feb 29;1:16005. doi: 10.1038/nmicrobiol.2016.5. Nat Microbiol. 2016. PMID: 27572439
-
Links between phytoplankton and bacterial community dynamics in a coastal marine environment.Microb Ecol. 2005 Jan;49(1):163-75. doi: 10.1007/s00248-003-1057-0. Epub 2005 Jan 28. Microb Ecol. 2005. PMID: 15688258
-
Contrasting diversity patterns of prokaryotes and protists over time and depth at the San-Pedro Ocean Time series.ISME Commun. 2022 Apr 13;2(1):36. doi: 10.1038/s43705-022-00121-8. ISME Commun. 2022. PMID: 37938286 Free PMC article.
-
Phages of the marine cyanobacterial picophytoplankton.FEMS Microbiol Rev. 2003 Apr;27(1):17-34. doi: 10.1016/S0168-6445(03)00016-0. FEMS Microbiol Rev. 2003. PMID: 12697340 Review.
Cited by
-
Two decades of bacterial ecology and evolution in a freshwater lake.Nat Microbiol. 2025 Jan;10(1):246-257. doi: 10.1038/s41564-024-01888-3. Epub 2025 Jan 3. Nat Microbiol. 2025. PMID: 39753668
-
Climate-driven succession in marine microbiome biodiversity and biogeochemical function.Nat Commun. 2025 Apr 25;16(1):3926. doi: 10.1038/s41467-025-59382-1. Nat Commun. 2025. PMID: 40280934 Free PMC article.
-
Characterizing organisms from three domains of life with universal primers from throughout the global ocean.Sci Data. 2025 Jul 1;12(1):1078. doi: 10.1038/s41597-025-05423-9. Sci Data. 2025. PMID: 40593763 Free PMC article.
-
Seasonal and interannual variability of the free-living and particle-associated bacteria of a coastal microbiome.Environ Microbiol Rep. 2024 Aug;16(4):e13299. doi: 10.1111/1758-2229.13299. Environ Microbiol Rep. 2024. PMID: 39081120 Free PMC article.
-
Bidirectional subsethood of shared marker profiles enables accurate virus classification.Microbiome. 2025 Jul 24;13(1):170. doi: 10.1186/s40168-025-02159-x. Microbiome. 2025. PMID: 40708049 Free PMC article.
References
-
- Azam, F. et al. The ecological role of water-column microbes in the sea. Marine Ecol. Prog. Ser.10, 257–263 (1983).
-
- Fuhrman, J. A. & Caron D. A. in Manual of Environmental Microbiology (eds Yates, M. V. et al.) 4.2.2–4.2.2.-34 (ASM Press, 2016).
-
- Gasol, J. M. & Kirchman, D. L. Microbial Ecology of the Oceans (John Wiley & Sons, 2018).
-
- Gilbert JA, et al. The seasonal structure of microbial communities in the Western English Channel. Environ. Microbiol. 2009;11:3132–3139. - PubMed
Publication types
MeSH terms
Substances
LinkOut - more resources
Full Text Sources

