. 2022 Dec 22;12(1):22137.
doi: 10.1038/s41598-022-26693-y.

Transcriptome analysis reveals differential transcription in tomato (Solanum lycopersicum) following inoculation with Ralstonia solanacearum

Affiliations

Transcriptome analysis reveals differential transcription in tomato (Solanum lycopersicum) following inoculation with Ralstonia solanacearum

Na Chen et al. Sci Rep. .

Abstract

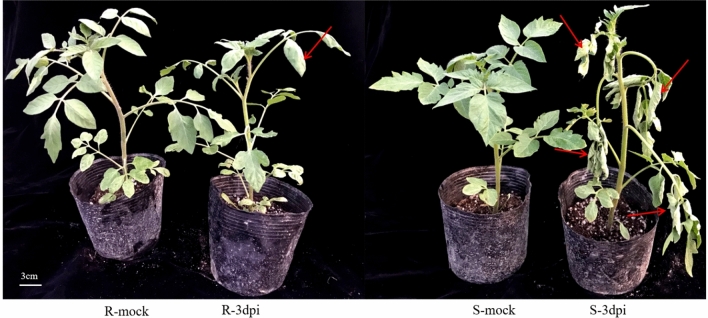
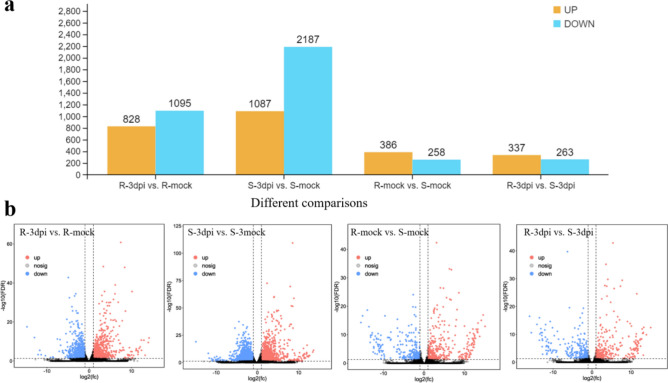
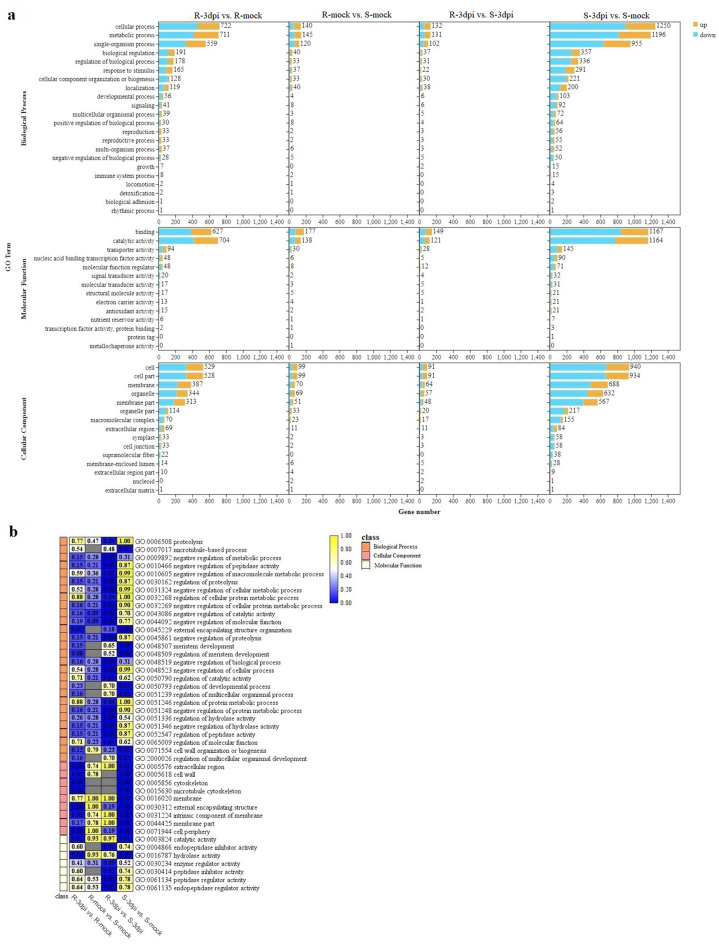
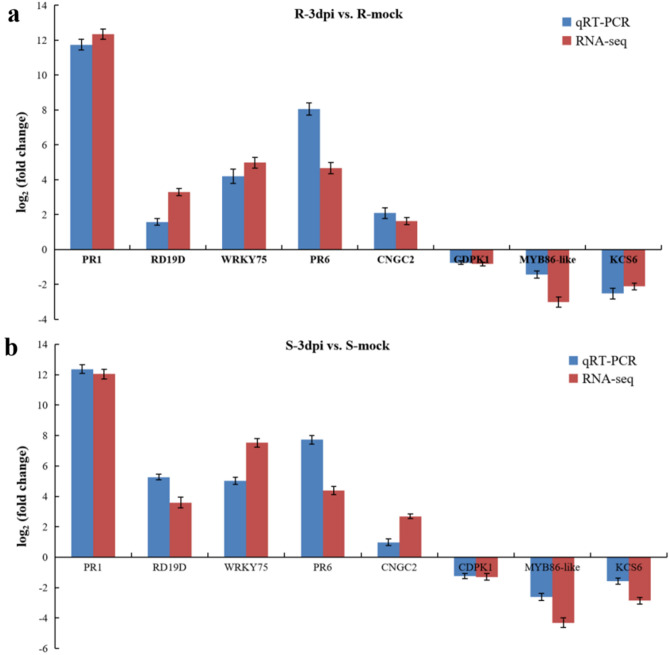
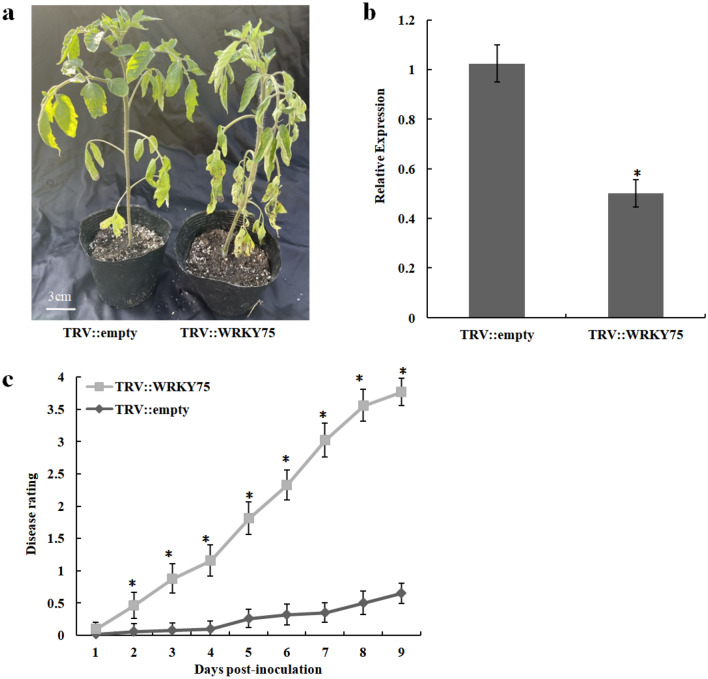
Tomato (Solanum lycopersicum L.) is a major Solanaceae crop worldwide and is vulnerable to bacterial wilt (BW) caused by Ralstonia solanacearum during the production process. BW has become a growing concern that could enormously deplete the tomato yield from 50 to 100% and decrease the quality. Research on the molecular mechanism of tomato regulating BW resistance is still limited. In this study, two tomato inbred lines (Hm 2-2, resistant to BW; and BY 1-2, susceptible to BW) were used to explore the molecular mechanism of tomato in response to R. solanacearum infection by RNA-sequencing (RNA-seq) technology. We identified 1923 differentially expressed genes (DEGs) between Hm 2-2 and BY 1-2 after R. solanacearum inoculation. Among these DEGs, 828 were up-regulated while 1095 were down-regulated in R-3dpi (Hm 2-2 at 3 days post-inoculation with R. solanacearum) vs. R-mock (mock-inoculated Hm 2-2); 1087 and 2187 were up- and down-regulated, respectively, in S-3dpi (BY 1-2 at 3 days post-inoculation with R. solanacearum) vs. S-mock (mock-inoculated BY 1-2). Moreover, Gene Ontology (GO) enrichment analysis revealed that the largest amount of DEGs were annotated with the Biological Process terms, followed by Cellular Component and Molecular Function terms. A total of 114, 124, 85, and 89 regulated (or altered) pathways were identified in R-3dpi vs. R-mock, S-3dpi vs. S-mock, R-mock vs. S-mock, and R-3dpi vs. S-3dpi comparisons, respectively, by Kyoto Encyclopaedia of Genes and Genomes (KEGG) pathway analysis. These clarified the molecular function and resistance pathways of DEGs. Furthermore, quantitative RT-PCR (qRT-PCR) analysis confirmed the expression patterns of eight randomly selected DEGs, which suggested that the RNA-seq results were reliable. Subsequently, in order to further verify the reliability of the transcriptome data and the accuracy of qRT-PCR results, WRKY75, one of the eight DEGs was silenced by virus-induced gene silencing (VIGS) and the defense response of plants to R. solanacearum infection was analyzed. In conclusion, the findings of this study provide profound insight into the potential mechanism of tomato in response to R. solanacearum infection, which lays an important foundation for future studies on BW.


Conflict of interest statement

The authors declare no competing interests.

Figures

Figure 1
Figure 1
Phenotypic symptoms of resistant (Hm 2–2) and susceptible (BY 1–2) tomato seedlings 3 days after Ralstonia solanacearum inoculation. R-mock represents mock-inoculated Hm 2–2 plants; R-3dpi represents 3 days post-pathogen-inoculated Hm 2–2 plants; S-mock represents mock-inoculated BY 1–2 plants; S-3dpi represents 3 days post-pathogen-inoculated BY 1–2 plants. The red arrows represent wilting symptoms of tomato leaves.
Figure 2
Figure 2
Differential expression analysis between treatments. (a) Comparison of the number of up- and down-regulated genes. Yellow and blue points represent up- and down-regulated genes, respectively. (b) Volcano plots between treatments and control. Red and blue points represent up- and down-regulated genes, respectively. Gray points represent no differential expression between genes. R-mock represents mock-inoculated Hm 2–2 plants; R-3dpi represents 3 days post-pathogen-inoculated Hm 2–2 plants; S-mock represents mock-inoculated BY 1–2 plants; S-3dpi represents 3 days post-pathogen-inoculated BY 1–2 plants.
Figure 3
Figure 3
Heat map showing a hierarchical cluster analysis of the top 50 highly expressed genes in four comparisons. The gradient scale represents expression levels with yellow indicating the highest expression and blue indicating the lowest expression. R-mock represents mock-inoculated Hm 2–2 plants; R-3dpi represents 3 days post-pathogen-inoculated Hm 2–2 plants; S-mock represents mock-inoculated BY 1–2 plants; S-3dpi represents 3 days post-pathogen-inoculated BY 1–2 plants.
Figure 4
Figure 4
SNP/InDel annotation in terms of function (a), location (b), and type (c).
Figure 5
Figure 5
GO enrichment analyses of DEGs in four comparisons (R-3dpi vs. R-mock, R-mock vs. S-mock, R-3dpi vs. S-3dpi, and S-3dpi vs. S-mock). (a) Summary of the distribution and number of DEGs in three ontology classes, including biological process, molecular function, and cellular component. (b) Q-value heat map of the GO enrichment of the three main ontology classes. The color scale indicates the Q-value. Darker coloration indicates more significant enrichment. R-mock represents mock-inoculated Hm 2–2 plants; R-3dpi represents 3 days post-pathogen-inoculated Hm 2–2 plants; S-mock represents mock-inoculated BY 1–2 plants; S-3dpi represents 3 days post-pathogen-inoculated BY 1–2 plants.
Figure 6
Figure 6
KEGG enrichment analysis of DEGs. (a) KEGG enrichment analyses in different comparisons. (b) The top ten KEGG pathways containing the largest number of DEGs in R-3dpi vs. R-mock, S-3dpi vs. S-mock, R-mock vs. S-mock, and R-3dpi vs. S-3dpi comparisons. (c) Q-value heat map of KEGG enrichment. R-mock represents mock-inoculated Hm 2–2 plants; R-3dpi represents 3 days post-pathogen-inoculated Hm 2–2 plants; S-mock represents mock-inoculated BY 1–2 plants; S-3dpi represents 3 days post-pathogen-inoculated BY 1–2 plants.
Figure 7
Figure 7
Quantitative real-time PCR validation. (a) In the R-3dpi vs. R-mock comparison. (b) In the S-3dpi vs. S-mock comparison. The red column represents RNA-seq data, and the blue column represents qRT-PCR data. The experiments were performed in triplicate. R-mock represents mock-inoculated Hm 2–2 plants; R-3dpi represents 3 days post-pathogen-inoculated Hm 2–2 plants; S-mock represents mock-inoculated BY 1–2 plants; S-3dpi represents 3 days post-pathogen-inoculated BY 1–2 plants.
Figure 8
Figure 8
Resistance identification of tomato bacterial wilt after silencing WRKY75 gene. (a) Phenotypic symtoms after inoculation with Ralstonia solanacearum of wild-type Hm 2–2 (TRV::empty) and silencing WRKY75 (TRV::WRKY75) tomato plants; (b) qRT-PCR of WRKY75 gene; (c) Disease scoring after infection with R. solanacearum in wild-type Hm 2–2 (dark gray) and silencing WRKY75 (light gray) tomato plants. Results are averages ± s.e.m. (n = 20). *P < 0.05 using Student’s t-test. We repeated all experiments at least three times with similar results.
Figure 9
Figure 9
The map of pTRV1 and pTRV2 vectors.

Similar articles

Cited by

References

    1. Lee CG, et al. Comparison of prokaryotic and eukaryotic communities in soil samples with and without tomato bacterial wilt collected from different fields. Microbes Eniviron. 2017;32:376–385. doi: 10.1264/jsme2.ME17131. - DOI - PMC - PubMed
    1. Singh VK, Singh AK, Kumar A. Disease management of tomato through PGPB: Current trends and future perspective. 3 Biotech. 2017;7(4):255. doi: 10.1007/s13205-017-0896-1. - DOI - PMC - PubMed
    1. Li Y, Niu WQ, Dyck M, Wang JW, Zou XY. Yields and nutritional of greenhouse tomato in response to different soilaeration volume at two depths of subsurface drip irrigation. Sci. Rep. 2016;6:39307. doi: 10.1038/srep39307. - DOI - PMC - PubMed
    1. Zheng X, Zhu Y, Wang J, Wang Z, Liu B. Combined use of a microbial restoration substrate and a virulent Ralstonia solanacearum for the control of tomato bacterial wilt. Sci. Rep. 2019;9(1):20091. doi: 10.1038/s41598-019-56572-y. - DOI - PMC - PubMed
    1. Kim SG, et al. Evaluation of resistance to Ralstonia solanacearum in tomato genetic resources at seedling stage. Plant Pathol. J. 2016;32(1):58–64. doi: 10.5423/PPJ.NT06.2015.0121. - DOI - PMC - PubMed

Publication types

MeSH terms