. 2022 Dec 22;13(1):7886.
doi: 10.1038/s41467-022-35639-x.

Actin-microtubule cytoskeletal interplay mediated by MRTF-A/SRF signaling promotes dilated cardiomyopathy caused by LMNA mutations

Affiliations

Actin-microtubule cytoskeletal interplay mediated by MRTF-A/SRF signaling promotes dilated cardiomyopathy caused by LMNA mutations

Caroline Le Dour et al. Nat Commun. .

Abstract

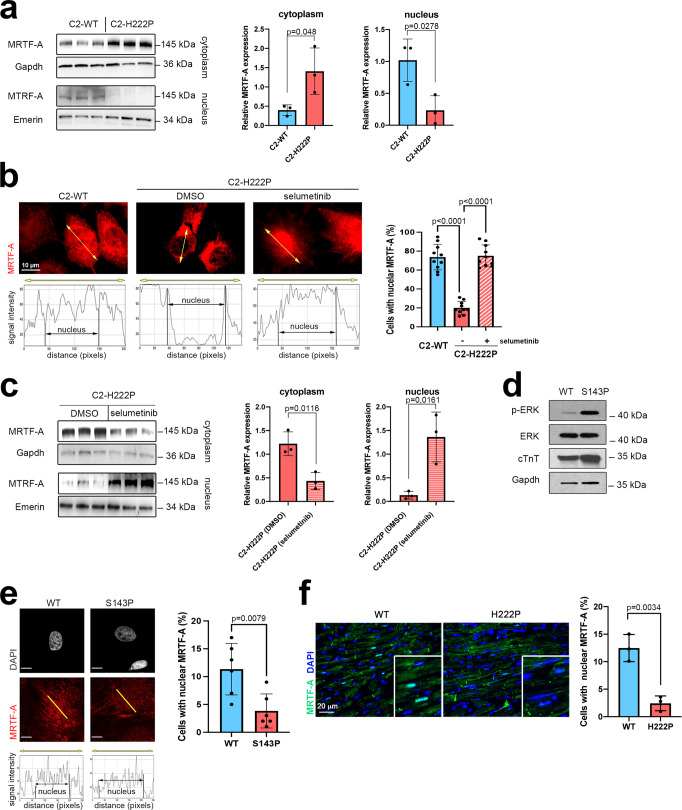
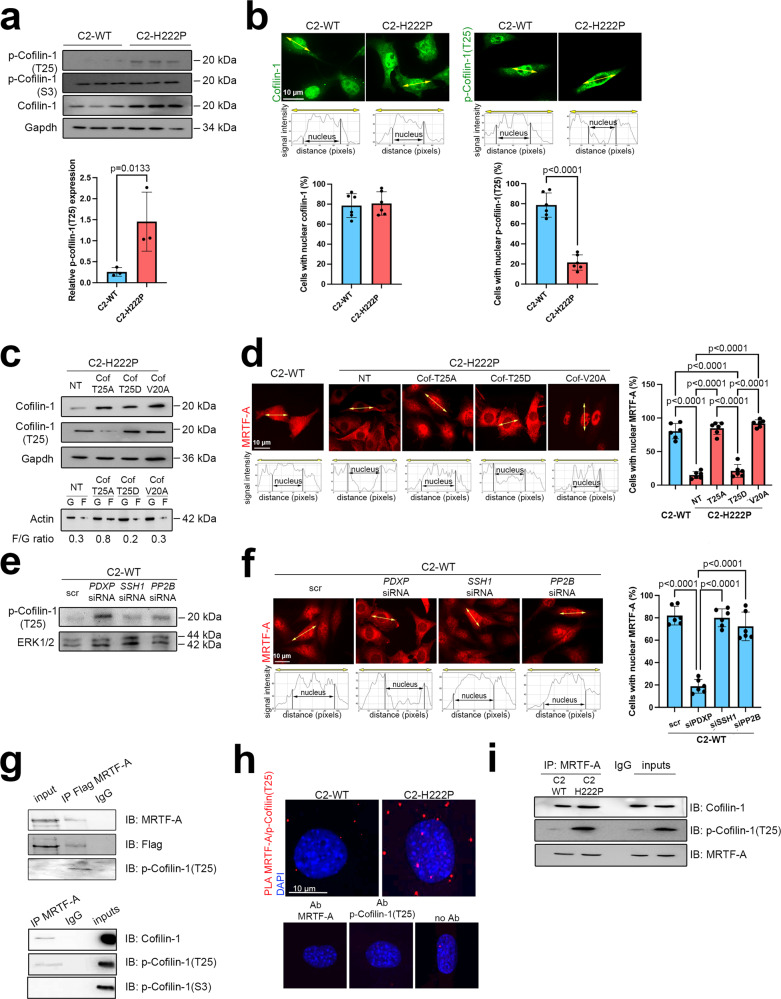
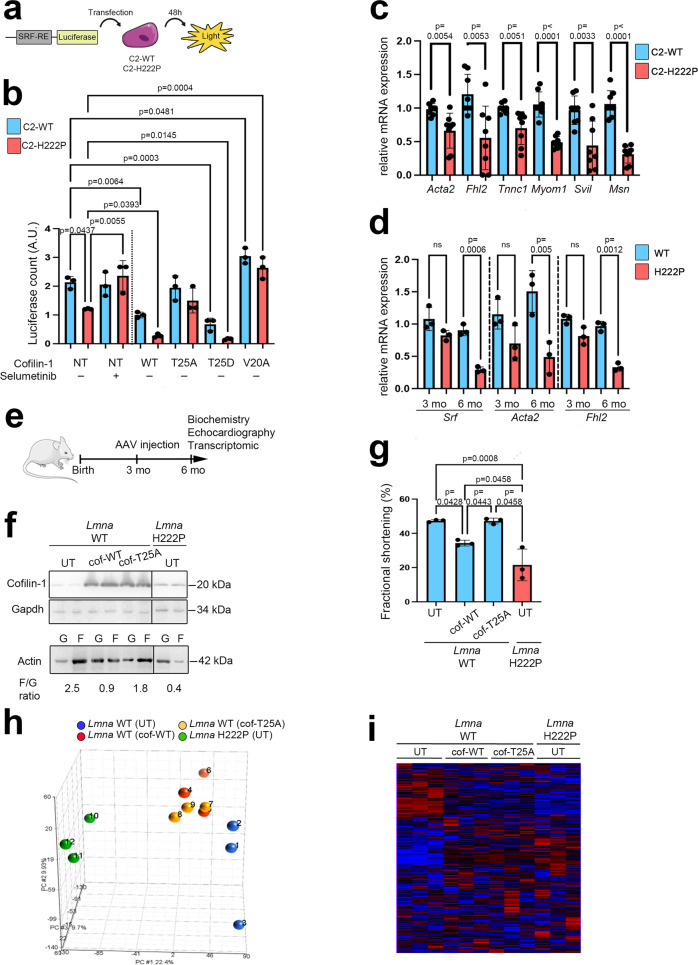
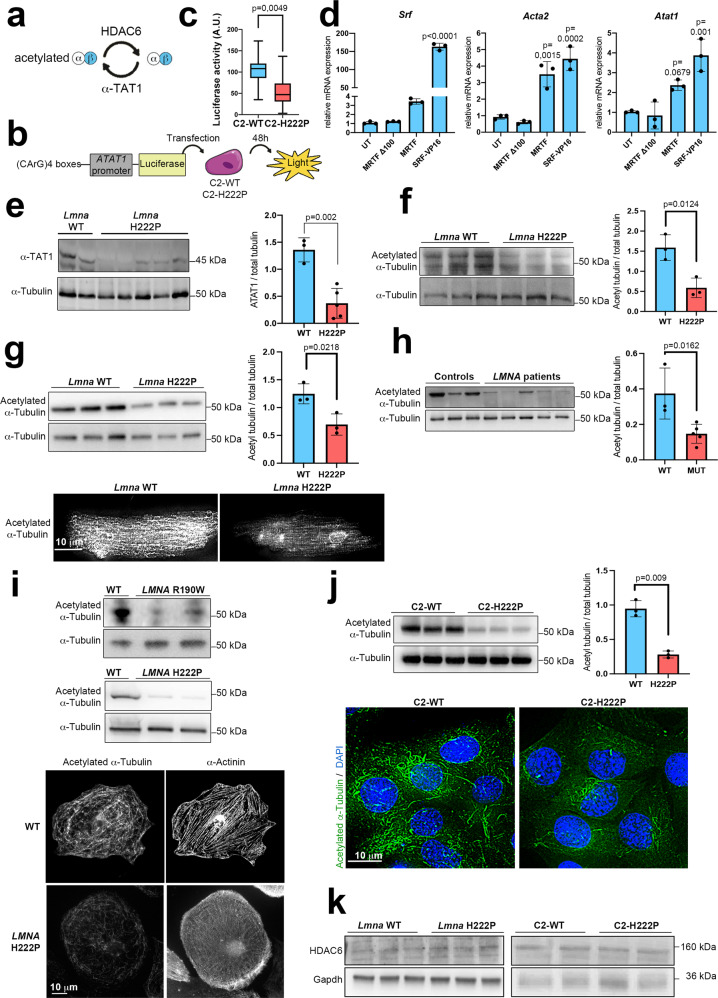
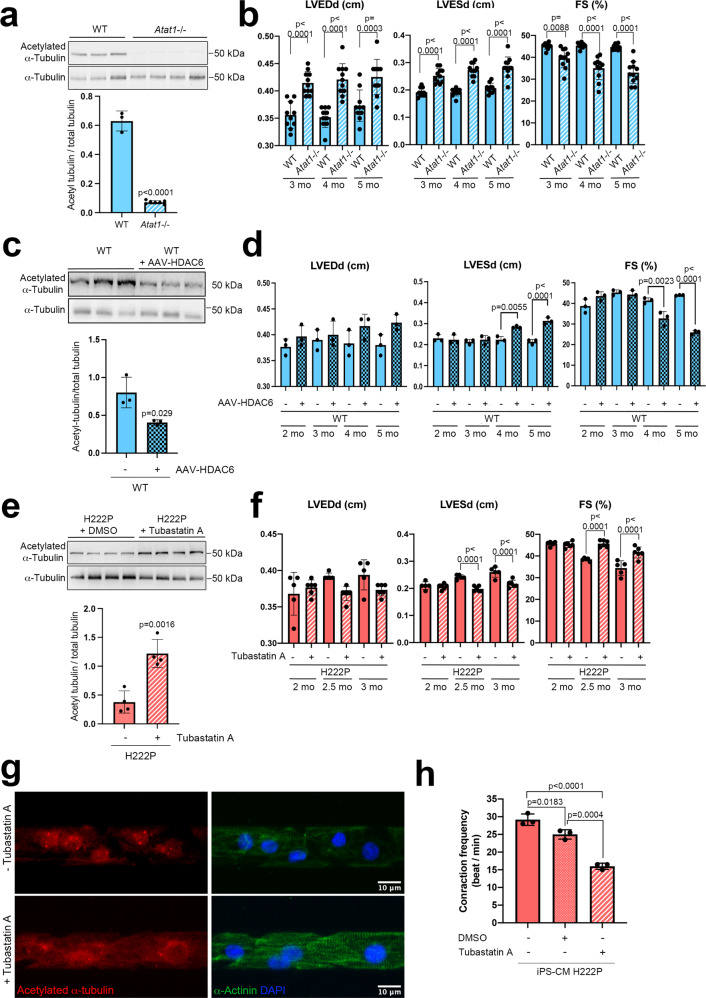
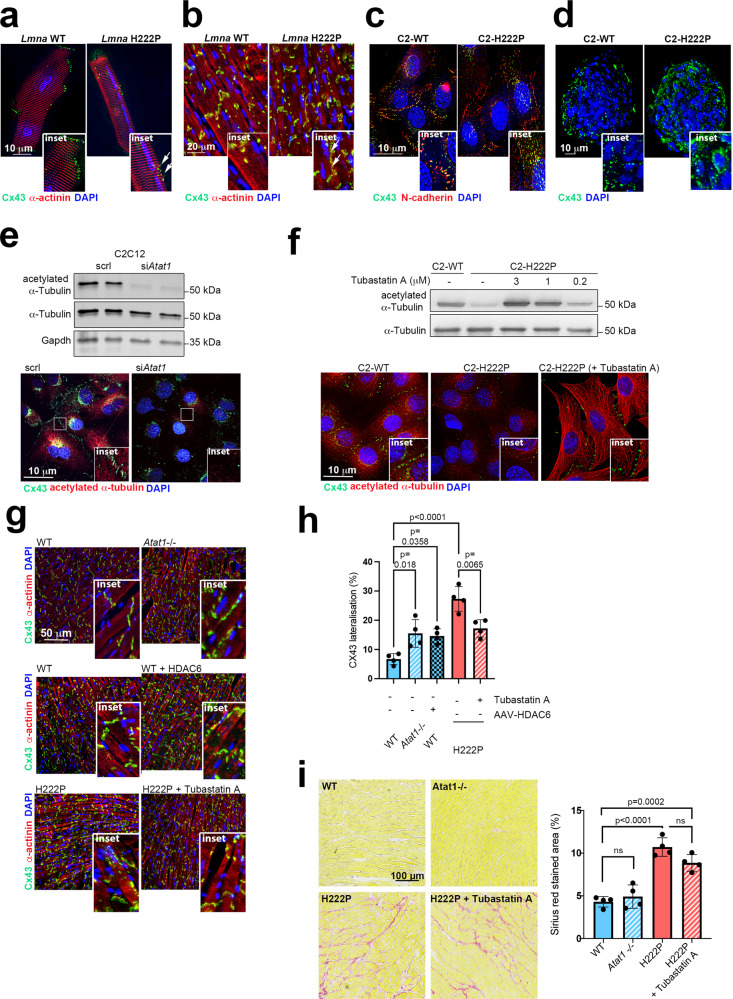
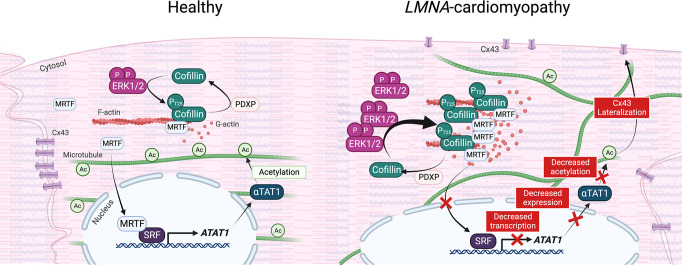
Mutations in the lamin A/C gene (LMNA) cause dilated cardiomyopathy associated with increased activity of ERK1/2 in the heart. We recently showed that ERK1/2 phosphorylates cofilin-1 on threonine 25 (phospho(T25)-cofilin-1) that in turn disassembles the actin cytoskeleton. Here, we show that in muscle cells carrying a cardiomyopathy-causing LMNA mutation, phospho(T25)-cofilin-1 binds to myocardin-related transcription factor A (MRTF-A) in the cytoplasm, thus preventing the stimulation of serum response factor (SRF) in the nucleus. Inhibiting the MRTF-A/SRF axis leads to decreased α-tubulin acetylation by reducing the expression of ATAT1 gene encoding α-tubulin acetyltransferase 1. Hence, tubulin acetylation is decreased in cardiomyocytes derived from male patients with LMNA mutations and in heart and isolated cardiomyocytes from Lmnap.H222P/H222P male mice. In Atat1 knockout mice, deficient for acetylated α-tubulin, we observe left ventricular dilation and mislocalization of Connexin 43 (Cx43) in heart. Increasing α-tubulin acetylation levels in Lmnap.H222P/H222P mice with tubastatin A treatment restores the proper localization of Cx43 and improves cardiac function. In summary, we show for the first time an actin-microtubule cytoskeletal interplay mediated by cofilin-1 and MRTF-A/SRF, promoting the dilated cardiomyopathy caused by LMNA mutations. Our findings suggest that modulating α-tubulin acetylation levels is a feasible strategy for improving cardiac function.


Conflict of interest statement

The authors declare no competing interests.

Figures

Fig. 1
Fig. 1. Abnormal MRTF-A localization in cells expressing mutated A-type lamins.
a Immunoblots showing the MRTF-A expression in nuclear and cytoplasmic extracts from C2-WT and C2-H222P cells (n = 3 independent experiments). Emerin and GAPDH were used as loading controls for the nuclear and cytoplasmic fractions, respectively. Bar graph shows the quantification of MRTF-A (n = 3 independent experiments, mean ± SD). b Representative immunofluorescence micrographs of MRTF-A staining in C2-WT and C2-H222P cells treated or not with selumetinib to inhibit the phosphorylation of ERK1/2. Scan line graphs represent the intensity of MRTF-A staining along the yellow arrow lines. Bar graph shows the quantification of nuclear MRTF-A (n = 250, mean ± SD). Statistics: one-way ANOVA followed by Tukey’s multiple comparison test. c Immunoblots showing the MRTF-A expression in nuclear and cytoplasmic extracts of C2-H222P cells treated or not with selumetinib (n = 3 independent experiments). Emerin and GAPDH were used as loading controls for the nuclear and cytoplasmic fractions, respectively. Bar graph shows the quantification of MRTF-A (n = 3 independent experiments, mean ± SD). d Immunoblots showing the p-ERK1/2, ERK1/2, cTnT, and GAPDH expression in protein extracts from cardiomyocytes derived from patient-specific human iPSCs carrying a LMNA mutation (p.S143P) and control (WT). e Representative micrographs showing the MRTF-A labeling of cardiomyocytes derived from control (WT) and patient-specific human iPSCs carrying the LMNA p.S143P mutation (S143P). Scan line graphs represent the intensity of MRTF-A staining along the yellow arrow lines. Scale bar 10 μm. The bar graph shows the quantification of nuclear MRTF-A (n = 350 cells, mean ± SD). f Fluorescence micrographs showing the MRTF-A labeling of heart cross-sections from 3-month-old male wild-type (WT) and Lmnap.H222P/H222P (H222P) mice. Nuclei counterstained with DAPI are also shown. Bar graph shows the quantification of cardiomyocytes with nuclear MRTF-A staining from heart sections of three different mice (n = 150 cells, mean ± SD). Statistics: for a, c, e, and f, unpaired two-tailed t-test. Source data are provided as a Source Data file.
Fig. 2
Fig. 2. Cofilin-1 phosphorylated on threonine 25 binds to MRTF-A and prevents its nuclear localization.
a Immunoblots showing total, phospho(S3) and phospho(T25)-cofilin-1 expression in C2-WT and C2-H222P cells. GAPDH was used as a loading control. Bar graph shows the quantification of phospho(T25)-cofilin-1 (n = 3 independent experiments, mean ± SD). b Representative immunofluorescence staining of cofilin-1 and phospho(T25)-cofilin-1 in C2-WT and C2-H222P cells. Scan line graphs represent the intensity of staining along the yellow arrows. Bar graph shows quantification of nuclear cofilin-1 (n = 487 cells, mean ± SD) and phospho(T25)-cofilin-1 staining (n = 472 cells, mean ± SD). c Immunoblots showing cofilin-1 and monomeric G-actin (G) vs. filamentous F-actin (F) expression in C2-H222P cells transfected with plasmids expressing nonphosphorylatable (T25A), phosphomimetic (T25D), and NES-mutated (V20A) forms of cofilin-1. GAPDH was used as a loading control. F/G ratios were calculated from n = 3. d Representative immunofluorescence staining and scan lines of MRTF-A in C2-WT and C2-H222P cells transfected with same plasmids as in (c). Bar graph shows the quantification of nuclear MRTF-A (n > 200 cells over 6 independent experiments, mean ± SD). e Immunoblots showing phospho(T25)-cofilin-1 expression in C2-WT cells transfected with siRNAs silencing PDXP, SSH1 or PP2B phosphatases. ERK1/2 was used as a loading control. f Representative immunofluorescence staining and scan lines of MRTF-A in C2-WT cells transfected with the same siRNAs as in (e). Bar graph shows the quantification of nuclear MRTF-A (n > 200 cells over six independent experiments, mean ± SD). g Immunoblots showing the interaction of phospho(T25)-cofilin-1 and MRTF-A. Top: proteins from C2C12 were immunoprecipitated with Flag antibody and immunoblotted with MRTF-A or phospho(T25)-cofilin-1 antibodies. Bottom: proteins from C2C12 were immunoprecipitated with MRTF-A antibody and immunnoblotted with cofilin-1, phospho(T25)-cofilin-1, or phospho(S3)-cofilin-1 antibodies. IgG was used as a negative control. h Representative micrographs from proximity ligation assay (PLA) between MRTF-A and phospho(T25)-cofilin-1 in C2-WT and C2-H222P cells. Nuclei were counterstained with DAPI. No positive PLA reactions (red dots) were observed for MRTF-A or phospho(T25)-cofilin-1 alone or for negative control without primary antibodies (no Ab). i Immunoblots showing the interaction of phospho(T25)-cofilin-1 and MRTF-A. Proteins from C2-WT (n = 3) and C2-H222P (n = 3) cells were immunoprecipitated with MRTF-A and immunoblotted with cofilin-1 or phospho(T25)-cofilin-1 antibodies. IgG was used as a negative control. For gi representative of three independent repeats is shown. Statistics: for a and b, unpaired two-tailed t-test; for d and f, one-way ANOVA followed by Tukey’s multiple comparison test. Source data are provided as a Source Data file.
Fig. 3
Fig. 3. Phospho(T25)-cofilin-1 impedes SRF regulation and alters cardiac function in mice.
a Schematic representation of the luciferase assay for assessing SRF activity. b Bar graph showing quantification of luciferase activity in C2-WT and C2-H222P cells overexpressing SRF response element and transfected or not (NT) with plasmids expressing different mutated cofilin-1 proteins. Results after treatment with selumetinib are also shown (n = 3 independent experiments, mean ± SD). c mRNA expression of SRF target-genes: Acta2, Fhl2, Tnnc, Myom1, Svil, and Msn in C2-H222P and C2-WT cells (n = 6 independent experiments, mean ± SD). d mRNA expression of Srf, Acta2 and Fhl2 in hearts of 3 and 6-month-old male Lmnap.H222P/H222P (H222P) and WT mice (n = 3 mice per condition, mean ± SD). e Schematic representation of methodological protocol. WT mice were injected with AAV vectors encoding either WT or nonphosphorylable cofilin-1(T25A) at 3 months of age. Biochemistry, echocardiography, and transcriptomic analysis were performed at 6 months of age. Subsequent data showed in fi, are obtained from the hearts of 6-month-old male Lmna WT mice transduced with AAV vectors encoding cofilin-1 or cofilin-1(T25A) and Lmna H222P mice (n = 3 mice per condition, mean ± SD). f Immunoblots showing cofilin-1 (top) and monomeric G-actin (G) and filamentous F-actin (F) (bottom) expression. GAPDH was used as the loading control. Lmna H222P mice are shown as controls, and UT indicates untransduced. g Bar graph showing the left ventricular fraction shortening (FS) values. h Principal component analysis (PCA) of the Affymetrix probe sets. i Unsupervised hierarchical clustering of the Affymetrix probe set results. Statistics: for b and g, one-way ANOVA followed by Tukey’s multiple comparison test; for c and d, unpaired two-tailed t-test. Source data are provided as a Source Data file. For a and e, parts of the figure were drawn by using pictures from Servier Medical Art. Servier Medical Art by Servier is licensed under a Creative Commons Attribution 3.0 Unported License (https://creativecommons.org/licenses/by/3.0/).
Fig. 4
Fig. 4. α-Tubulin acetylation is decreased through SRF-mediated expression of ATAT1 in cells, and cardiac tissue expressing cardiomyopathy-causing mutant A-type lamins.
a Schematic view of the enzymes responsible for acetylation and deacetylation of α-tubulin. b Experimental protocol for measuring SRF transcriptional activity based on ATAT1 expression by luciferase assay. c Box plot showing the quantification of luciferase activity after C2-WT and C2-H222P cells were transfected with the construction described in (b) (n = 3 independent experiments; whiskers min to max, line in the middle of the box is plotted at the median). d Bar graph showing mRNA relative expression of Srf, Acta2, and Atat1 in C2C12 transfected with plasmids expressing inactive MRTF-A (MRTFΔ100), WT MRTF-A (MRTF), or constitutively active SRF (SRF-VP16) (n = 3 independent experiments, mean ± SD). e Left: immunoblot showing α-TAT1 and α-tubulin expression in hearts of 6-month-old male WT and Lmnap.H222P/H222P (H222P) mice. Right: bar graph showing the quantification of α-TAT1 (n = 3 WT and n = 5 H222P, mean ± SD). fj Top left: immunoblot showing expression of acetylated and total α-tubulin, top right: bar graph showing the quantification of acetylated α-tubulin normalized to total α-tubulin (f) in the hearts of 3-month-old male WT and Lmnap.H222P/H222P (H222P) mice (n = 3 mice per condition, mean ± SD). g in adult cardiomyocytes isolated from 3-month-old male WT and Lmnap.H222P/H222P (H222P) mice (n = 3 mice per condition, mean ± SD). Bottom: representative immunofluorescence staining of acetylated α-tubulin (h) in explanted heart tissue from control individuals (n = 3) and patients carrying LMNA point mutations (n = 5) (mean ± SD). i in cardiomyocytes derived from iPS cells from a control (WT), a patient carrying LMNA p.R190W mutation (upper panel) and a patient carrying LMNA p.H222P mutation (lower panel). Bottom: representative immunofluorescence staining of acetylated α-tubulin in cardiomyocytes derived from iPS WT and H222P. α-Actinin is shown as cardiomyocyte differentiation marker. j In C2-WT and C2-H222P cells (n = 3 independent experiments, mean ± SD). Bottom: representative immunofluorescence staining of acetylated α-tubulin. k Immunoblot showing expression of HDAC6 in hearts of 6-month-old male WT mice and Lmnap.H222P/H222P (H222P) mice (n = 3 mice per condition) as well as in C2-WT and C2-H222P cells (a representative of three independent repeats is shown). Statistics: for c, eh, and j, unpaired two-tailed t-test; for d, one-way ANOVA followed by Tukey’s multiple comparison test. Source data are provided as a Source Data file. For b, parts of the figure were drawn by using pictures from Servier Medical Art. Servier Medical Art by Servier is licensed under a Creative Commons Attribution 3.0 Unported License (https://creativecommons.org/licenses/by/3.0/).
Fig. 5
Fig. 5. α-Tubulin acetylation mediates cardiac function in Atat1 knock-out mice and in mice expressing cardiomyopathy-causing mutant A-type lamins.
a, c, e Top: Immunoblots showing the cardiac protein expression of acetylated and total α-tubulin a in 6-month-old male Atat1+/+ (WT) mice (n = 3) and Atat1 knockout mice (Atat1−/−) (n = 5) c in 5-month-old male WT mice (n = 3) and WT mice transduced with AAV expressing HDAC6 (n = 3), and c in 3-month-old male Lmnap.H222P/H222P (H222P) mice treated with tubastatin A for one month (n = 4) compared with mice treated with DMSO (n = 4). a, c, e Bottom: bar graph showing the quantification of acetylated α-tubulin normalized to total α-tubulin (mean ± SD). b, d, f Bar graphs showing the left ventricular end-diastolic diameters (LVEDd), end-systolic diameters (LVESd) and fraction shortening (FS) (mean ± SEM) b in Atat1+/+ (WT) mice (n = 10) and Atat1 knockout mice (Atat1−/−) (n = 11) from 3 to 6 months of age, d in 5-month-old male WT mice (n = 3) and WT mice transduced with AAV expressing HDAC6 (n = 3) and f in 3-month-old male Lmnap.H222P/H222P (H222P) mice treated for one month with tubastatin A (n = 6) compared to mice treated with DMSO (n = 5). g Immunofluorescence staining of acetylated α-tubulin and α-actinin in cardiomyocytes derived from iPS cells from a patient carrying the LMNA p.H222P mutation, 40 days post-differentiation, treated (lower panel) or not (upper panel) with 3 µM of tubastatin A for 24 h. α-Actinin is shown as cardiomyocyte differentiation marker. h Contraction frequency of cardiomyocytes derived from iPS cells from a patient carrying the LMNA p.H222P mutation, 40 days post-differentiation, treated or not with 3 µM of tubastatin A for 24 h (n = 3 technical replicates) (mean ± SD). Statistics: for a, c, e unpaired two-tailed t-test; for b, d, f, h one-way ANOVA followed by Tukey’s multiple comparison test. Source data are provided as a Source Data file.
Fig. 6
Fig. 6. α-Tubulin acetylation mediates Cx43 localization in cellular and mouse models expressing cardiomyopathy-causing mutant A-type lamins.
a, b Immunofluorescence staining of Cx43 and α-actinin in a isolated adult cardiomyocytes and b heart cross-sections from 3-month-old male WT mice and Lmnap.H222P/H222P (H222P) mice. The arrows indicate the lateralization of Cx43. c Immunofluorescence staining of Cx43 and N-cadherin in C2-WT and C2-H222P cells. d Immunofluorescence staining of Cx43 in C2-WT and C2-H222P cells organized in 3D spheroids. e, f Top: immunoblot showing expression of acetylated and total α-tubulin in e C2C12 cells treated or not with siRNA targeting Atat1 and f in C2-H222P cells treated or not with different doses of tubastatin A. GAPDH was used as a loading control. e, f Bottom: representative immunofluorescence staining of Cx43 and acetylated α-tubulin in e C2-H222P cells treated or not with a siRNA targeting Atat1 and f in C2-H222P cells treated or not with tubastatin A. The insets show a higher magnification. g Immunofluorescence staining of Cx43 and α-actinin of heart cross-sections from 6-month-old male Atat1+/+ (WT) mice and Atat1 knockout mice (Atat1−/−) (top panel); from 5-month-old male WT mice transduced or not with AAV expressing HDAC6 (middle panel) and from 3-month-old male Lmnap.H222P/H222P (H222P) mice treated with tubastatin A compared with mice treated with DMSO (bottom panel). h Bar graph showing the quantification of lateralized Cx43 staining (n = 4 mice per condition; mean ± SD). i Left: representative Sirius red staining of heart cross-sections from 6-month-old male Atat1+/+ (WT) mice, Atat1 knockout mice (Atat1−/−), and 3-month-old male Lmnap.H222P/H222P (H222P) mice treated or not with tubastatin A. Right: bar graph showing the quantification of Sirius red-stained area (n = 4 mice per condition; mean ± SD). For ag, nuclei counterstained with DAPI are shown and a representative of three independent repeats is shown. Statistics: for h and i, one-way ANOVA followed by Tukey’s multiple comparison test. Source data are provided as a Source Data file.
Fig. 7
Fig. 7. Schematic representation of the actin-microtubule interplay mediated by phospho(T25)-cofilin-1 via MRTF-A/SRF signaling and α-tubulin acetylation in LMNA-cardiomyopathy.
Created with BioRender.com.

References

    1. Fatkin D, et al. Missense mutations in the rod domain of the lamin A/C gene as causes of dilated cardiomyopathy and conduction-system disease. N. Engl. J. Med. 1999;341:1715–1724. doi: 10.1056/NEJM199912023412302. - DOI - PubMed
    1. Taylor MRG, et al. Natural history of dilated cardiomyopathy due to lamin A/C gene mutations. J. Am. Coll. Cardiol. 2003;41:771–780. doi: 10.1016/S0735-1097(02)02954-6. - DOI - PubMed
    1. Muchir A, Shan J, Bonne G, Lehnart SE, Worman HJ. Inhibition of extracellular signal-regulated kinase signaling to prevent cardiomyopathy caused by mutation in the gene encoding A-type lamins. Hum. Mol. Genet. 2009;18:241–247. doi: 10.1093/hmg/ddn343. - DOI - PMC - PubMed
    1. Wu W, Muchir A, Shan J, Bonne G, Worman HJ. Mitogen-activated protein kinase inhibitors improve heart function and prevent fibrosis in cardiomyopathy caused by mutation in lamin A/C gene. Circulation. 2011;123:53–61. doi: 10.1161/CIRCULATIONAHA.110.970673. - DOI - PMC - PubMed
    1. Wu W, Iwata S, Homma S, Worman HJ, Muchir A. Depletion of extracellular signal-regulated kinase 1 in mice with cardiomyopathy caused by lamin A/C gene mutation partially prevents pathology before isoenzyme activation. Hum. Mol. Genet. 2014;23:1–11. doi: 10.1093/hmg/ddt387. - DOI - PMC - PubMed

Publication types