. 2022 Dec 22;13(1):7885.
doi: 10.1038/s41467-022-35545-2.

Clay hydroxyl isotopes show an enhanced hydrologic cycle during the Paleocene-Eocene Thermal Maximum

Affiliations

Clay hydroxyl isotopes show an enhanced hydrologic cycle during the Paleocene-Eocene Thermal Maximum

Gregory L Walters et al. Nat Commun. .

Abstract

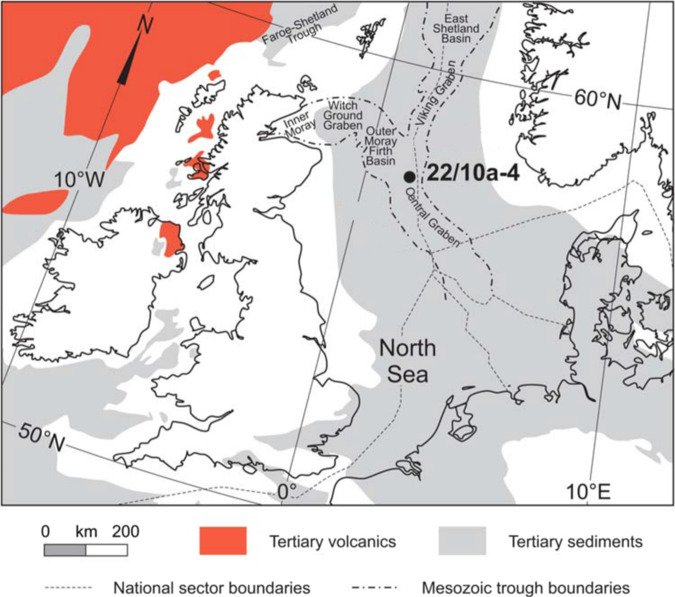
The Paleocene-Eocene Thermal Maximum (PETM) was an abrupt global warming event associated with a large injection of carbon into the ocean-atmosphere system, as evidenced by a diagnostic carbon isotope excursion (CIE). Evidence also suggests substantial hydrologic perturbations, but details have been hampered by a lack of appropriate proxies. To address this shortcoming, here we isolate and measure the isotopic composition of hydroxyl groups (OH-) in clay minerals from a highly expanded PETM section in the North Sea Basin, together with their bulk oxygen isotope composition. At this location, we show that hydroxyl O- and H-isotopes are less influenced than bulk values by clay compositional changes due to mixing and/or inherited signals and thus better track hydrologic variability. We find that clay OH- hydrogen-isotope values (δ2HOH) decrease slowly prior to the PETM and then abruptly by ∼8‰ at the CIE onset. Coincident with an increase in relative kaolinite content, this indicates increased rainfall and weathering and implies an enhanced hydrologic cycle response to global warming, particularly during the early stages of the PETM. Subsequently, δ2HOH returns to pre-PETM values well before the end of the CIE, suggesting hydrologic changes in the North Sea were short-lived relative to carbon-cycle perturbations.


Conflict of interest statement

The authors declare no competing interests.

Figures

Fig. 1
Fig. 1. Map of the North Sea Basin, showing the location of well 22/10a-4 and the surrounding geologic features and Paleogene deposits.
Figure 1 is reproduced from ref . © The Mineralogical Society of Great Britain and Ireland 2016, published by Cambridge University Press, reproduced with permission.
Fig. 2
Fig. 2. Comparison of the major trends across the onset of the Paleocene Eocene Thermal Maximum (PETM) versus depth in the core from well 22/10a-4.
The onset of the Carbon Isotope Excursion (CIE) is shown by the light grey bar. a δ13C VPDB (Vienna Pee Dee Belemnite) of total organic carbon (TOC); b clay hydroxyl δ2HOH VSMOW (Vienna Standard Mean Ocean Water); c percentage of the dinoflagellate Apectodinium spp. (several species); d percentage of low-salinity dinoflagellate cysts excluding Apectodinium; e clay hydroxyl δ18OOH; and f the bulk clay δ18Obulk. Error bars for b, e and f are ±1 σ analytical uncertainty (Methods).
Fig. 3
Fig. 3. Comparison of the relative percentage of the component clays (note that panels use different scales) and reconstructed clay mineral formation source water versus depth in the core from well 22/10a-4.
The onset of the Carbon Isotope Excursion (CIE) is shown by the light grey bar. a kaolinite; b illite-smectite; c illite and d chlorite in the <4 μm size fraction from well 22/10a-4 and e the reconstructed clay mineral (neo)formation source water δ2H (δ2HOH-SW). Also shown in e are end-members assuming 100 % kaolinite (dotted grey line) or 100% illite-smectite (dashed grey line). Reconstructions are calculated using empirical fractionation factors from refs. and , respectively (Methods). These end-member values are expected to encompass the range of possible δ2HOH-SW values for a given time point.
Fig. 4
Fig. 4. The dehydration profiles of the Paleocene-Eocene Thermal Maximum (PETM) clay assemblage (at 2613.48 m) compared to pure standard samples of clays similar to those found in the assemblage.
These dehydration profiles were obtained by using a heating rate of 5 °C per minute between 30 and 1030 °C. No chlorite dehydroxylation peak is seen in our PETM samples, suggesting that the chlorite is sedimentary and undergoes dehydroxylation at lower temperatures. The pure kaolinite sample was provided by IMERYS from Blackpool Pit, St. Austell pluton, Cornwall, UK25. The rectorite standard was purchased from the Clay Minerals Society, originating from Garland County, Arkansas, USA. The chlorite sample is a metamorphic chlorite of unknown origin.
Fig. 5
Fig. 5. Comparison of the final measured dehydration profiles of three Paleocene-Eocene Thermal Maximum (PETM) samples.
The dehydration profiles shown are from depths a 2616.34 m, b 2613.48 m and c 2611.59 m. The first and second peaks, which are measured between 30–250 and 250–390 °C, respectively, likely reflect exchangeable interlayer water. At 250 °C and 390 °C, 10 min isothermal steps were used to increase peak separation. The second peak varies in size across the samples, being between 12 and 51% of the size of the third peak, and thus is too small for accurate isotopic measurements. Including the second peak as part of the hydroxyl peak in isotope analysis leads to only small changes in reported values, and does not change the overall trends in δ18OOH and δ2HOH.

References

    1. Thomas DJ, Zachos JC, Bralower TJ, Thomas E, Bohaty S. Warming the fuel for the fire: Evidence for the thermal dissociation of methane hydrate during the Paleocene-Eocene thermal maximum. Geology. 2002;30:1067. doi: 10.1130/0091-7613(2002)030<1067:WTFFTF>2.0.CO;2. - DOI
    1. Westerhold T, et al. Astronomical calibration of the Ypresian timescale: implications for seafloor spreading rates and the chaotic behavior of the solar system. Clim. Past. 2017;13:1129–1152. doi: 10.5194/cp-13-1129-2017. - DOI
    1. McInerney FA, Wing SL. The Paleocene-Eocene Thermal Maximum: a perturbation of carbon cycle, climate, and biosphere with implications for the future. Annu. Rev. Earth Planet Sci. 2011;39:489–516. doi: 10.1146/annurev-earth-040610-133431. - DOI
    1. Frieling J, et al. Extreme warmth and heat-stressed plankton in the tropics during the Paleocene-Eocene Thermal Maximum. Sci. Adv. 2017;3:e1600891. doi: 10.1126/sciadv.1600891. - DOI - PMC - PubMed
    1. Schmidt DN, Thomas E, Authier E, Saunders D, Ridgewell A. Strategies in times of crisis—insights into the benthic foraminiferal record of the Palaeocene–Eocene Thermal Maximum. Philos. Trans. R. Soc. A. 2018;376:20170328. doi: 10.1098/rsta.2017.0328. - DOI - PMC - PubMed