. 2022 Dec 22;12(1):22132.
doi: 10.1038/s41598-022-26683-0.

A proof-of-concept study to investigate the efficacy of heat-inactivated autovaccines in Mycobacterium caprae experimentally challenged goats

Affiliations

A proof-of-concept study to investigate the efficacy of heat-inactivated autovaccines in Mycobacterium caprae experimentally challenged goats

Cristian Melgarejo et al. Sci Rep. .

Abstract

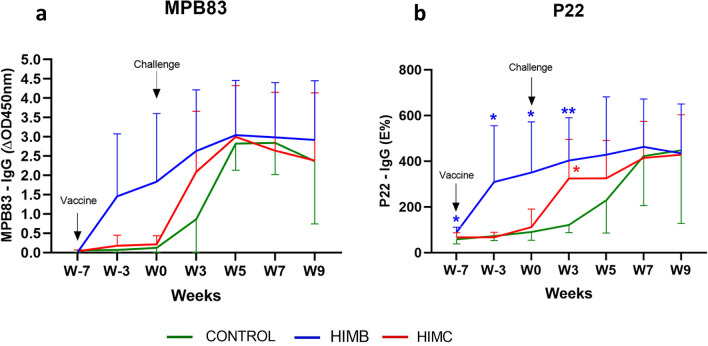
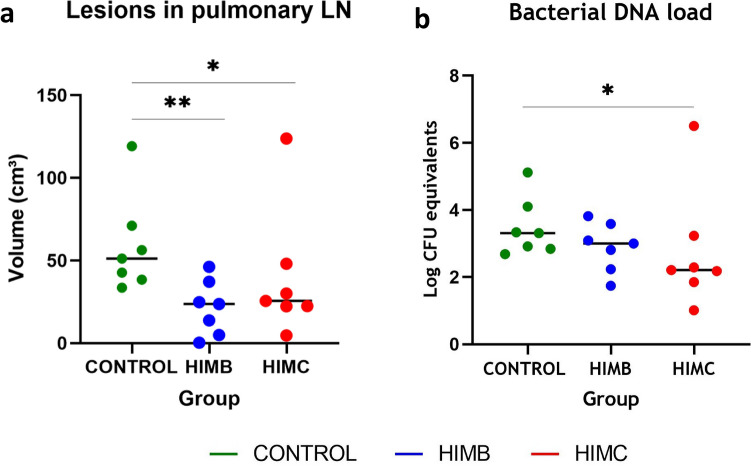
This study aimed to assess the efficacy of a heat-inactivated Mycobacterium caprae (HIMC) vaccine in goats experimentally challenged with the same strain of M. caprae. Twenty-one goats were divided into three groups of seven: vaccinated with heat-inactivated Mycobacterium bovis (HIMB), with HIMC and unvaccinated. At 7 weeks post-vaccination all animals were endobronchially challenged with M. caprae. Blood samples were collected for immunological assays and clinical signs were recorded throughout the experiment. All goats were euthanized at 9 weeks post-challenge. Gross pathological examination, analysis of lung pathology using computed tomography, and bacterial load quantification in pulmonary lymph nodes (LN) by qPCR were carried out. Only HIMC vaccinated goats showed a significant reduction of lung lesions volume and mycobacterial DNA load in LN compared to unvaccinated controls. Both vaccinated groups showed also a significant reduction of the other pathological parameters, an improved clinical outcome and a higher proportion of IFN-γ-producing central memory T cells after vaccination. The results indicated that homologous vaccination of goats with HIMC induced enhanced protection against M. caprae challenge by reducing lung pathology and bacterial load compared to the heterologous vaccine (HIMB). Further large-scale trials are necessary to assess the efficacy of autovaccines under field conditions.


Conflict of interest statement

The authors declare no competing interests.

Figures

Figure 1
Figure 1
Whole blood IFN-γ responses after vaccination and challenge: The graph shows the IFN-γ levels measured by ELISA. Results are expressed as the increase in optical density (ΔOD 450 mn ± 95% CI). (a) Response against bovine tuberculin (PPD-B). (b) Response to the P22 complex. (c) Response against E/C antigen cocktail. *P < 0.05, **P < 0.01, Kruskal Wallis test with post hoc Dunn’s test. Groups: Control (n = 7, green), HIMB (n = 7, blue), HIMC (n = 7, red). Two animals of the control group were humanely sacrificed at week 7.
Figure 2
Figure 2
Flow cytometry analysis of IFN-γ producing lymphocytes before M. caprae challenge. The analysis was conducted with peripheral blood mononuclear cells (PBMC) isolated from all goats at week 0 (7 weeks post-vaccination and before M. caprae challenge) after stimulation with PPD-B overnight. (ad) Representative plots of gating strategies. (a) Singlet cells identified by forward scatter (FSC). (b) Lymphocytes determined by side scatter (SSC). (c) Representative frequencies of CD4 cells and intracellular IFN-γ staining (IFNG+). (d) Representative frequencies of the CD45RO/CD62L subsets gated from CD4 + IFN-γ + cells. (e) Frequencies (%) ± 95% CI of CD45RO+ CD62L+ within the CD4 + IFN-γ-producing cells. Blue dots are the CD4+ IFNG+ CF45RO+ CD62L+ cells and the yellow dots represent the rest of CD4+ IFNG+ cells. Groups: Control (N = 5, green), HIMB (N = 7, blue), HIMC (N = 5, red). *P < 0.05, **P < 0.01, Kruskal Wallis test with post hoc Dunn’s test.
Figure 3
Figure 3
Cytokine profiles before and after M. caprae challenge. Cytokine productions detected in plasma after stimulating whole blood with mycobacterial antigens in each experimental group at week 0 (before challenge), and weeks 5 and 9 after challenge. (a) M. bovis tuberculin (PPD-B). (b) ESAT-6/CFP-10 antigen cocktail (E/C). The heat-map represents the mean cytokine production relative to the maximum production (100%) of each cytokine.
Figure 4
Figure 4
Antibody responses after vaccination and challenge. The figure shows the levels of IgG against MPB83 and P22 antigen measured by ELISA throughout the study. MPB83 results are expressed as the increase of optical density (ΔOD450mn ± 95% CI). P22 ELISA results are expressed as E%: [mean OD450nm of antigen-coated well/(2 × mean negative control OD450nm)] × 100. Groups: Control (N = 7, green, N = 5 at week 9), HIMB (N = 7, blue), HIMC (n = 7, red). *P < 0.05, **P < 0.01, Kruskal-Wallis test with Dunn’s post hoc test.
Figure 5
Figure 5
Rectal temperature and body weight. (a) Weekly mean rectal temperature of each group expressed in Celsius degrees (°C ± 95% CI). (b) Weekly mean cumulative body weight increases of each group expressed in ΔKg (Kg at each week post-challenge minus Kg at week 0) ± 95% CI. Groups: Unvaccinated control (green, N = 7 and N = 5 at weeks 8 and 9), vaccinated with HIMB (blue, N = 7) and vaccinated with HIMC (red, N = 7). *P < 0.05 between control and both vaccinated groups, one-way ANOVA with Tukey test for multiple pairwise comparisons.
Figure 6
Figure 6
Lung pathology assessed by computed tomography (CT) of intratracheally formalin perfused lungs. Example of the images obtained from the lungs of an unvaccinated control and two animals vaccinated with HIMB and HIMC, respectively. (a) Larger images on the left show the tracheobronchial tree and the TB lesions. (b) The top right miniatures show the TB lesion (whitish) superimposed onto the lung volume (yellowish). (c) The bottom right miniatures show (in red) the mineralized portion of the TB lesion. (d) Volumes of lung TB lesions in each group expressed in cm3. (e) To evaluate the lesion dispersion within the lungs in each group, the number of lobes with TB lesions in each animal is plotted against the number of animals. The control group has a higher number of animals with a higher number of affected lobes than the vaccinated groups. (f) Volume of lesion mineralization expressed in cm3. (g) Ratio between the volume of mineralization and the volume of lung lesions expressed in %. Horizontal lines in (d), (f) and (g) represent the median values. Groups: Control (n = 7, green), HIMB (n = 7, blue), HIMC (n = 7, red). *P < 0.05, **P < 0.01, Kruskal–Wallis test followed by one-tailed Dunn’s test for multiple comparisons.
Figure 7
Figure 7
Post-mortem results in pulmonary lymph nodes (LN). (a) Volume of lesions in LN expressed in cm3. (b) M. caprae DNA load in LN measured by quantitative PCR and expressed as Log10 CFU equivalents. *P < 0.05, **P < 0.01, Kruskal–Wallis with post hoc Dunn tests.

Similar articles

Cited by

References

    1. Gompo TR, et al. Risk factors of tuberculosis in human and its association with cattle TB in Nepal: A one health approach. One Health. 2020;10:100156. doi: 10.1016/j.onehlt.2020.100156. - DOI - PMC - PubMed
    1. Pérez De Val B, et al. Experimental model of tuberculosis in the domestic goat after endobronchial infection with Mycobacterium caprae. Clin. Vaccine Immunol. 2011;18:1872–1881. doi: 10.1128/CVI.05323-11. - DOI - PMC - PubMed
    1. Daniel R, et al. Papers: Outbreak of tuberculosis caused by Mycobacterium bovis in golden Guernsey goats in great britain. Vet. Rec. 2009;165:335–342. doi: 10.1136/vr.165.12.335. - DOI - PubMed
    1. MAPA. Programa Nacional de Erradicacion de Tuberculosis Bovina 2022 (Infección por el complejo Mycobacterium tuberculosis). In Ministerio de Agricultura Pesca y Alimentación (MAPA). (2021).
    1. Cvetnic Z, et al. Mycobacterium caprae in cattle and humans in Croatia. Int. J. Tuberc. Lung Dis. 2007;11(6):652–658. - PubMed

Publication types