. 2023 Jan;20(1):86-94.
doi: 10.1038/s41592-022-01705-x. Epub 2022 Dec 22.

Efficient combinatorial targeting of RNA transcripts in single cells with Cas13 RNA Perturb-seq

Affiliations

Efficient combinatorial targeting of RNA transcripts in single cells with Cas13 RNA Perturb-seq

Hans-Hermann Wessels et al. Nat Methods. 2023 Jan.

Abstract

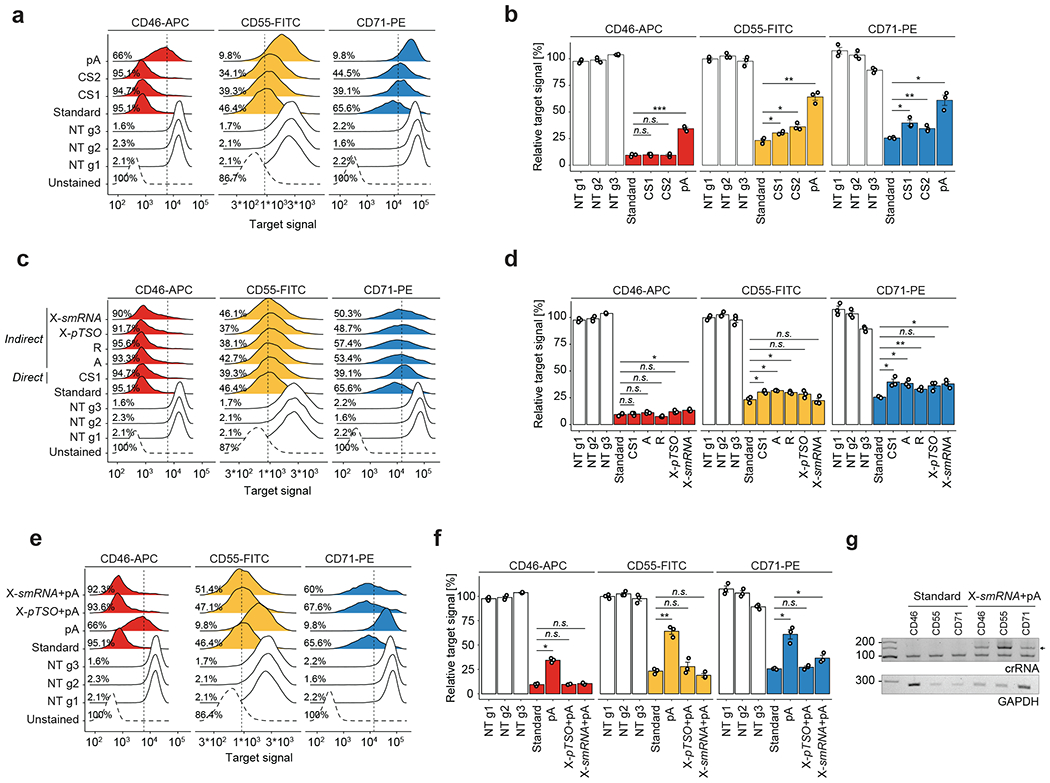
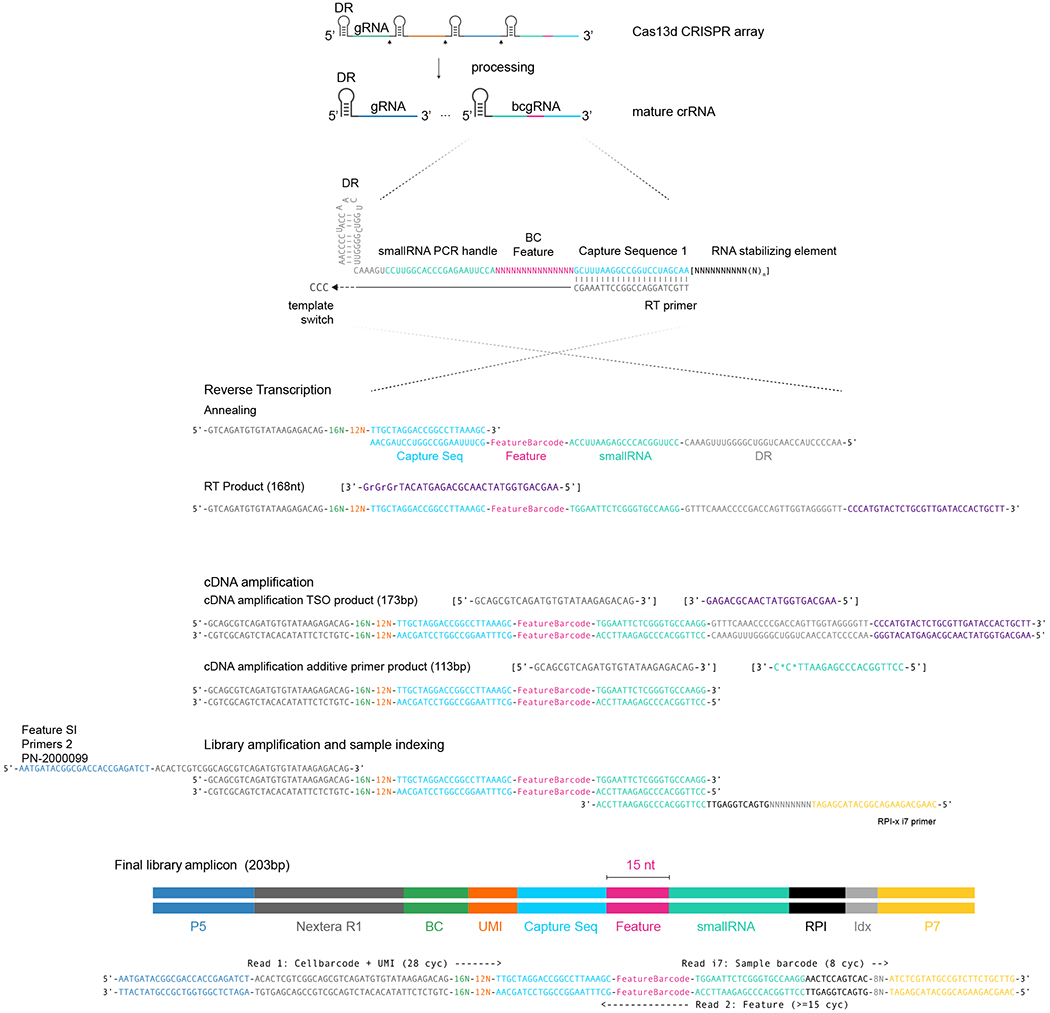
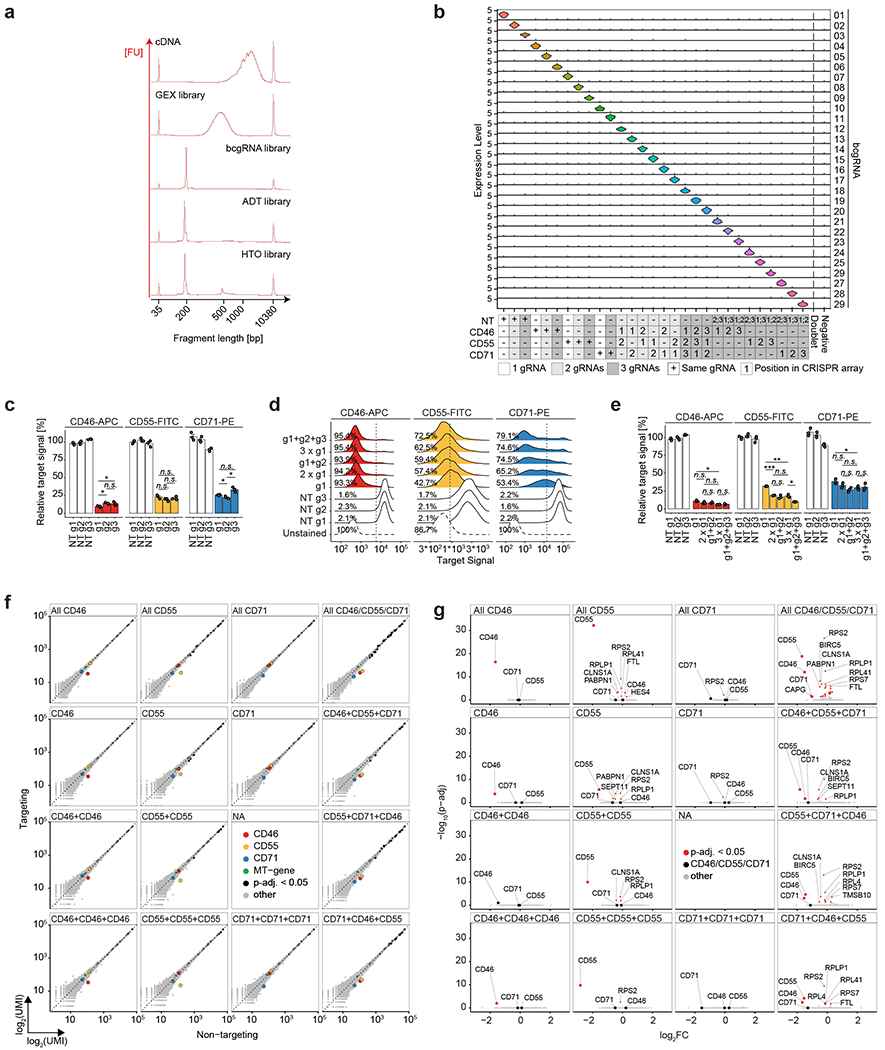
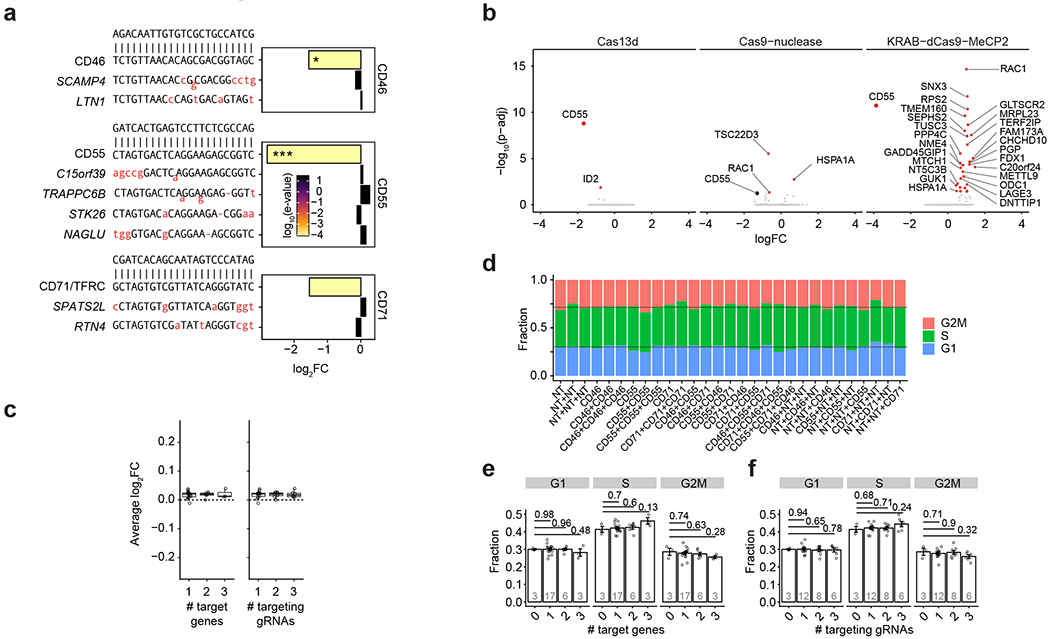
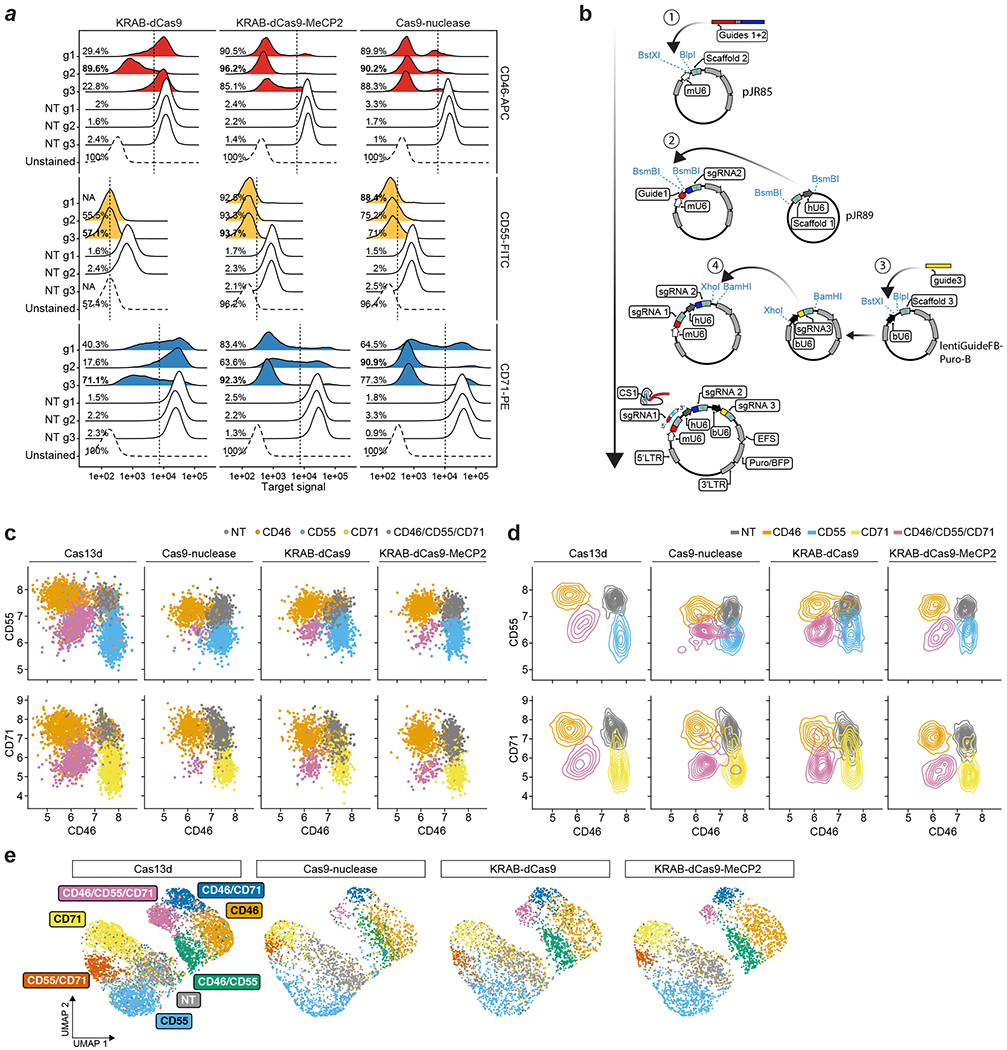
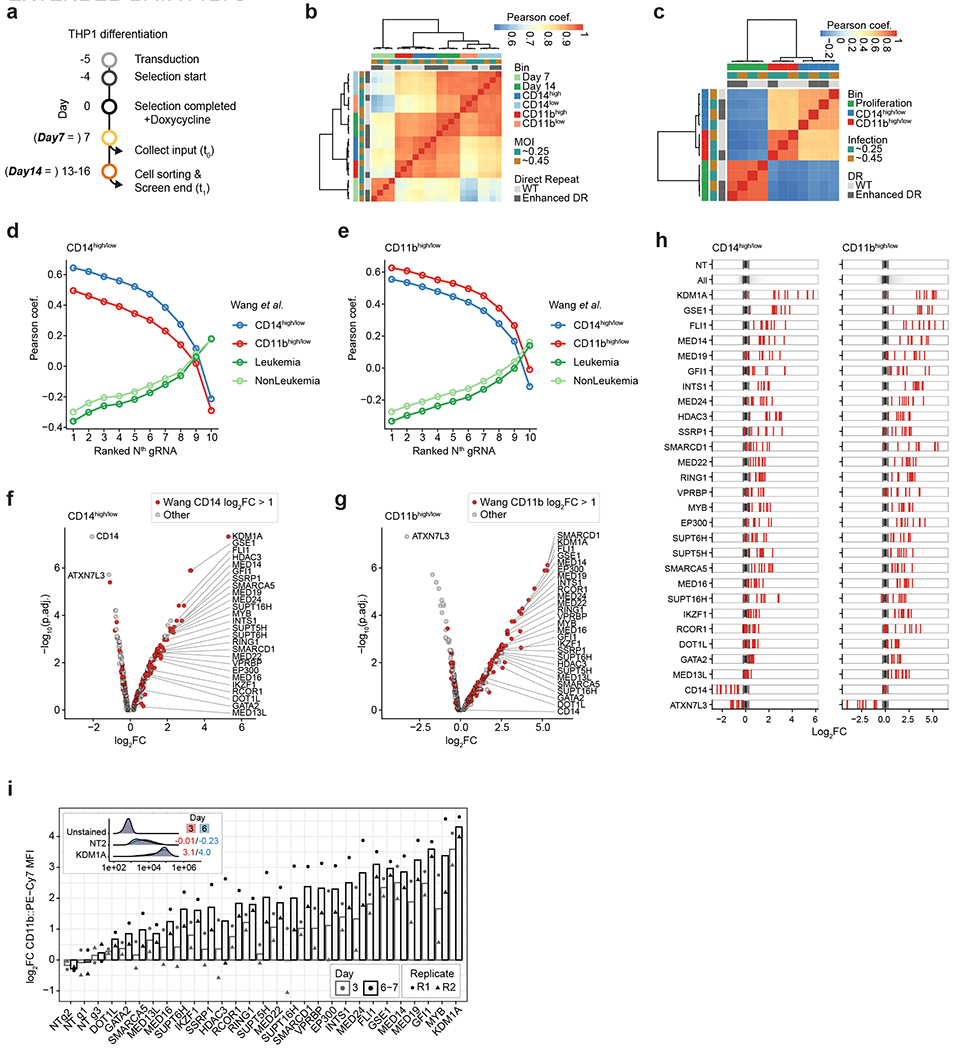
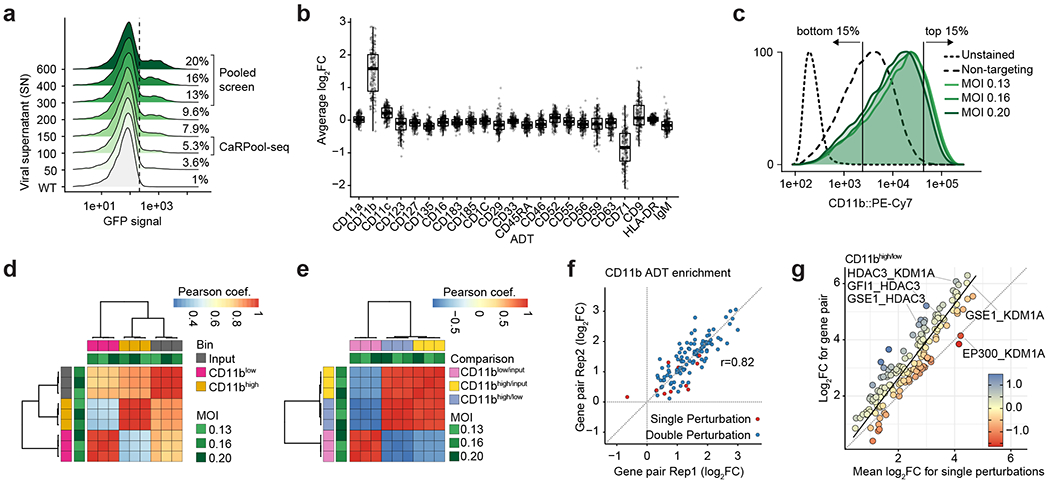
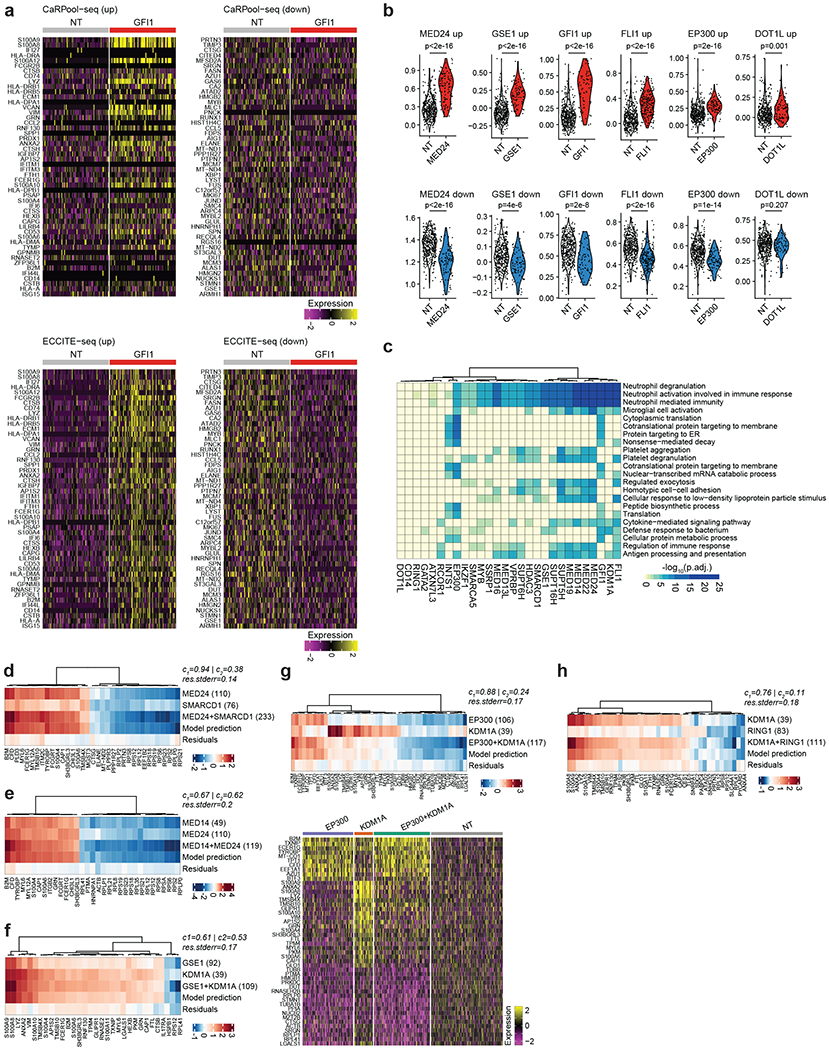
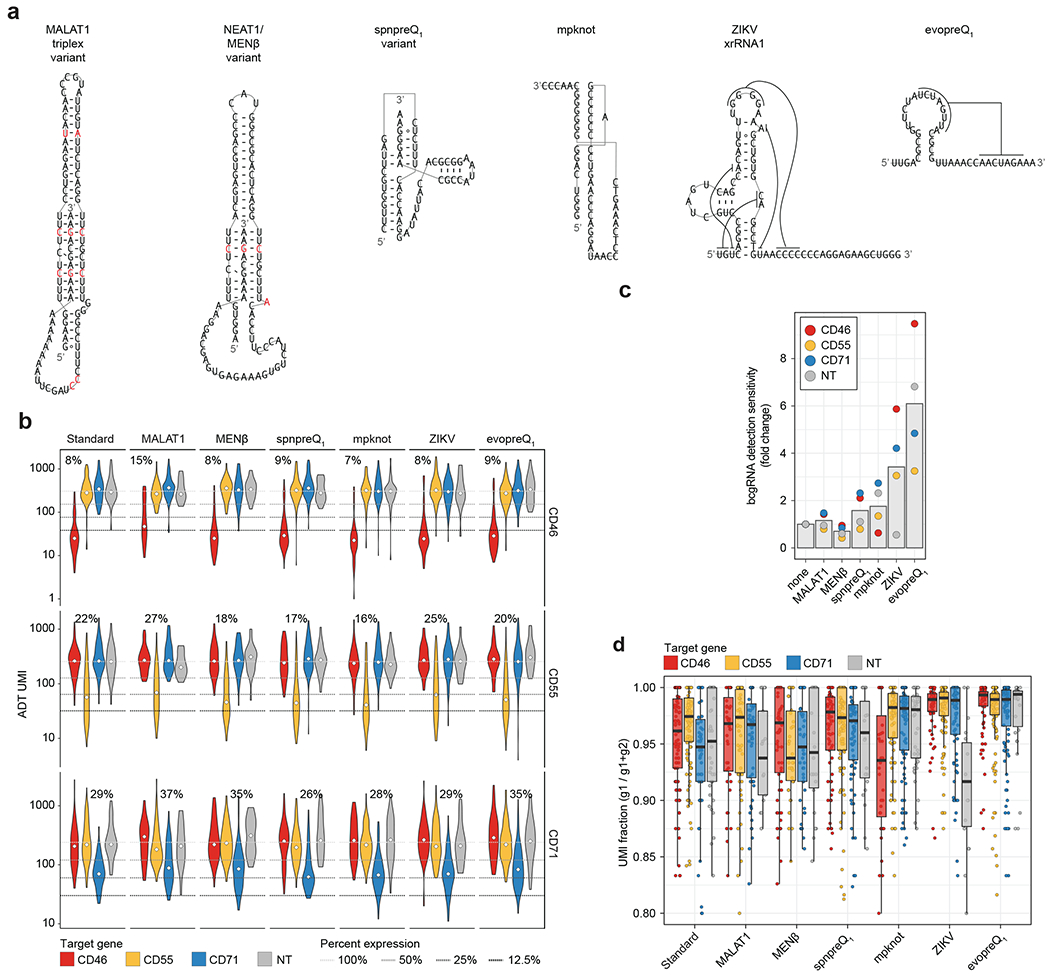
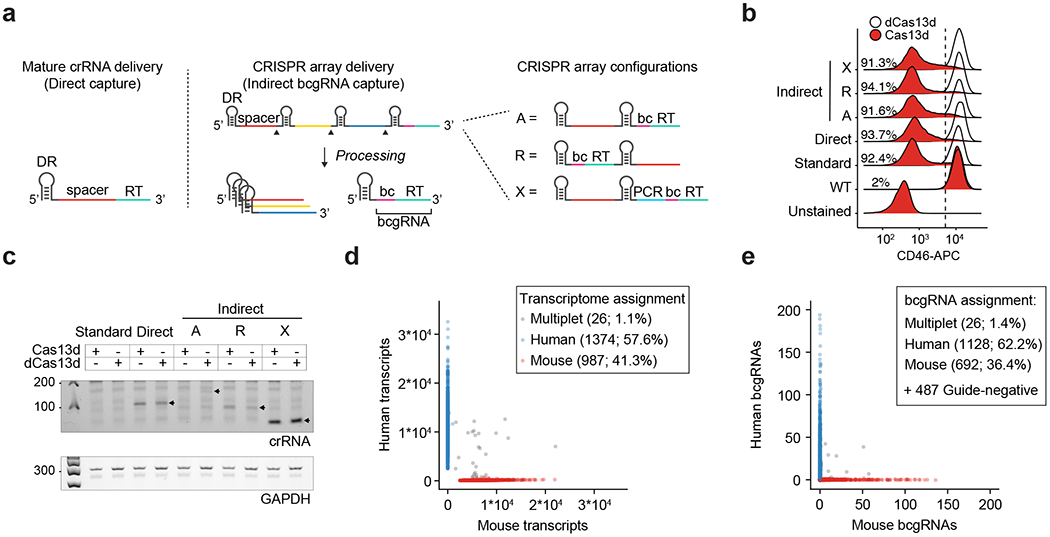
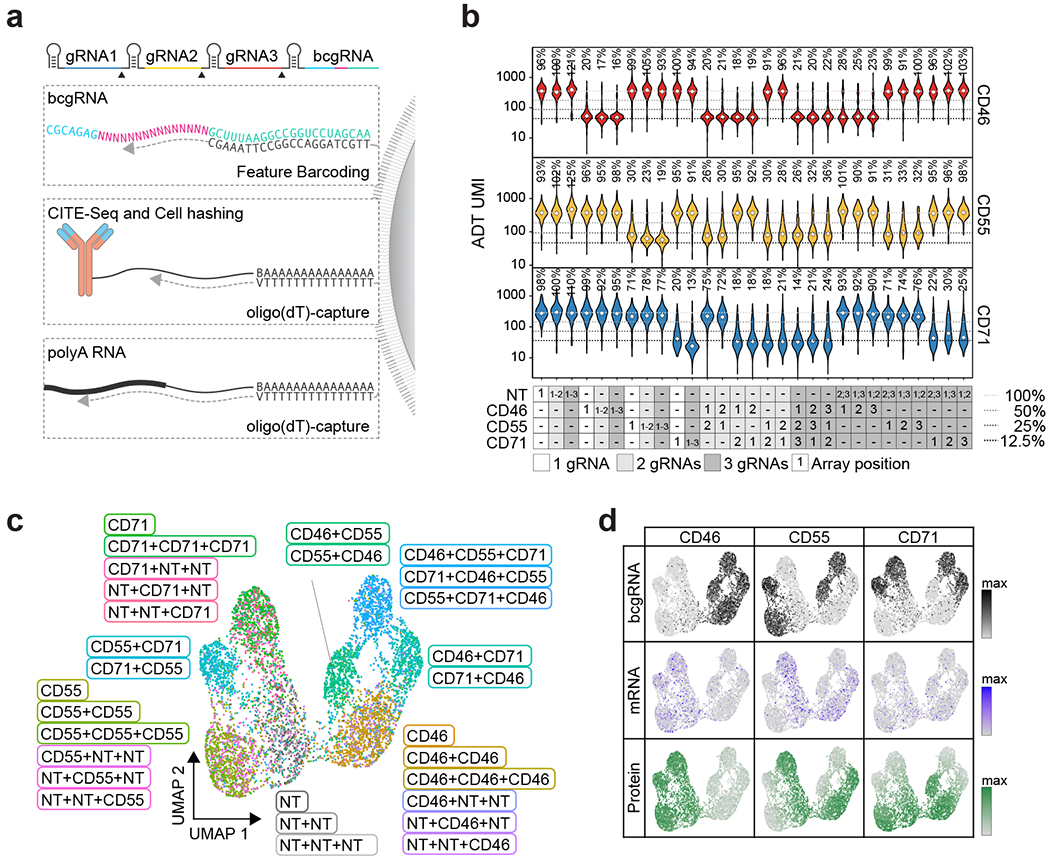
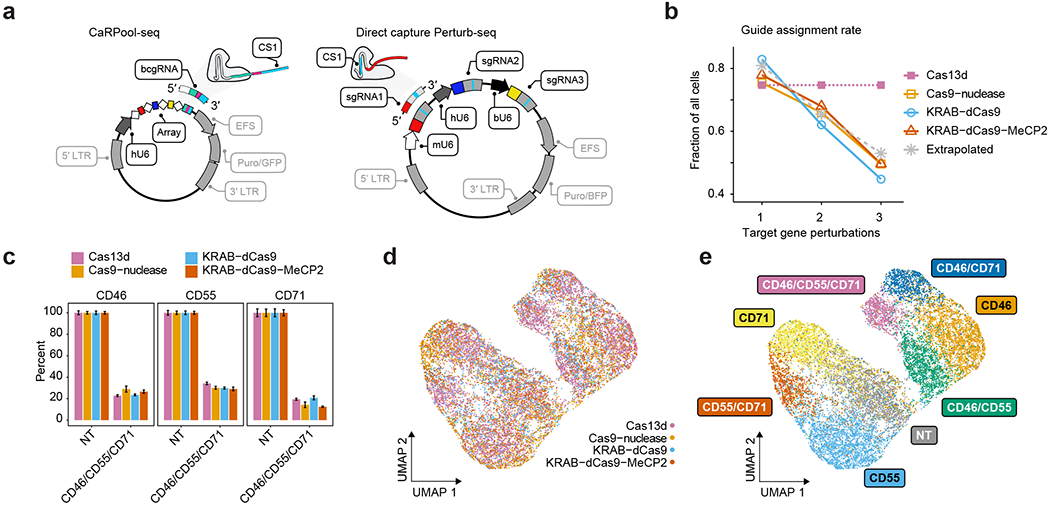
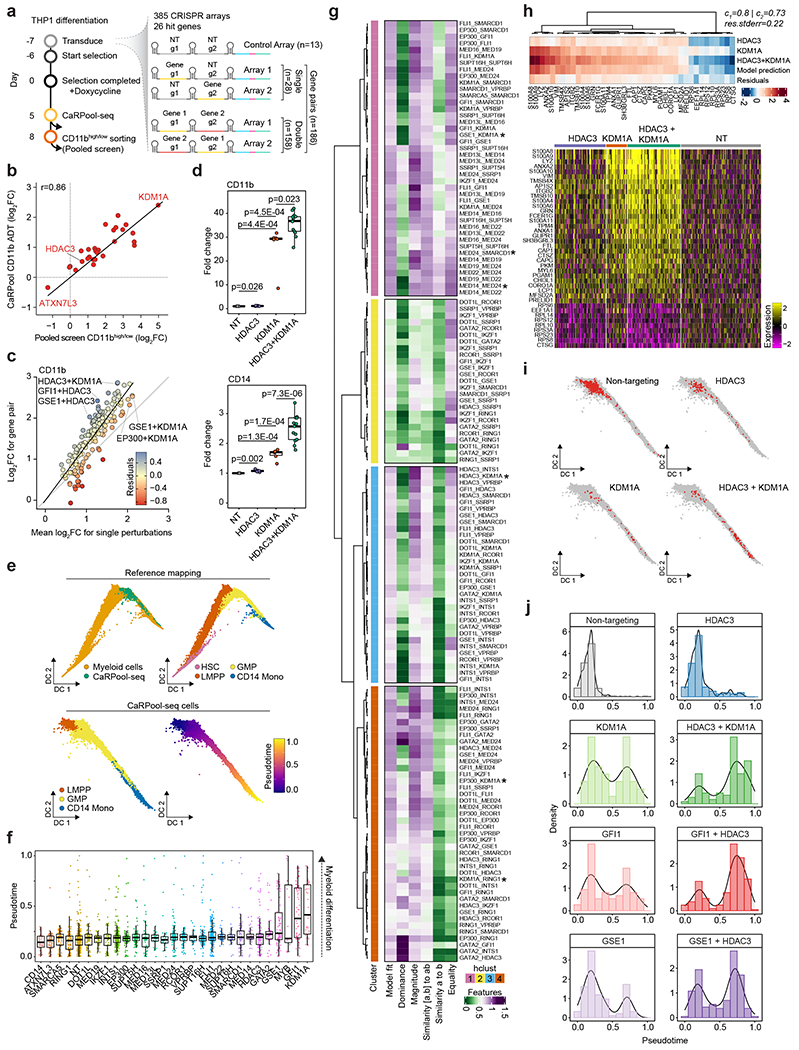
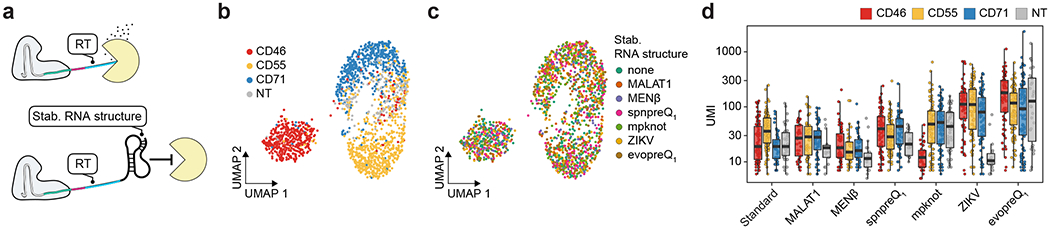
Pooled CRISPR screens coupled with single-cell RNA-sequencing have enabled systematic interrogation of gene function and regulatory networks. Here, we introduce Cas13 RNA Perturb-seq (CaRPool-seq), which leverages the RNA-targeting CRISPR-Cas13d system and enables efficient combinatorial perturbations alongside multimodal single-cell profiling. CaRPool-seq encodes multiple perturbations on a cleavable CRISPR array that is associated with a detectable barcode sequence, allowing for the simultaneous targeting of multiple genes. We compared CaRPool-seq to existing Cas9-based methods, highlighting its unique strength to efficiently profile combinatorially perturbed cells. Finally, we apply CaRPool-seq to perform multiplexed combinatorial perturbations of myeloid differentiation regulators in an acute myeloid leukemia (AML) model system and identify extensive interactions between different chromatin regulators that can enhance or suppress AML differentiation phenotypes.


Conflict of interest statement

Competing interests

In the past 3 years, R.S. has worked as a consultant for Bristol-Myers Squibb, Regeneron and Kallyope, and served as a SAB member for ImmunAI, Apollo Life Sciences GmbH, Nanostring and the New York City Pandemic Response Laboratory. N.E.S. is an advisor to Vertex and QIAGEN and is a cofounder of OverT Bio. P.S. is a coinventor on a patent related to protein detection by sequencing as described in this work. The New York Genome Center and New York University have applied for patents relating to the work in this article. The remaining authors declare no competing interests.

Figures

Extended Data Fig. 1 |
Extended Data Fig. 1 |. Direct and indirect Cas13 guide RNA capture allow for robust target knockdown.
a) Density plots showing the CD46-APC, CD55-FITC and CD71-PE flow cytometry signal upon Cas13d-mediated knockdown with either regular gRNAs or a direct capture gRNA with one of three reverse transcription handles (pA(30) = polyA-tail of length 30, CS1 = 10x Genomics Capture Sequence 1, CS2 = 10x Genomics Capture Sequence 2, NT = non-targeting). Vertical lines mark the threshold for CD-protein negative cells (2nd percentile of NT cell populations), indicating the percent negative cells for one replicate experiment. Importantly, the Cas13-mediated function shows a unimodal response, suggesting limited cell-to-cell differences in target gene knockdown. N > 5000 cells examined per sample. Shown is one representative replicate. b) Summary analysis of biological replicate experiments (n = 3) as shown in (a). Y-axis shows the mean fluorescent intensity (MFI) relative to the average of all NT cell populations. Direct capture constructs with CS1 or CS2 enable strong knockdown for CD46, but reduced knockdown for CD55 and CD71. Direct capture with pA-handle shows strongly reduced knockdown efficiency compared to regular gRNAs (standard condition). Two-sided t-test with * p < 0.05, ** p < 0.01, and *** p < 0.001. Error bars depict SEM. c) Density plots showing the CD46-APC, CD55-FITC, and CD71-PE signal upon Cas13d-mediated knockdown with either regular gRNAs, a direct capture gRNA, or indirect capture construct of types A, R, and X as shown in Fig. 1a. CS1 was used in all constructs with RT-handle. Type X was used with either a partial TSO (pTSO) PCR priming site or an Illumina smallRNA PCR-handle sequence. Vertical lines mark the threshold for CD-protein negative cells, indicating the percent negative cells for one replicate experiment. N > 5000 cells examined per sample. Shown is one representative replicate. d) Summary analysis of biological replicate experiments (n = 3) as shown in (c). Y-axis shows the mean fluorescent intensity (MFI) relative to the average of all NT cell populations. Indirect capture constructs show strong target gene knockdown similar to regular gRNAs (standard condition) for all three target genes. The slight reduction in targeting efficiency in indirect guide capture may be explained by CRISPR array processing constraints. Two-sided t-test with * p < 0.05, ** p < 0.01, and *** p < 0.001. Error bars depict SEM. e) Density plots showing the CD46-APC, CD55-FITC, and CD71-PE signal upon Cas13d-mediated knockdown with either regular gRNAs, a direct capture gRNA, or indirect capture construct of type X. Here, comparing the effect and placement of a polyA-tail RT-handle. pA indicates direct capture construct with polyA-tail. Type X was used with either a pTSO or smallRNA PCR-handle sequence. Vertical lines mark the threshold for CD-protein negative cells, indicating the percent negative cells for one replicate experiment. N > 5000 cells examined per sample. Shown is one representative replicate. f) Summary analysis of biological replicate experiments (n = 3) as shown in (e). Y-axis shows the mean fluorescent intensity (MFI) relative to the average of all NT cell populations. Indirect capture constructs show strong target gene knockdown like regular gRNAs (standard condition) for all three target genes. Target knockdown with direct capture through a polyA-tail sequence is limited. Two-sided t-test with * p < 0.05, ** p < 0.01, and *** p < 0.001. Error bars depict SEM. g) PCR amplicons of reverse-transcribed crRNAs from lentivirally infected cells used in (e) showing one representative experiment. Indirect capture of Type-X crRNAs with smallRNA PCR-handle and polyA-tail (arrow) allowed for reverse transcription and amplification. These results show that indirect gRNA capture can be facilitated with polyA-tail capture as an alternative to CS1-based capture.
Extended Data Fig. 2 |
bcgRNA capture scheme adapted from 10x Genomics Feature Barcoding technology.
Extended Data Fig. 3 |
Extended Data Fig. 3 |. CaRPool-seq enables efficient bcgRNA capture and specific target RNA knockdown.
a) Representative BioAnalyzer traces of cDNA and four jointly assayed modalities (GEX = gene expression, bcgRNA = barcode guide RNA, ADT = antibody derived tags, HTO = hashtag oligonucleotides). b) Stacked violin plot showing normalized bcgRNA UMI counts for cells grouped by assigned CRISPR array [total cells n = 9,355, cells with single bcgRNA n = 6,986, (74.7%), n = 29 single bcgRNA conditions; median number of cells 269 per condition, s.d. 97 cells]. c) Bar plots depicting CD46-APC, CD55-FITC, and CD71-PE signal upon Cas13d-mediated knockdown with three alternative gRNAs per target gene relative to the mean of three NT controls measured by flow cytometry. Y-axis shows the mean fluorescent intensity (MFI) relative to the average of all NT cell populations. Two-sided t-test with * p < 0.05, ** p < 0.01, and *** p < 0.001. (N = 3 replicate experiments; error bars depict SEM). Guide RNA g1 was used in CaRPool-seq experiments. Guide RNAs g2 and g3 are used in figures (d) and (e). d) Density plots showing the CD46-APC, CD55-FITC, and CD71-PE signal upon Cas13d-mediated knockdown with either 1, 2, or 3 copies of the same gRNA (g1) per CRISPR array or 2 and 3 alternative gRNAs (g2, g3). Vertical lines mark the threshold (2nd percentile of combined NT conditions) for CD-protein negative cells, indicating the percent negative cells for one replicate experiment. N > 5000 cells examined per sample. Shown is one representative replicate. e) Summary analysis of biological replicate experiments (n = 3) as shown in (d). Y-axis shows the mean fluorescent intensity (MFI) relative to the average of all NT cell populations. The Analysis suggests that target gene knockdown differences between the number of gRNAs per array are more pronounced than differences between gRNA identities with the same total gRNA count, given that gRNA efficiencies are comparable as shown in (c). CRISPR arrays encoding multiple gRNAs against the same target may be used to further enhance target knockdown. Two-sided t-test with * p < 0.05, ** p < 0.01, and *** p < 0.001. Error bars depict SEM. f) Scatterplots showing normalized pseudobulk RNA UMI count profiles of cells grouped by indicated CRISPR arrays (y-axis) and control cells that received non-targeting (NT) gRNAs (x-axis). Respective target genes (CD46, CD55, CD71) are highlighted in color. Genes on the MT chromosome are colored green. Other significantly differentially regulated genes (Wilcoxon’s rank sum test; adjusted p-value < 0.05) are highlighted in black. Genes highlighted in black showed a median expression change of 12.8% (s.d. 9.9%). CD71 + CD71 was not included in the experiment. g) Volcano plots showing differential gene expression results cells grouped by indicated CRISPR arrays and control NT cells. Cells grouping is the same as in (f). The x-axis indicates log-transformed fold changes. The y-axis depicts −log10-transformed adjusted p-values (Wilcoxon’s rank sum test). Significantly differentially regulated genes (adjusted p-value < 0.05) are highlighted in red.
Extended Data Fig. 4 |
Extended Data Fig. 4 |. Evaluation of Cas13d specific off-target effects in CaRPool-seq.
a) Sites, and relative expression levels of gRNA-dependent predicted off-target transcripts from gRNAs targeting CD46, CD55 and CD71. Red letters indicate mismatches and indels to cognate perfect match target site. E-values derived from Blastn. (Wilcoxon’s rank sum test * p.adj. < 0.05, ** p.adj. < 0.01, *** p.adj. < 0.001). b) Bulk RNA-seq result for Cas13d, Cas9-nuclease, and KRAB-dCas9-MeCP2 based targeting of CD55 using three independent CD55-targeting and NT (s)gRNAs, respectively. Volcano plots show differential gene expression results of CD55 targeting conditions relative to corresponding NT conditions grouped by indicated CRISPR effector protein. The x-axis indicates log-transformed fold changes. The y-axis depicts −log10-transformed adjusted p-values (DESeq2). Significant differentially regulated genes (adjusted p-value < 0.05, Wilcoxon’s rank sum test) are highlighted in red. The three approaches show a varying number of differentially expressed genes in addition to CD55 reduction (n = 1 Cas13d, n = 3 Cas9, n = 30 KRAB-dCas9-MeCP2). Cas13d gRNA and Cas9 sgRNA efficiency is shown in Extended Data Fig. 3c and Extended Data Fig. 5a. c) Differential gene expression of mitochondrial genes. Differential gene expression was assessed between all 26 cell populations expressing gene-targeting gRNAs and cells expressing a single NT gRNA. Across all differential gene expression analyses (n = 26), none of the 13 mitochondrial genes encoded on the mitochondrial chromosome was expressed significantly different from control cells (adjusted p-value < 0.05; Wilcoxon’s rank sum test). The figure shows the average log2 fold change (FC) across all 13 mitochondrial genes per condition (n = 26) grouped by the number of target genes (left) and number of targeting gRNAs (right) indicating that observed changes are independent of target RNA and gRNA amounts. d) Fraction of cells classified into indicated cell cycle stages for each condition (n = 29). Dotted lines indicate the means of the three NT cell populations. Statistical testing for differences in cell cycle stage assignment for cell populations targeting e) varying numbers of target genes per cell, or using f) increasing numbers of gRNAs per cell did not show significant differences to NT control cell populations expressing zero targeting gRNAs (p-values derived from two-sided students t-test, not corrected for multiple testing. Bars in (e) and (f) show mean. Error bars depict SEM. N numbers indicated inside bars).
Extended Data Fig. 5 |
Extended Data Fig. 5 |. Comparison of CaRPool-seq to alternative combinatorial perturbation approaches.
a) Density plots showing the CD46-APC, CD55-FITC, and CD71-PE flow cytometry signal upon Cas9-nuclease mediated knockout (KO) and CRISPRi-mediated (KRAB-dCas9, KRAB-dCas9-MeCP2) knockdown with three alternative sgRNAs from established genome-wide KO20 and CRISPRi21 libraries. Vertical lines mark the threshold (2nd percentile of combined NT conditions) for CD-protein negative cells, indicating the percent negative cells for one replicate experiment. Single guide RNAs with the highest percentage of negative cells (bold) were selected for direct capture Perturb-seq experiments (NA = sgRNA not assayed). b) Cloning strategy for triple sgRNA plasmid vectors. Dual sgRNA constructs were cloned as described before 6. The third sgRNA was cloned behind a bovine U6 promoter using an alternative sgRNA scaffold tested before 6. c) Cell surface protein expression (log2-normalized UMI counts) of CD46, CD55 and CD71 in cells assigned with indicated (s)gRNAs. CaRPool-CITE-seq (n = 4,979 cells) and Perturb-seq experiments using Cas9-nuclease (n = 2,270), KRAB-dCas9 (n = 2,104) or KRAB-dCas9-MeCP2 (n = 2,326). d) Contour plots of data shown in (c). e) Protein level ADT-based clustering of single-cell expression profiles of merged CaRPool-CITE-seq (n = 6,986 cells) and Perturb-seq experiments using Cas9-nuclease (n = 2,836), KRAB-dCas9 (n = 2,911) or KRAB-dCas9-MeCP2 (n = 3,038) effector proteins as in Fig. 3e. Cells are labelled by the assigned target gene combination based on detected bcgRNA or sgRNAs and split by Perturb-seq.
Extended Data Fig. 6 |
Extended Data Fig. 6 |. A pooled Cas13 screen identifies regulators of AML differentiation.
a) Timeline for THP1 cell infections and pooled screen readouts for CD14 and CD11b fluorescent activated cell sorting (FACS). We transduced a pooled lentivirus library with 4,800 gRNAs targeting 439 genes (10 gRNAs per gene) and 410 NT control gRNAs. Each gRNA was tested using two alternative Cas13d direct repeat (DR) sequences [wildtype (WT) or enhanced DR; see Methods]. Cells were infected at two different MOIs for each DR. Cells were collected at day 7 (timepoint 0; t0) and approximately day 14 (range between day 14 and day 16; t1) post Cas13d induction. On day 14, cells were sorted based on their cell surface protein expression into CD14 and CD11b high (top 15%) and low (bottom 15%) bins. At each time point, we collected and sorted cell populations with >1000x coverage. With alternative MOI infections and DR sequences used, we conducted four and three replicated phenotypic cell sorts for CD14 and CD11b. b) Pearson correlation of normalized and batch corrected gRNA counts for all samples. c) Pearson correlation of log2-transformed gRNA enrichments of the population of interest relative to the corresponding control population (CD11bhigh/low: gRNA counts in CD11bhigh bin divided by CD11blow bin; CD14high/low: gRNA counts in CD14high bin divided by CD14low bin; proliferation: gRNA counts at t1 divided by t0). d) Correlation of log2FC gene enrichments for CD14 upregulation (CD14high/low) to enrichments presented in Wang et al. Correlation analysis was repeated for every single ranked gRNA (see Methods), always considering only one ranked gRNA per target gene. This analysis indicated that, as expected, target gene enrichments for CD14 upregulation correlated best with CD14 target gene enrichments in Wang et al., and that correlations were similarly high for the top-ranked 4-5 gRNA. e) Similar analysis as presented in d showing result for target genes regulating CD11b enrichments. f) Volcano plot showing gene enrichments for target genes regulating CD14 upregulation (CD14high/low). Each gene is represented as the mean of the four top-ranked gRNAs across all replicate experiments (see Methods). Y-axis shows −log10 transformed adjusted p-value derived from Robust Ranked Aggregation (RRA). Target genes selected based on previous results (Wang et al.) are shown in red. The 28 genes used in the subsequent CaRPool-seq experiment are highlighted. As expected, CD14 was the most depleted gene. g) Similar analysis as presented in (f) showing results for target genes that lead to CD11b enrichment. CD11b-targeting gRNAs were not included in the gRNA library. h) Consistent gRNA enrichment/depletion of all 28 target genes. (NT = all non-targeting gRNAs, All = all gRNAs, Gene Name = Red ticks highlighting targeting specific gRNAs atop of the non-targeting gRNA distribution (n = 10 per target gene). Dotted lines indicate the 95 percent confidence interval for NT gRNA distribution). i) CD11b expression upon individual gRNA infections for 26 hit genes and three NT controls. Cas13d expressing THP1 cells were transduced with individual gRNA-delivering lentivirus targeting one out of 26 selected target genes (gRNA was selected from pooled screen). Cells were assayed repeatedly (three and six-to-seven days post Cas13d-induction with doxycycline) for CD11b levels. Y-axis shows the CD11b::PE-Cy7 MFI relative to the average of all three NT control samples for the respective time point. Bars show the mean of two independent replicates (two THP1 Cas13d cell thaws infected on separate days). The inset shows CD11b::PE-Cy7 levels in KDM1A and NT targeted cells three and six days after Cas13d induction.
Extended Data Fig. 7 |
Extended Data Fig. 7 |. Combinatorial targeting of AML differentiation regulators.
a) Titration of CaRPool-seq lentivirus four days after transduction. Viral constructs contain a Puromycin-2A-GFP expression cassette. Density plots show the percent GFP positive cells compared to the 99th percentile of WT control cells. The percent GFP-positive cells indicate the MOI. Low-MOI cells were used in the CaRPool-seq experiment, and high-MOI conditions were used for pooled screen readout (= 3 infections). b) Differential expression analysis for ADTs of cell surface proteins assayed in the CaRPool-seq experiment. Each point represents results for one gene pair summarizing the effect across both independent CRISPR array replicates per gene pair (n = 186, single and double perturbations). To account for differences in cell number per gene pair we calculated log2FC as the mean of 10 samples of a random cell using 30 cells (or all cells for gene pairs < 30 cells) per gene pair relative to the same number of NT control cells. All but two gene pairs show elevated levels of CD11b. Boxes indicate the median and interquartile ranges, with whiskers indicating 1.5 times the interquartile range. c) Density plots showing the CD11b::PE-Cy7 signal of THP1 cells transduced with NT gRNAs or the CaRPool-seq library 8 days post Cas13d-induction. We collected unsorted cells alongside cells sorted based on CD11b signal collecting the 15% of lowest and highest CD11b signal. We collected and sorted cell populations with >1000x coverage. d) Pearson correlation of normalized and batch corrected bcgRNA counts for all samples. e) Pearson correlation of log2-transformed bcgRNA enrichments of population of interest relative to the corresponding control population (CD11bhigh/low: bcgRNA counts in CD11bhigh bin divided by CD11blow bin; CD11bhigh/input: bcgRNA counts in CD11bhigh bin divided by unsorted input representation; CD11blow/input: bcgRNA counts in CD11blow bin divided by unsorted input representation). f) Comparison of log2FC CD11b ADT enrichments relative to NT cells in CaRPool-seq data comparing the two technical replicate gene pair arrays. Shown are all technical replicates where both arrays were represented by at least 25 cells (n = 122 gene pairs). g) Correlation of CD11bhigh/low log2FC enrichments in dual perturbation cells and the mean log2FC of both single perturbation cells corresponding to the dual perturbation (n = 158 gene pairs). Residuals indicate the distance to the average linear relationship. For each gene pair, we used the mean of both replicate CRISPR arrays.
Extended Data Fig. 8 |
Extended Data Fig. 8 |. Transcriptome analysis of combinatorial targeting of AML differentiation regulators.
a) Single-cell gene expression heatmap showing the 50 most up-regulated (left) and down-regulated (right) genes upon GFI1 perturbation (Wilcoxon’s rank sum test) identified in ECCITE-seq data (Wang et al.). We compared cells expressing non-targeting control gRNAs (NT) and GFI1 targeting gRNAs for CaRPool-seq (top) and ECCITE-seq (bottom), respectively. The ECCITE-seq data was filtered using mixscape (Papalexi et al. 9) to remove unperturbed cells prior to identification of the most regulated genes. b) Gene module scores for the 50 most up-regulated and most down-regulated genes upon target gene perturbation identified in ECCITE-seq data as described in (a). The module scores show the average expression of perturbation-specific target genes per cell comparing cells with the indicated target gene perturbation to cells with non-targeting control gRNAs (one-tailed Kolmogorov–Smirnov test). c) EnrichR gene ontology analysis for biological processes (GOBP) for all single-gene perturbations (n = 28) using up to 100 significantly (p < 0.01, Wilcoxon’s rank sum test) upregulated genes per gene pair compared to NT condition. Shown are the −log10-transformed adjusted p-values for GO-terms with p < 0.00001 (Fisher’s exact test) in at least one condition. d-h) Comparison of transcriptional responses for double versus single perturbation. Heatmaps show deviation in average gene expression relative to unperturbed cells for the 20 most significantly regulated genes (Wilcoxon’s rank sum test). These heatmaps visualize a range of observed interactions between gene pairs, including cases where genes contribute equally to the dual perturbation response (d-f), and where one gene’s perturbation signature dominates over the other (g-h). Average heatmaps in g is accompanied by single-cell gene expression heatmap below.
Extended Data Fig. 9 |
Extended Data Fig. 9 |. Structured RNAs can improve bcgRNA detection in CaRPool-seq experiments.
a) Nucleotide sequences that can form stable RNA structures when placed 3′ to a bcgRNA. Sequences found in MALAT1 and NEAT1 (MENß) required nucleotide exchanges (shown in red) to remove potential terminator sequences (≥ 4U) and allow the sequences to be fully transcribed by RNA polymerase III. b) Violin plots depicting protein expression of target genes (ADT UMI counts for CD46, CD55, CD71), grouped by CRISPR arrays [combination of target gene (y-axis) and stabilizing RNA element (x-axis); (total cells: n = 1,770; conditions n = 28; cell per condition: median n = 63 cells; s.d. n = 30 cells)]. Three dashed lines indicate 50%, 25%, and 12.5% UMI count relative to the mean of all non-targeting cells by target ADT. The numbers above each violin plot indicate the median reduction across single cells for cells with matching gRNA and target. Diamonds indicate median value of cell population. c) Fold enrichment of bcgRNA UMI counts relative to UMI counts in the standard bcgRNA capture condition separated by the target gene. The evopreQ1 element yielded on average 6-fold higher bcgRNA detection sensitivity (n = 4 per condition). Bars indicate mean. d) UMI Fraction comparing the assigned bcgRNA to the sum of assigned and second most abundant bcgRNA that may be detected for the same cell [UMI g1 / (UMI g1 + UMI g2)]. Boxes indicate the median and interquartile ranges, with whiskers indicating 1.5 times the interquartile range. (Total cells: n = 1,770; conditions n = 28; cell per condition: median n = 63 cells; s.d. n = 30 cells).
Fig. 1 |
Fig. 1 |. Efficient capture of gRNAs for CaRPool-seq.
a, Scheme of direct and indirect array-based gRNA capture approaches. Direct capture uses a reverse transcription (RT) handle added directly downstream to the gRNA. For the indirect capture method, a bcgRNA is captured as a cleavable part of a CRISPR array. Three different CRISPR array configurations (A, R and X) have been tested (bc, barcode; PCR, PCR primer annealing site; A, array; R, reversed array configuration; X, extra PCR handle). b, Density plots showing the CD46-APC signal on Cas13d-mediated CD46 knockdown (red) and dCas13d-mediated controls (white) using the four CaRPool-seq configurations described in a, as well as standard gRNA. The CS1 reverse transcription handle was used in all cases. N > 5,000 cells examined per sample. c, PCR amplicons of reverse-transcribed crRNAs from lentivirally infected cells used in b of one representative experiment. Expected product sizes: Direct capture 109 bp, A-type and R-type array 99 bp, X-type array 52 bp, unprocessed A-type array (159 bp). d, Species-mixing experiment profiling 2,387 HEK293FT-Cas13d or mouse NIH/3T3-Cas13d cells lentivirally transduced with CRISPR array virus. The CRISPR array includes a NT gRNA and a bcgRNA in X-type configuration. Axes show the number of transcripts associated with each cell barcode. Datapoint colors and boxed labels are assigned based on transcriptome classification (Methods). e, Number of bcgRNAs associated with each cell barcode. Datapoint colors are based on transcriptome classification, and boxed labels are based on observed bcgRNA.
Fig. 2 |
Fig. 2 |. CaRPool-seq enables combinatorial gene targeting with a multimodal single-cell readout.
a, CaRPool-seq can be combined with CITE-seq and Cell Hashing modalities. b, Violin plots depicting protein expression of target genes (ADT UMI counts for CD46, CD55, CD71), grouped by CRISPR arrays (n = 29; median number of cells 269; s.d. 97 cells). Three dashed lines indicate 50, 25 and 12.5% UMI count relative to the median of all NT cells. Diamonds indicate the median UMI count. The number above each violin plot indicates the mean level of reduction across single cells. CD71 + CD71 was not included in the experiment. c, UMAP visualization of single-cell protein expression profiles of CaRPool-seq experiment (n = 6,986 cells). Cells are colored based on the single or combinatorial perturbations they received. d, Expression levels of bcgRNA (black), mRNA (blue) and protein (ADT, green) for CD46, CD55, CD71 superimposed on the UMAP visualization (n = 6,986 total cells).
Fig. 3 |
Fig. 3 |. Benchmarking CaRPool-seq against alternative combinatorial perturbation approaches.
a, Plasmid vectors for lentivirus production for triple perturbation scenarios comparing CaRPool-seq and Direct Capture Perturb-seq. b, Fraction of cells where the correct combination of gRNA was detected for single, double and triple perturbations. The dashed gray line represents a theoretical extrapolation based on an assumption of independent sgRNA detection with P = 0.81 (ref. ). c, Relative expression of cell surface proteins CD46, CD55 and CD71 in cells with assigned NT (s)gRNAs or a combination of three targeting (s)gRNAs (NT, n = 448, 711, 510, 577; CD46/CD55/CD71, n = 874, 55, 142, 89 for Cas13d, Cas9-nuclease, KRAB–dCas9 and KRAB–dCas9–MeCP2, respectively). The expression level of each target is normalized to NT control. Bars indicate mean across cells with s.e.m. error bars. d, Protein level ADT-based clustering of single-cell expression profiles of merged CaRPool-seq (n = 6,986), Perturb-seq experiments using Cas9 (n = 2,836), KRAB–dCas9 (n = 2,911) or KRAB–dCas9–MeCP2 (n = 3,038). Cells are colored by perturbation technology. e, As for d. Cells are colored based on the single or combinatorial perturbation received.
Fig. 4 |
Fig. 4 |. CaRPool-seq identified genetic interactions in AML differentiation.
a, Timeline for THP1 cell infection, CaRPool-seq and pooled screen for CD11b expression. Pooled lentivirus library encodes 385 CRISPR arrays, with 158 gene pair perturbations, 28 single-gene perturbations (each with two nonoverlapping gRNAs (technical replicate); single, gene_g1/NT_g2 and NT_g1/gene_g2; pair, geneA_g1/geneB_g2 and geneA_g2/geneB_g1) and 13 NT controls. b, Correlation of bcgRNA enrichment in the pooled screen (CD11bhigh/low) and CD11b ADT log2FC for cells grouped by bcgRNA cells relative to control cells in CaRPool-seq. c, Correlation of CD11b ADT log2FC of cells with dual perturbations, and the mean log2FC of both single perturbations (n = 158 gene pairs). Residuals indicate the distance to the average linear relationship. d, Relative cell surface marker expression. Monoclonal THP1 KRAB–dCas9–MeCP2 cells were infected with dual sgRNA lentiviral particles, carrying 0, 1 or 2 targeting sgRNAs (NT + NT n = 3; KDM1A + NT n = 6; HDAC3 + NT n = 6; KDM1A + HDAC3 n = 13 combinations). Puromycin-selected cells were stained for CD11b (top, PE-Cy7) and CD14 (bottom, APC) 7 days posttransduction. Shown is the mean fluorescence intensity (>5,000 cells per sample) for each sample compared to the mean fluorescence intensity of the three NT samples (one-tailed t-tests). e, Diffusion map showing THP1 CaRPool-seq cells integrated into a subset of a human bone marrow reference (see Methods). Pseudotemporal ordering was performed jointly on all cells and is shown for CaRPool-seq (n = 30,707) separately. f, Pseudotime quantification of singly perturbed cells (total cells, n = 2,612; single-gene perturbation, median n = 74 cells; s.d. n = 86 cells). g, Regression model results decomposing the observed dual perturbation responses as a linear combination of single-gene perturbation responses (Methods). h, Comparison of transcriptional responses for dual versus single perturbation. Heatmap shows deviation in average gene expression relative to unperturbed cells for the 20 most significantly regulated genes (Wilcoxon’s rank-sum test). Average heatmap (top) is accompanied by single-cell gene expression heatmap (bottom) (HDAC3 n = 96 cells, KDM1A n = 36 cells and HDAC3 + KDM1A n = 99 cells). i, CaRPool-seq diffusion map as in e highlighting cells that have received indicated gRNAs. j, Quantification of pseudotemporal ordering of perturbed cells. Boxes in d and f indicate the median and interquartile ranges, with whiskers indicating 1.5 times the interquartile range.
Fig. 5 |
Fig. 5 |. Stable RNA structures improve bcgRNA detection in CaRPool-seq experiments.
a, Model of 3′ exonucleolytic decay of bcgRNAs when embedded in CRISPR–Cas13d ribonucleoprotein complex. RT represents the reverse transcription handle. b, UMAP visualization of single-cell protein expression profiles of CaRPool-seq experiment (n = 1,770 cells). The experiment included four different gRNAs (NT control, CD46, CD55 and CD71) in combination with one out of seven different stabilizing elements. Cells are colored based on the single perturbations they received. c, UMAP visualization of single-cell protein expression profiles of CaRPool-seq experiment as shown in b. Cells are colored based on the structured RNA element they received (no stabilizing element (standard) or one of the six shown in Extended Data Fig. 9a). d, UMI counts for the assigned bcgRNA for each cell separated by target gene and RNA stabilizing element. UMI counts >2,000 are not shown. Boxes indicate the median and interquartile ranges, with whiskers indicating 1.5 times the interquartile range (total cells n = 1,770; conditions n = 28; cell per condition, median n = 63 cells; s.d. n = 30 cells). ZIKV, zika virus.

References

    1. Dixit A et al. Perturb-Seq: dissecting molecular circuits with scalable single-cell RNA profiling of pooled genetic screens. Cell 167, 1853–1866 (2016). - PMC - PubMed
    1. Datlinger P et al. Pooled CRISPR screening with single-cell transcriptome readout. Nat. Methods 14, 297–301 (2017). - PMC - PubMed
    1. Jaitin DA et al. Dissecting immune circuits by linking CRISPR-pooled screens with single-cell RNA-seq. Cell 167, 1883–1896 (2016). - PubMed
    1. Mimitou EP et al. Multiplexed detection of proteins, transcriptomes, clonotypes and CRISPR perturbations in single cells. Nat. Methods 16, 409–412 (2019). - PMC - PubMed
    1. Adamson B et al. A multiplexed single-cell CRISPR screening platform enables systematic dissection of the unfolded protein response. Cell 167, 1867–1882 (2016). - PMC - PubMed

Publication types