. 2023 Feb;42(9):638-650.
doi: 10.1038/s41388-022-02578-2. Epub 2022 Dec 23.

Monitoring the 5'UTR landscape reveals isoform switches to drive translational efficiencies in cancer

Affiliations

Monitoring the 5'UTR landscape reveals isoform switches to drive translational efficiencies in cancer

Ramona Weber et al. Oncogene. 2023 Feb.

Abstract

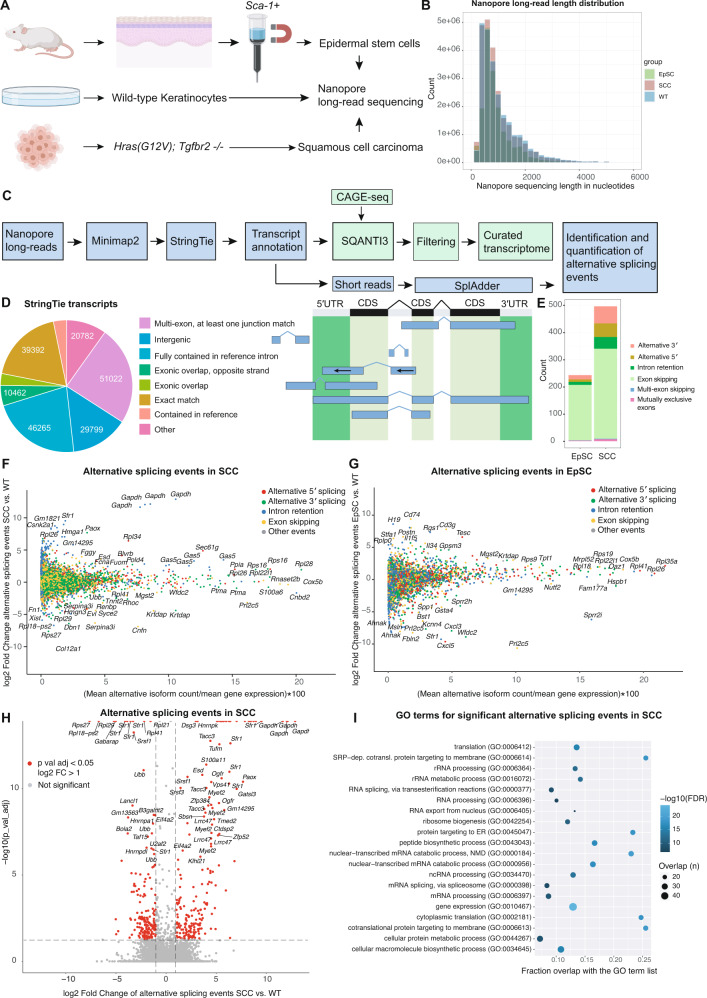
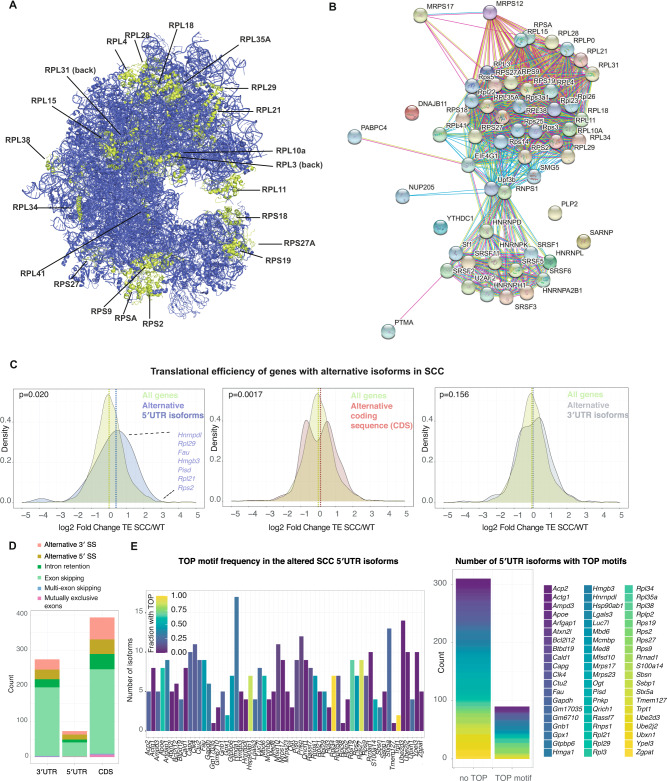
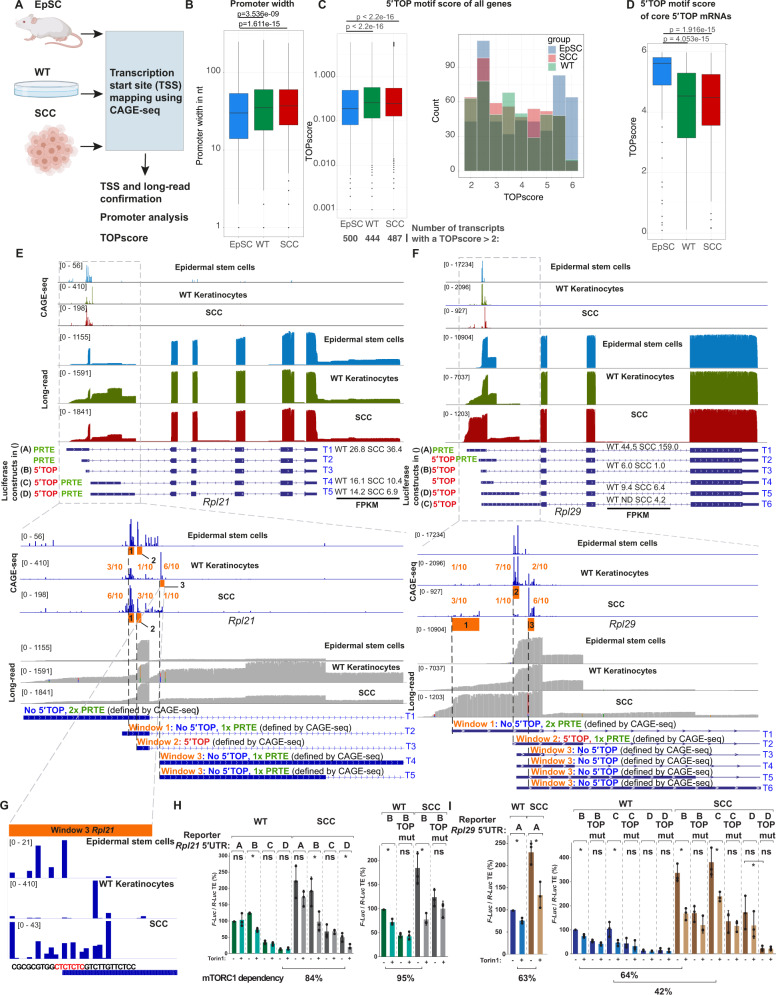
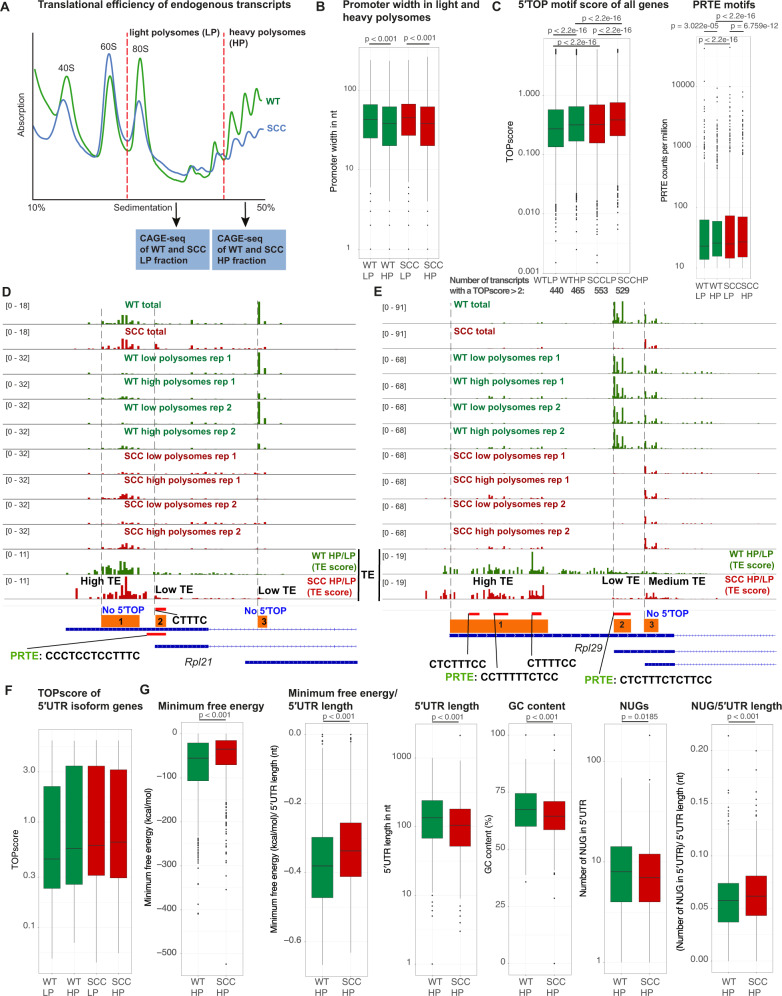
Transcriptional and translational control are key determinants of gene expression, however, to what extent these two processes can be collectively coordinated is still poorly understood. Here, we use Nanopore long-read sequencing and cap analysis of gene expression (CAGE-seq) to document the landscape of 5' and 3' untranslated region (UTR) isoforms and transcription start sites of epidermal stem cells, wild-type keratinocytes and squamous cell carcinomas. Focusing on squamous cell carcinomas, we show that a small cohort of genes with alternative 5'UTR isoforms exhibit overall increased translational efficiencies and are enriched in ribosomal proteins and splicing factors. By combining polysome fractionations and CAGE-seq, we further characterize two of these UTR isoform genes with identical coding sequences and demonstrate that the underlying transcription start site heterogeneity frequently results in 5' terminal oligopyrimidine (TOP) and pyrimidine-rich translational element (PRTE) motif switches to drive mTORC1-dependent translation of the mRNA. Genome-wide, we show that highly translated squamous cell carcinoma transcripts switch towards increased use of 5'TOP and PRTE motifs, have generally shorter 5'UTRs and expose decreased RNA secondary structures. Notably, we found that the two 5'TOP motif-containing, but not the TOP-less, RPL21 transcript isoforms strongly correlated with overall survival in human head and neck squamous cell carcinoma patients. Our findings warrant isoform-specific analyses in human cancer datasets and suggest that switching between 5'UTR isoforms is an elegant and simple way to alter protein synthesis rates, set their sensitivity to the mTORC1-dependent nutrient-sensing pathway and direct the translational potential of an mRNA by the precise 5'UTR sequence.


Conflict of interest statement

The authors declare no competing interests.

Figures

Fig. 1
Fig. 1. Nanopore long-read sequencing identifies alternative mRNA isoforms in the mouse skin.
A Experimental outline for the isolation of SCA-1+ epidermal stem cells (EpSC), wild-type keratinocytes (WT) and cultured squamous cell carcinoma cells (SCCc) used for Nanopore long-read sequencing. B Read length distribution for the Nanopore long-read sequencing data set of epidermal stem cells (EpSC), wild-type keratinocytes (WT), and squamous cell carcinomas (SCCc). The mean read length was between 943-1035 bp (EpSC: 943 bp, WT: 1035 bp, SCCc: 994 bp). C Bioinformatic pipeline for the processing of the Nanopore long-read sequencing data to identify and quantify alternative isoforms in epidermal stem cells and squamous cell carcinoma cells. Nanopore long-reads were mapped and a StringTie transcriptome was built. Transcripts were then filtered by the SQANTI3 pipeline and a quality control report was created (M&Ms). As an additional filtering step, transcripts were confirmed by CAGE-seq transcription start sites (TSSes) to build a curated transcriptome. Based on the transcriptome annotation and the short-read RNA sequencing data, SplAdder was used for the identification and quantification of alternative splicing events. D Quantification and categorization of the total transcript numbers identified by StringTie using the Nanopore long-read sequencing data of SCA-1+ epidermal stem cells (EpSCs), wild-type keratinocytes, and squamous cell carcinomas (SCCc) before filtering by SQANTI3 and CAGE-seq. Right panel shows examples for the different categories as defined by StringTie for transcript identifications, and the left panel shows the respective numbers. E Numbers and categories of significantly changed splicing events in epidermal stem cells (EpSC) and squamous cell carcinomas (SCCc), compared to wild-type keratinocytes, as identified by the SplAdder pipeline. F, G The landscape of alternative isoforms in squamous cell carcinoma cells or epidermal stem cells compared to wild-type keratinocytes using SplAdder, which quantifies and tests alternative splicing events. Color-coded are alternative 5′ splicing, 3′ splicing, intron retention and exon skipping events. The x-axis shows the alternatively spliced isoforms as a percentage of total gene expression, the y-axis shows the fold change of the alternative event. H Volcano plot showing the significant alternative splicing events and fold changes of splicing events in squamous cell carcinoma cells (SCCc) compared to wild-type keratinocytes (WT). Red indicates a significant >2× fold change in alternative splicing events. I Gene expression (GO:0010467) is the top gene ontology (GO) term for alternatively spliced genes in squamous cell carcinomas (SCCc) and is mainly driven by ribosomal proteins and splicing factors. GO term analysis shows the top 20 GO term hits (alphabetically ordered) with their false discovery rate (FDR, blue tone) and overlap with the GO term gene list in numbers (size of circle) and the fraction (x-axis).
Fig. 2
Fig. 2. Genes with alternative 5′UTR isoforms show increased translational efficiencies in squamous cell carcinomas.
A Localization of ribosomal proteins on the human 80S ribosome with significantly changed alternative splicing events of their encoding mRNAs in squamous cell carcinomas. Note that RPLP0 and RPLP2 were not included in the structure. B STRING interaction network analysis for the alternatively spliced genes in the GO term gene expression (GO:0010467) in squamous cell carcinomas compared to wild-type keratinocytes. C The translational efficiency of genes with differential alternative splicing events in the 5′UTR is increased in squamous cell carcinomas (SCCc). Fold change in translation efficiency (TE) was computed for all genes or genes with significant alternative splicing events in the 5′UTR, coding sequence (CDS) or 3′UTR. Translation efficiency (ribosome profiling reads divided by RNA-seq reads) was computed using the LRT-test of the DESeq2 package. P-values indicate a two-sample Kolmogorov–Smirnov test comparing the TE distribution of genes with alternative splicing events to all genes. D Numbers and splicing categories of significantly changed alternative splicing events in squamous cell carcinomas (SCCc) that alter either the 5′UTR, the coding sequence (CDS) or the 3′UTR. SS splice sites. E Most genes with differential 5′UTR isoforms in squamous cell carcinomas (SCCc) express a set of transcripts that contain or exclude TOP motifs. StringTie transcripts of the 5′UTR isoforms and their 5′UTR sequences were assessed for the presence of TOP motifs as defined by a C at the +1 position and an unbroken series of 4–16 pyrimidines. Left panel shows the different 5′UTR isoform genes, while the colors indicate the fraction of StringTie transcripts that contain a 5′TOP motif between 0 and 1 (0 and 100%). Right panel, number of isoforms within the cohort of genes with 5′UTR isoforms in SCCc that either contains a 5′TOP or do not contain a TOP motif. The color refers to the genes within the cohort of 5′UTR isoforms defined on the right side.
Fig. 3
Fig. 3. 5′UTR isoform switches in Rpl21 and Rpl29 increase their translational efficiency in squamous cell carcinomas.
A Outline of the cap analysis of gene expression (CAGE-seq) strategy to map transcription start sites (TSS) in SCA-1+ epidermal stem cells (EpSC), wild-type keratinocytes (WT) and cultured squamous cell carcinoma cells (SCCc). B Promoter width is genome-wide increased in WT and SCCc. Promoter width was computed using the CAGEr pipeline. P-values indicate a Wilcoxon test comparing the different promoter widths. C WT and SCCc have a higher median TOP score but fewer transcripts with a TOP score >2. TOP scores were calculated using our CAGE-seq data and the previously reported TOP score script [10]. Left panel shows the overall distribution and the total number of transcripts with TOP scores above 2 (below). Right panel displays the distribution of the transcripts with TOP scores above 2. Only genes with an average of >500 reads in the CAGE-seq dataset were included. P-values indicate a Wilcoxon test comparing the TOP score distributions. D TOP scores for the 97 core 5′TOP mRNAs in SCA-1+ epidermal stem cells (EpSC), wild-type keratinocytes (WT) and cultured squamous cell carcinoma cells (SCCc). P-values indicate a Wilcoxon test comparing the different TOP score distributions. E, F Representation of the Nanopore long-read and CAGE-seq data set for the two ribosomal genes Rpl21 and Rpl29 and their transcript annotation. Red 5′TOP indicates a transcript containing a 5′ terminal oligopyrimidine motif, defined by a C at position +1 and an unbroken series of 4–16 pyrimidines. PRTE: pyrimidine-rich translational element, as defined by a stretch of 9 consecutive pyrimidines and an invariant uridine at position 6 in the 5′UTR. The letter next to the different transcripts refers to the luciferase constructs tested in H and I. Lower panels: orange windows indicate the major TSS regions in the EpSC, WT and SCCc. The fractions indicate the distribution of WT and SCCc CAGE-seq reads in these three windows. The 5′TOP, no 5′TOP or PRTE labeling refers to the major CAGE peaks and not the annotated transcript, as further exemplified in G. FPKM: fragments per kilobase million, as quantified in the long-read sequencing data. G CAGE-seq read distribution within window 3 of Rpl21. Even though the annotated transcript starts with a 5′TOP motif, WT keratinocytes exhibit a major TSS that begins only 8 nucleotides downstream of the annotated transcript and does not include a 5′TOP motif. H, I The different Rpl21 and Rpl29 5′UTR isoforms show a wide range of translational efficiencies. Wild-type (WT) or squamous cell carcinomas (SCCc) were transfected with an Rpl21 or Rpl29 5′UTR::Firefly-luciferase and a control 5′UTR::Renilla-luciferase plasmid and treated for 3 h with 500 nM of the mTORC1 inhibitor Torin 1 (+) or DMSO (−) before harvesting. The labeling refers to the transcript isoform labeling in E, F, upper panels. First construct in WT was set to 100%. TOP mut indicates that the entire 5′TOP motif in the respective construct was mutated. Data represent the average of 3 independent experiments ±s.d. Asterisks indicate a p-value <0.05 using an ANOVA test. mTORC1 dependency was calculated as follows: (SCC no Torin 1 - SCC Torin 1)/(SCC no Torin 1 - WT Torin 1).
Fig. 4
Fig. 4. Squamous cell carcinomas express 5′UTR isoforms with high translational potential.
A Outline of the combined polysome profiling and cap analysis of gene expression (CAGE-seq) strategy to map transcription start sites (TSS) in wild-type keratinocytes (WT) and cultured squamous cell carcinoma cells (SCCc). WT and SCCc lysates were subjected to sucrose density gradient fractionations and light polysome (LP) and heavy polysome (HP) fractions were collected. RNA from the LP and HP fractions was isolated and CAGE libraries were prepared. Data represent the average of 2 independent experiments. B Promoter width is decreased in heavy polysome fractions in both WT and SCCc. C SCCc transcripts have higher median TOP and PRTE scores in both the light and the heavy polysome fractions. In addition, SCCc have a higher number of transcripts with a TOP score >2 (total transcript numbers below the graph). TOP scores were calculated using WT and SCCc LP and HP CAGE-seq data and the previously reported TOP score script [10]. PRTE scores were determined by searching for PRTE motifs in WT and SCCc LP and HP CAGE-seq data, normalized by the total number of reads. Median PRTE scores were 22.9 (WT LP), 25.8 (WT HP), 24.9 (SCCc LP) and 26.9 (SCCc HP). PRTE-containing 5′UTRs were defined by a PRTE score >10. PRTE: pyrimidine-rich translational element, defined by a stretch of 9 consecutive pyrimidines and an invariant uridine at position 6 in the 5′UTR. Data represent the average of 2 independent CAGE-seq experiments. P-values indicate a Wilcoxon test comparing the TOP score distributions or PRTE scores. D, E CAGE-seq peaks of total, light and heavy polysome fractions in the main three WT and SCCc TSS windows. Data were normalized and group-autoscaled to directly compare parallel CAGE-seq experiments. The last two rows display the ratios of HP/LP in WT and SCCc as a proxy for translational efficiency of the corresponding TSS. Regions were subdivided into low (ratio < 1), middle (ratio 1–3) and high TE (ratio > 3). Red bars indicate potential 5′TOP TSS with the corresponding sequence or a PRTE. PRTE: pyrimidine-rich translational element, defined by a stretch of 9 consecutive pyrimidines and an invariant uridine at position 6 in the 5′UTR. F TOP scores of light and heavy polysome fractions for the cohort of 5′UTR isoforms. G Heavy polysome 5′UTRs in SCCc are less structured and show fewer potential upstream open reading frames. WT and SCCc HP CAGE transcription start sites (ctss) were grouped into tag cluster promoter regions and directly compared using DESeq2. For the significantly up- and downregulated SCCc clusters, corresponding 5′UTRs isoforms were subsequently extracted. Upregulated 5′UTRs in SCCc and WT were compared for the minimum free energy, length, GC content and potential 5′UTR uORF initiation sites (NUGs). P-values indicate a Wilcoxon test.
Fig. 5
Fig. 5. The 5′TOP motif-containing, but not the TOP-less, RPL21 isoforms correlate with overall survival in head and neck squamous cell carcinoma (HNSCC) patients.
A Increased RPL21 mRNA levels correlate with shorter overall survival of human head and neck squamous cell carcinoma (HNSCC) patients. RPL21 top and bottom quartile mRNA expression in TCGA HNSCC patients′ samples (n = 519). Cox regression hazard ratio 1.4629. B Increased RPL21 TOP motif-containing transcripts 201 and 202, but not the TOP-less transcript 203, correlate with shorter overall survival of head and neck squamous cell carcinoma (HNSCC) patients. RPL21 top and bottom quartile transcript expression in TCGA HNSCC patients′ samples (n = 519). The 4 main human RPL21 isoforms are depicted in the upper panel, all isoforms code for the identical 160 amino acid RPL21 protein. Two transcripts contain a classic 5′TOP motif (red), one contains a TOP-like motif (blue) and one transcript does not express a 5′TOP motif. C mRNA expression levels of the differentially spliced translation-related genes in TCGA head and neck squamous cell carcinoma (HNSCC) patients′ samples (n = 519) and non-diseased esophageal tissue (non-diseased pharynx samples were not available). D Alternative splicing events significantly stratify head and neck squamous cell carcinoma patient survival. The alternative splicing events between the two transcripts correlating with survival, RPL21-201 and RPL21-204, and the transcript that did not correlate with survival (RPL21-203) were directly compared in head and neck squamous cell carcinoma patients′ samples (n = 519). The ratio between the alternative splicing events was calculated and the overall survival of the top and bottom quartile alternative splicing events was assessed.

References

    1. Chen J, Tresenrider A, Chia M, McSwiggen DT, Spedale G, Jorgensen V, et al. Kinetochore inactivation by expression of a repressive mRNA. Elife. 2017;6. 10.7554/eLife.27417. - PMC - PubMed
    1. Cheng Z, Otto GM, Powers EN, Keskin A, Mertins P, Carr SA, et al. Pervasive, coordinated protein-level changes driven by transcript isoform switching during meiosis. Cell. 2018. 10.1016/j.cell.2018.01.035. - PMC - PubMed
    1. Tresenrider A, Morse K, Jorgensen V, Chia M, Liao H, van Werven FJ, et al. Integrated genomic analysis reveals key features of long undecoded transcript isoform-based gene repression. Mol Cell. 2021;81:2231–45.e11. doi: 10.1016/j.molcel.2021.03.013. - DOI - PMC - PubMed
    1. Hollerer I, Barker JC, Jorgensen V, Tresenrider A, Dugast-Darzacq C, Chan LY, et al. Evidence for an integrated gene repression mechanism based on mRNA isoform toggling in human cells. G3 Genes Genomes Genet. 2019;9:1045–53. - PMC - PubMed
    1. Hinnebusch AG, Ivanov IP, Sonenberg N. Translational control by 5′-untranslated regions of eukaryotic mRNAs. Science. 2016. 10.1126/science.aad9868. - PMC - PubMed

Publication types