. 2022 Dec 22;12(1):22175.
doi: 10.1038/s41598-022-26709-7.

Plasmodium infection is associated with cross-reactive antibodies to carbohydrate epitopes on the SARS-CoV-2 Spike protein

Sarah Lapidus  1 Feimei Liu  2 Arnau Casanovas-Massana  1 Yile Dai  2 John D Huck  2 Carolina Lucas  2 Jon Klein  2 Renata B Filler  2   3 Madison S Strine  2   3 Mouhamad Sy  1   4 Awa B Deme  1   4 Aida S Badiane  4 Baba Dieye  4 Ibrahima Mbaye Ndiaye  4 Younous Diedhiou  4 Amadou Moctar Mbaye  4 Cheikh Tidiane Diagne  5 Inés Vigan-Womas  6 Alassane Mbengue  7 Bacary D Sadio  8 Moussa M Diagne  8 Adam J Moore  1 Khadidiatou Mangou  7 Fatoumata Diallo  7 Seynabou D Sene  7 Mariama N Pouye  7 Rokhaya Faye  6 Babacar Diouf  6 Nivison Nery Jr  9   10 Federico Costa  1   9   11 Mitermayer G Reis  1   11   12 M Catherine Muenker  1 Daniel Z Hodson  1 Yannick Mbarga  13 Ben Z Katz  14 Jason R Andrews  15 Melissa Campbell  16 Ariktha Srivathsan  1 Kathy Kamath  17 Elisabeth Baum-Jones  17 Ousmane Faye  8 Amadou Alpha Sall  8 Juan Carlos Quintero Vélez  1   18   19 Michael Cappello  1   20 Michael Wilson  21 Choukri Ben-Mamoun  22 Richard Tedder  23   24 Myra McClure  23 Peter Cherepanov  23   25   26 Fabrice A Somé  27 Roch K Dabiré  27 Carole Else Eboumbou Moukoko  28   29 Jean Bosco Ouédraogo  27 Yap Boum 2nd  30 John Shon  17 Daouda Ndiaye  4 Adam Wisnewski  10 Sunil Parikh  1 Akiko Iwasaki  1   2   31 Craig B Wilen  2 Albert I Ko  1   11 Aaron M Ring  2 Amy K Bei  32   33   34
Affiliations

Plasmodium infection is associated with cross-reactive antibodies to carbohydrate epitopes on the SARS-CoV-2 Spike protein

Sarah Lapidus et al. Sci Rep. .

Abstract

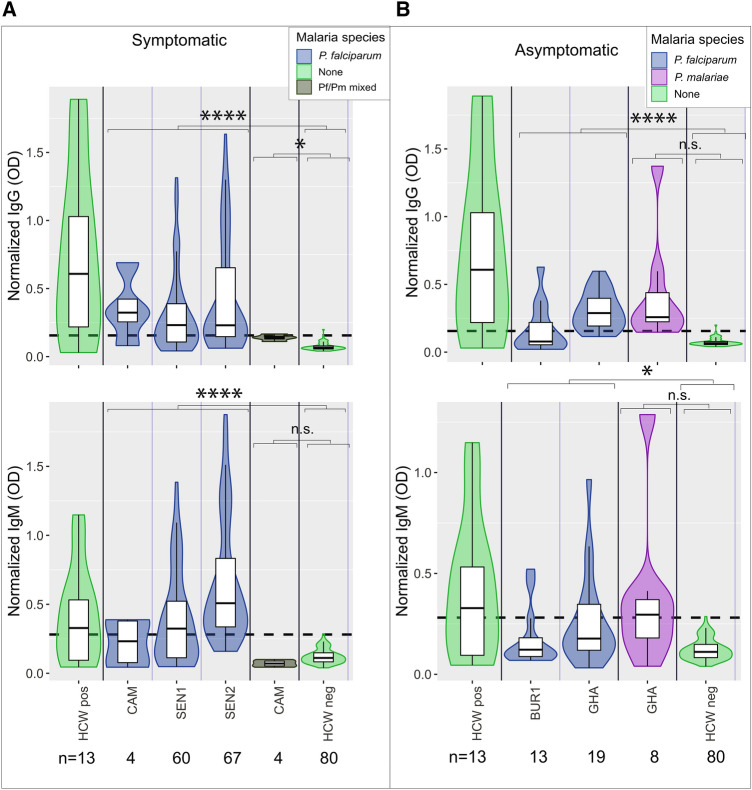
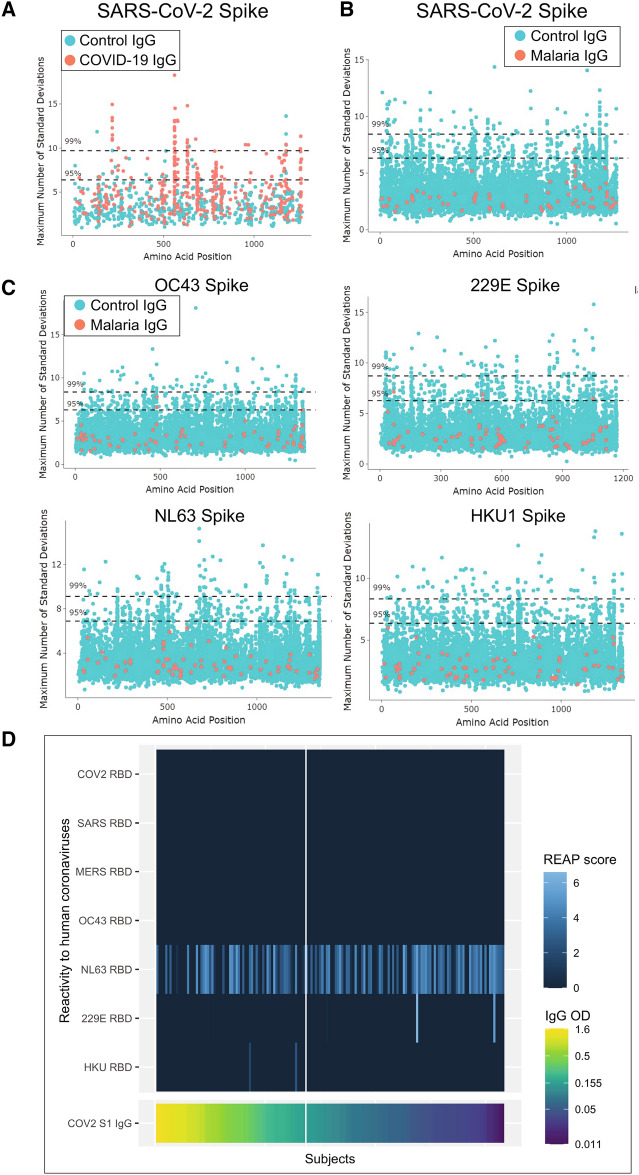
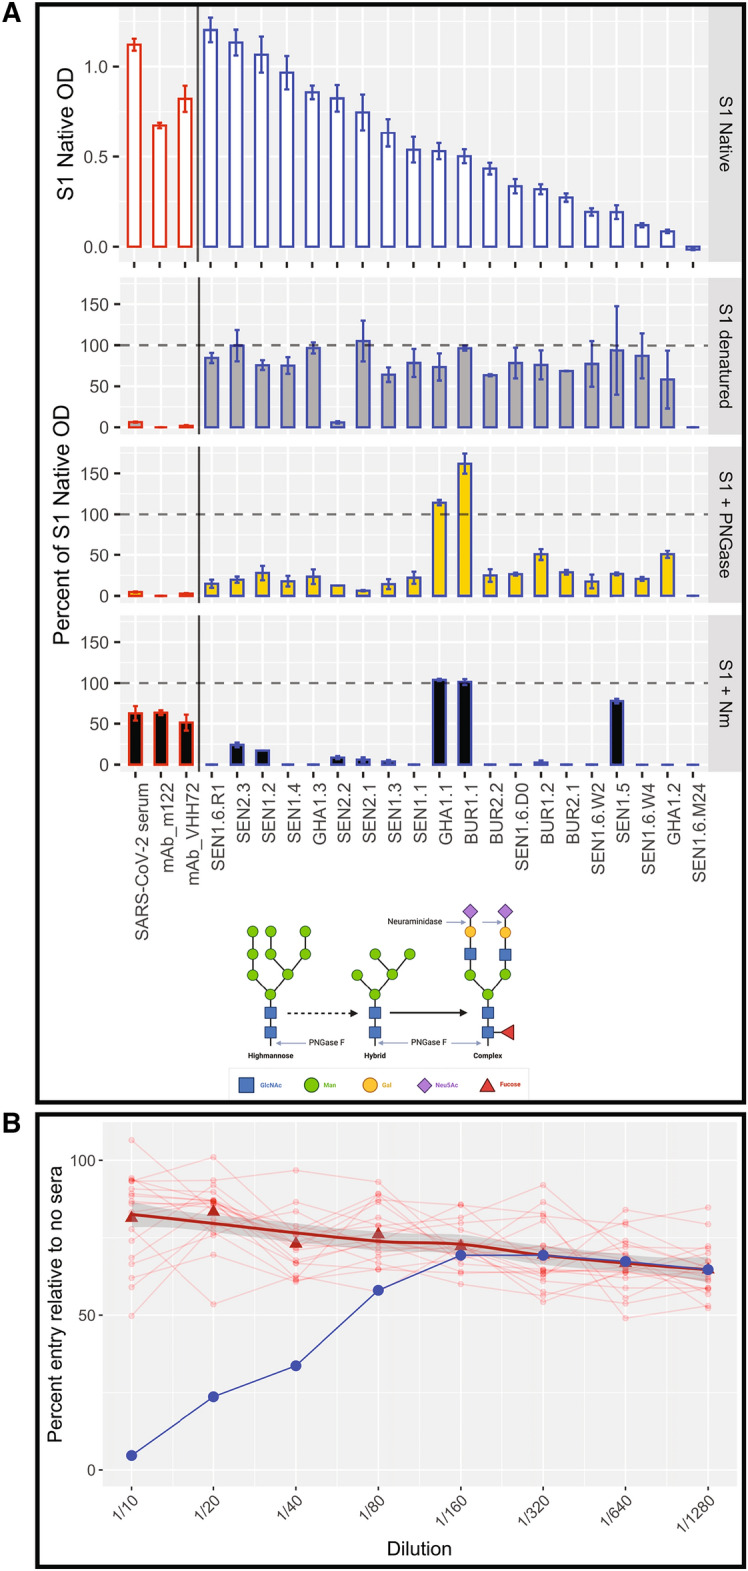
Sero-surveillance can monitor and project disease burden and risk. However, SARS-CoV-2 antibody test results can produce false positive results, limiting their efficacy as a sero-surveillance tool. False positive SARS-CoV-2 antibody results are associated with malaria exposure, and understanding this association is essential to interpret sero-surveillance results from malaria-endemic countries. Here, pre-pandemic samples from eight malaria endemic and non-endemic countries and four continents were tested by ELISA to measure SARS-CoV-2 Spike S1 subunit reactivity. Individuals with acute malaria infection generated substantial SARS-CoV-2 reactivity. Cross-reactivity was not associated with reactivity to other human coronaviruses or other SARS-CoV-2 proteins, as measured by peptide and protein arrays. ELISAs with deglycosylated and desialated Spike S1 subunits revealed that cross-reactive antibodies target sialic acid on N-linked glycans of the Spike protein. The functional activity of cross-reactive antibodies measured by neutralization assays showed that cross-reactive antibodies did not neutralize SARS-CoV-2 in vitro. Since routine use of glycosylated or sialated assays could result in false positive SARS-CoV-2 antibody results in malaria endemic regions, which could overestimate exposure and population-level immunity, we explored methods to increase specificity by reducing cross-reactivity. Overestimating population-level exposure to SARS-CoV-2 could lead to underestimates of risk of continued COVID-19 transmission in sub-Saharan Africa.


Conflict of interest statement

A.M.R. and Y.D. (Yale University) are named inventors on a patent application describing the REAP technology. A.M.R. is the founder of Seranova Bio. C.B.W. (Yale University)has a patent pending entitled “Compounds and Compositions for Treating, Ameliorating, and/or Preventing SARS-CoV-2 Infection and/or Complications Thereof". KK, EBJ, and JS receive salary and hold stock options from Serimmune Inc.

Figures

Figure 1
Figure 1
High frequency of cross-reactive antibodies to SARS-CoV-2 Spike protein from Plasmodium-infected individuals. In (A,B), Violin plots showing normalized IgG and IgM responses among subjects from different cohorts. ****p < 0.0001, ***p < 0.001, **p < 0.01, *p < 0.05, n.s. not significant. (B) Subjects with acute malaria infection (symptomatic and asymptomatic) had significantly higher IgG and IgM than uninfected subjects living in malaria endemic areas (t-test p value < 0.0001 for both log IgG and log IgM). IgM but not IgG cross-reactivity was also significantly higher among uninfected individuals living in malaria endemic settings with previous exposure compared to individuals in non-endemic settings (t-test log IgG p value = 0.367 and log IgM p value < 0.0001). (B) Of malaria positive subjects, 163 had P. falciparum mono-infection (107 IgG positive and 98 IgM positive), 8 had P. malariae mono-infection (6 IgG positive and 4 IgM positive), 6 had P. falciparum/P. malariae mixed infections (3 IgG positive and 0 IgM positive), and 1 had P. vivax mono-infection (0 IgG or IgM positive). Log normalized IgG was significantly higher among subjects with P. falciparum, P. malariae, and mixed infections than among negative controls (t-test p value < 0.0001 for log P. falciparum, p value = 0.002 for P. malariae and p value = 0.013 for mixed infections), and normalized IgM was significantly higher among subjects with P. falciparum but not P. malariae or mixed infections than among negative controls (t-test p value < 0.0001 for P. falciparum, p value = 0.222 for P. malariae and p value = 1 for mixed infections). Normalized IgG and IgM was not significantly different between subjects with P. falciparum and P. malariae (t-test p value = 1 for IgG and p value = 1 for IgM). (C) Normalized IgG and IgM over time in 21 subjects with P. falciparum mono-infection on Day 0. Both IgG and IgM peaked between Day 0 and Week 4 for all subjects. Reinfection, confirmed by rapid diagnostic test and microscopy and shown by red circles, boosted IgG response in 1 of 4 subjects and IgM response in 2 of 4 subjects. Bold trend line based on local regression (LOESS). In (AC), normalized IgG or IgM calculated by IgG or IgM OD divided by IgG or IgM of positive control (camelid monoclonal chimeric nanobody VHH72 antibody was IgG control, and pooled SARS-CoV-2 convalescent serum was IgM control). Samples were run in singlicate, duplicate or triplicate as sample volume allowed. Black dashed lines represent cutoffs for positivity, calculated from normalized IgG and IgM values from 80 RT-qPCR negative healthcare workers (HCWs) (mean + 3 SDs).
Figure 2
Figure 2
S1 subunit Spike cross-reactivity differs by age. Violin plots showing normalized IgG and IgM responses among subjects living in (A) endemic countries (including those with and without acute malaria infection) and (B) non-endemic countries. Age is divided by quartiles representing under 9 years, 9–18 years, 18–32.5 years, and 32.5 years and older. Top plots show normalized IgG and bottom plots show normalized IgM. Normalized IgG or IgM calculated by IgG or IgM OD divided by IgG or IgM of positive control (camelid monoclonal chimeric nanobody VHH72 antibody was IgG control, and pooled SARS-CoV-2 convalescent serum was IgM control). Black dashed lines represent cutoffs for positivity, calculated from normalized IgG and IgM values from 80 RT-qPCR negative HCWs (mean + 3 SDs). ****p < 0.0001, ***p < 0.001, **p < 0.01, *p < 0.05, n.s. not significant.
Figure 3
Figure 3
Plasmodium falciparum and P. malariae is associated with S1 subunit Spike cross-reactivity in symptomatic and asymptomatic subjects. Violin plots showing normalized IgG and IgM responses among (a) symptomatic and (b) asymptomatic subjects by species of malaria infection. For symptomatic subjects, both IgG and IgM were significantly higher among subjects with P. falciparum than healthy US HCW controls (unequal variances t-tests p values < 0.0001 for both IgG and IgM). Subjects with symptomatic P. falciparum/P. malariae mixed infections had significantly higher log IgG but not IgM than healthy US HCW controls (unequal variances t-tests p values = 0.0013 for IgG and p value = 0.222 for IgM). For asymptomatic subjects, both log IgG and IgM were significantly higher among subjects with P. falciparum than healthy US HCWs controls (unequal variances t-tests IgG p value < 0.0001 and IgM p value = 0.016). Asymptomatic subjects with P. malariae had significantly higher log IgG but not log IgM than healthy US HCWs controls (unequal variances t-tests IgG p values = 0.002 and IgM p value = 0.222). Normalized IgG or IgM was calculated by IgG or IgM OD divided by IgG or IgM of positive control (camelid monoclonal chimeric nanobody VHH72 antibody was IgG control, and pooled convalescent serum from SARS-CoV-2 patients was IgM control). Black dashed lines represent cutoffs for positivity, calculated from normalized IgG and IgM values from 80 RT-qPCR negative HCWs (mean + 3 SDs). ****p < 0.0001, ***p < 0.001, **p < 0.01, *p < 0.05, n.s. not significant.
Figure 4
Figure 4
Cross-reactive IgG is not associated with reactivity to SARS-CoV-2 or other coronavirus peptides or RBD proteins. PIWAS plots displaying the maximum k-mer enrichment for each subject across the entire SARS-CoV-2 Spike protein, with conserved peaks representing reactivity to conserved epitopes. (A) Positive control demonstrating IgG COVID-19 cases (red) and COVID-negative controls (blue). (B,C) PIWAS k-mer enrichments for IgG from acute malaria cases (shown in red in B,C) on the four common coronavirus proteomes compared to 8243 pre-pandemic controls (shown in blue). The Y-axis represents the standard deviation calculated from the control values. The maximum k-mer peak for each individual is shown. Dashed lines represent significance levels of 95% and 99%. (D) Cross-reactivity to other human coronaviruses assessed by yeast expressed exported protein array (REAP) is only observed for NL63 and did not differ between S1 positive and S1 negative subjects (S1 positives on the left side of the vertical white line and S1 negatives on the right side). REAP score cut-off of 1.5 is considered a positive response. IgG to S1 from subjects are ordered by descending normalized OD (shown in bottom plot).
Figure 5
Figure 5
Cross-reactive IgG targets sialic acid on N-linked glycans and is not neutralizing. (A) S1 protein was subjected to three conditions to modify the structure: denaturing; treating with PNGase F to remove all N-linked glycans; and treating with neuraminidase to remove sialic acid. ELISA was performed on samples with each protein condition, and the percent of S1 Native OD under each condition is shown for 3 controls (pooled convalescent serum from SARS-CoV-2 patients, mouse monoclonal SARS-CoV-2 Spike M122 antibody, and camelid monoclonal SARS-CoV-2 Spike chimeric nanobody VHH72 antibody, all outlined in red) and 20 subjects (shown individually and each outlined in black). Neuraminidase treatment decreased samples to 23.0% (95% CI 1.1, 44.9) of OD of S1 native, significantly more than the reduction of SARS-CoV-2 convalescent serum (decreased to 63% of OD of S1 native), suggesting cross-reactivity was due to reactions with terminal sialic from glycosylated sites. Subjects are ordered by descending normalized OD IgG (shown in top plot). (B) In a neutralizing assay using pseudotyped viruses (VSV-Renilla luciferase pseudotyped with Spike), 20 samples (red circles) with high S1 Spike IgG ELISA reactivity showed no neutralization. Bold trend line based on local regression (LOESS) of samples. Control (serum from a COVID-19 positive inpatient, in blue) shows neutralization at dilutions of 1/40 and less.
Figure 6
Figure 6
Neuraminidase, urea and Hybrid DABA reduce cross-reactivity in malaria samples. The S1 subunit ELISA was performed on 20 COVID-19 positive samples and 20 malaria positive samples in two alternative ways to increase its specificity. The S1 protein was first treated with neuraminidase to remove sialic acid and then the S1 subunit ELISA was performed with a wash of 4 M urea to reduce non-specific binding (performed in duplicate for samples and quadruplicate for controls, error bars show minimum and maximum values). The percent of S1 Native OD under each condition is shown for 3 controls (pooled convalescent serum from SARS-CoV-2 patients, mouse monoclonal SARS-CoV-2 Spike M122 antibody, and camelid monoclonal SARS-CoV-2 Spike chimeric nanobody VHH72 antibody, all outlined in red), 20 COVID-19 positive samples (shown individually and each outlined in green), and 20 malaria positive samples (shown individually and each outlined in blue). The urea wash decreased the IgG of malaria samples to 38.2% of S1 native, a significantly greater decrease than that of COVID-19 samples (73.8% of S1 native, t-test p value < 0.0001). Similarly, treating the S1 protein with neuraminidase reduced the IgG of malaria samples significantly more than reduction in COVID-19 samples (64.6% vs. 86.0% of S1 ELISA IgG values, t-test p value = 0.006). Subjects are ordered by descending normalized OD IgG (shown in top plot), with dashed line indicating cutoff for positivity. (B) Scatterplots showing values of S1 subunit ELISA vs. S1 subunit ELISA with 4 M urea wash and Hybrid DABA, two methods of increasing specificity for antibody reactivity. Three positive controls (pooled convalescent serum from SARS-CoV-2 patients, mouse monoclonal SARS-CoV-2 Spike M122 antibody, and camelid monoclonal SARS-CoV-2 Spike chimeric nanobody VHH72 antibody, in red), twenty COVID-19 positive samples (in green) and 20 malaria positive samples (in blue) were tested. For S1 ELISA, dashed lines represent cutoffs for positivity, and for DABA, lower and upper dashed lines represent cutoff for negativity and positivity, respectively (values between lines are equivocal). The 20 COVID-19 positive samples tested positive by both S1 subunit ELISA with and without urea wash. Of 20 malaria positive samples, 12 (60%) tested positive by S1 subunit ELISA, and 5 (25%) by S1 subunit ELISA with a 4 M urea wash (Fisher’s exact test p value = 0.243 for COVID-19 and malaria samples by S1 subunit ELISA with and without a urea wash). Twenty of 20 COVID-19 positive samples tested by Hybrid DABA tested positive, while only 1 (5%) of 20 malaria positive samples tested positive (12 of the 20 had tested positive by S1 subunit ELISA). The Hybrid DABA was significantly more effective at reducing cross-reactive positivity among malaria samples (Fisher’s exact test p value = 0.008).

Update of

  • Plasmodium infection induces cross-reactive antibodies to carbohydrate epitopes on the SARS-CoV-2 Spike protein.
    Lapidus S, Liu F, Casanovas-Massana A, Dai Y, Huck JD, Lucas C, Klein J, Filler RB, Strine MS, Sy M, Deme AB, Badiane AS, Dieye B, Ndiaye IM, Diedhiou Y, Mbaye AM, Diagne CT, Vigan-Womas I, Mbengue A, Sadio BD, Diagne MM, Moore AJ, Mangou K, Diallo F, Sene SD, Pouye MN, Faye R, Diouf B, Nery N Jr, Costa F, Reis M, Muenker MC, Hodson DZ, Mbarga Y, Katz BZ, Andrews JR, Campbell M, Srivathsan A, Kamath K, Baum-Jones E, Faye O, Sall AA, Quintero Vélez JC, Cappello M, Wilson M, Ben-Mamoun C, Somé FA, Dabiré RK, Moukoko CEE, Ouédraogo JB, Boum Y 2nd, Shon J, Ndiaye D, Wisnewski A, Parikh S, Iwasaki A, Wilen CB, Ko AI, Ring AM, Bei AK. Lapidus S, et al. medRxiv [Preprint]. 2021 May 12:2021.05.10.21256855. doi: 10.1101/2021.05.10.21256855. medRxiv. 2021. Update in: Sci Rep. 2022 Dec 22;12(1):22175. doi: 10.1038/s41598-022-26709-7. PMID: 34013301 Free PMC article. Updated. Preprint.

References

    1. Liu W, et al. Evaluation of nucleocapsid and spike protein-based enzyme-linked immunosorbent assays for detecting antibodies against SARS-CoV-2. J. Clin. Microbiol. 2020;58:e00461–20. doi: 10.1128/JCM.00461-20. - DOI - PMC - PubMed
    1. Uyoga S, et al. Seroprevalence of anti-SARS-CoV-2 IgG antibodies in Kenyan blood donors. Science. 2020;371(6524):79–82. doi: 10.1126/science.abe1916. - DOI - PMC - PubMed
    1. Chibwana MG, et al. High SARS-CoV-2 seroprevalence in health care workers but relatively low numbers of deaths in urban Malawi. Wellcome Open Res. 2020;5:199. doi: 10.12688/wellcomeopenres.16188.2. - DOI
    1. Olayanju O, et al. SARS-CoV-2 seropositivity in asymptomatic frontline health workers in Ibadan, Nigeria. Am. J. Trop. Med. Hyg. 2020;104(1):91–94. doi: 10.4269/ajtmh.20-1235. - DOI - PMC - PubMed
    1. Etyang AO, et al. Seroprevalence of antibodies to SARS-CoV-2 among health care workers in Kenya. Clin. Infect. Dis. 2021;74(2):288–293. doi: 10.1093/cid/ciab346. - DOI - PMC - PubMed

Publication types

LinkOut - more resources