. 2022 Dec 22;22(1):504.
doi: 10.1186/s12886-022-02732-0.

Morphometric analyses in patients treated with subthreshold laser photocoagulation for central serous chorioretinopathy

Affiliations

Morphometric analyses in patients treated with subthreshold laser photocoagulation for central serous chorioretinopathy

C Enders et al. BMC Ophthalmol. .

Abstract

Background and objective: To analyze changes in selected parameters in optical coherence tomography (OCT) after subthreshold laser coagulation (ST-LP) in patients with central serous chorioretinopathy (CSCR).

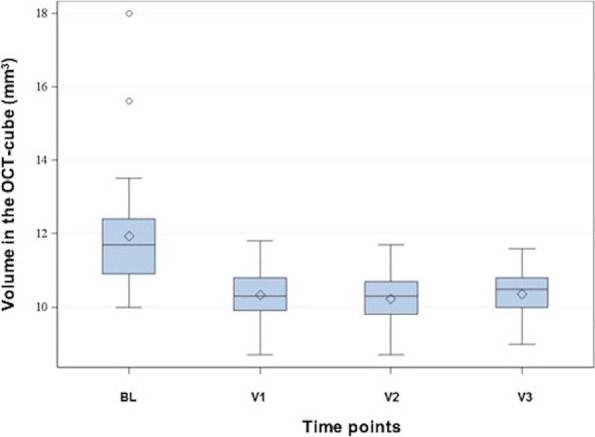
Materials and methods: Fifty-four eyes of 49 patients with CSCR were included in the study. Each patient underwent therapy with ST-LP with a frequency-doubled Neodym-YAG Laser and OCT imaging. In OCT the thickness of the central subfield, cube volume, average cube thickness, volume under the ETDRS grid, and average thickness under the ETDRS grid were collected.

Results: Decreases in total OCT volume and central retinal subfield thickness were statistically significant (p < 0.05). Possible correlations were observed between visual acuity at V3 (3 months after ST-LP) and Baseline and between central retinal subfield thickness at V1 (4 weeks after ST-LP) and visual acuity at BL.

Conclusion: A decrease in retinal thickness and retinal volume could be shown after ST-LP. Central retinal subfield thickness measured by OCT could be a more sensitive measure than mean retinal thickness or macular volume for early detection of disease recurrence occurring in some patients 3 months after ST-LP.

Keywords: Central serous chorioretinoparhy; optical coherence tomography; subthreshold lasercoagulation.


Conflict of interest statement

The authors have no competing interests.

Figures

Fig. 1
Fig. 1
Volume in the OCT cube at the different time points. The ordinate shows the volume of the entire OCT cube (mm3), the abscissa reveals the different time points. The diamond indicates the mean, the horizontal line the median of the volume. The gray box in the Tukey diagram marks the range of values from the first to the third quartile, the whiskers have a length of 2 times the interquartile range. Measured values outside of this are shown by means of a circle as outliers in the diagram. OCT: optical coherence tomography; BL: baseline; V: visit
Fig. 2
Fig. 2
Volume measured in OCT under the ETDRS grid at the different time points. On the ordinate is the volume under the ETDRS grid (mm3), the different times points are plotted on the abscissa. The diamond indicates the mean, and the horizontal line shows the median of the volume. The gray box in the Tukey diagram marks the range of values from the first to the third quartile, the whiskers have a length of 2 times the interquartile range. Measured values outside this range are shown as outliers in the diagram by means of a circle. ETDRS: early treatment diabetic retinopathy study; BL: baseline; V: visit
Fig. 3
Fig. 3
Average retinal thickness measured by OCT in the whole cube at the different time points. The ordinate shows the average thickness of the retina in the whole cube (µm), the abscissa demonstrates the different time points. The diamond indicates the mean, the horizontal line the median of the visual acuity. The gray box in the Tukey diagram marks the range of values from the first to the third quartile, the whiskers have a length of 2 times the interquartile range. Measured values outside of this range are shown as outliers in the diagram by means of a circle. BL: Baseline; V: Visit
Fig. 4
Fig. 4
Average retinal thickness under the ETDRS grid measured by OCT at the different time points. The ordinate shows the average thickness of the retina under the ETDRS grid (µm), the abscissa indicates the different time points. The gray box in the Tukey diagram marks the range of values from the first to the third quartile, the whiskers have a length of 2 times the interquartile range. Measured values outside this range are shown as outliers in the diagram by means of a circle. ETDRS: early treatment diabetic retinopathy study; BL: baseline; V: visit

References

    1. Manayath GJ, Ranjan R, Karandikar SS, Shah VS, Saravanan VR, Narendran V. Central serous chorioretinopathy: current update on management. Oman J Ophthalmol. 2018;11(3):200–206. doi: 10.4103/ojo.OJO_29_2018. - DOI - PMC - PubMed
    1. Spaide RF, Goldbaum M, Wong DW, Tang KC, Iida T. Serous detachment of the retina. Retina. 2003;23(6):820–46; quiz 895-6. doi: 10.1097/00006982-200312000-00013. - DOI - PubMed
    1. Sheth J, Anantharaman G, Chandra S, Sivaprasad S. "Double-layer sign" on spectral domain optical coherence tomography in pachychoroid spectrum disease. Indian J Ophthalmol. 2018;66(12):1796–1801. doi: 10.4103/ijo.IJO_377_18. - DOI - PMC - PubMed
    1. Nicholson B, Noble J, Forooghian F, Meyerle C. Central serous chorioretinopathy: update on pathophysiology and treatment. Surv Ophthalmol. 2013;58(2):103–26. doi: 10.1016/j.survophthal.2012.07.004. - DOI - PMC - PubMed
    1. Bousquet E, Provost J, Zola M, Spaide RF, Mehanna C, Behar-Cohen F. Mid-Phase Hyperfluorescent Plaques Seen on Indocyanine Green Angiography in Patients with Central Serous Chorioretinopathy. J Clin Med. 2021;10(19):4525. doi: 10.3390/jcm10194525. - DOI - PMC - PubMed

MeSH terms