

Effect of Hypoxia on Branching Characteristics and Cell Subpopulations during Kidney Organ Culture
- PMID: 36551007
- PMCID: PMC9774677
- DOI: 10.3390/bioengineering9120801
Effect of Hypoxia on Branching Characteristics and Cell Subpopulations during Kidney Organ Culture
Abstract
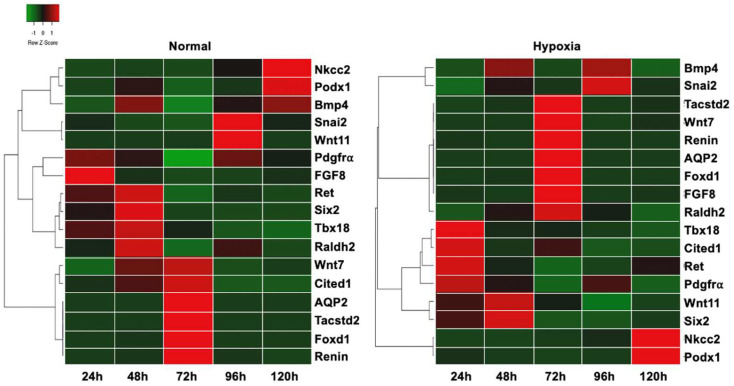
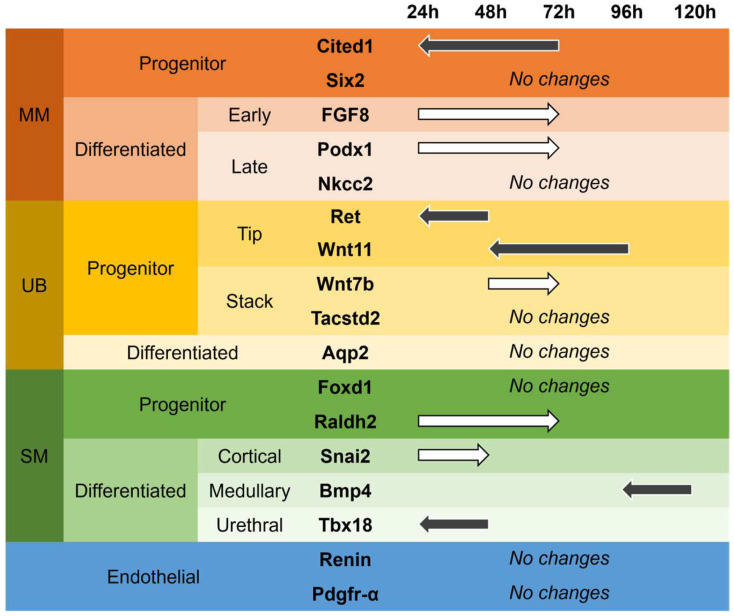
During early developmental stages, embryonic kidneys are not fully vascularized and are potentially exposed to hypoxic conditions, which is known to influence cell proliferation and survival, ureteric bud branching, and vascularization of the developing kidney. To optimize the culture conditions of in vitro cultured kidneys and gain further insight into the effect of hypoxia on kidney development, we exposed mouse embryonic kidneys isolated at E11.5, E12.5, and E13.5 to hypoxic and normal culture conditions and compared ureteric bud branching patterns, the growth of the progenitor subpopulation hoxb7+, and the expression patterns of progenitor and differentiation markers. Branching patterns were quantified using whole organ confocal imaging and gradient-vector-based analysis. In our model, hypoxia causes an earlier expression of UB tip cell markers, and a delay in stalk cell marker gene expression. The metanephric mesenchyme (MM) exhibited a later expression of differentiation marker FGF8, marking a delay in nephron formation. Hypoxia further delayed the expression of stroma cell progenitor markers, a delay in cortical differentiation markers, as well as an earlier expression of medullary and ureteral differentiation markers. We conclude that standard conditions do not apply universally and that tissue engineering strategies need to optimize suitable culture conditions for each application. We also conclude that adapting culture conditions to specific aspects of organ development in tissue engineering can help to improve individual stages of tissue generation.
Keywords: developmental biology; kidney; physiology; tissue engineering.
Conflict of interest statement
The authors declare no conflict of interest.
Figures


Similar articles
-
Constructing kidney-like tissues from cells based on programs for organ development: toward a method of in vitro tissue engineering of the kidney.Tissue Eng Part A. 2010 Aug;16(8):2441-55. doi: 10.1089/ten.TEA.2009.0548. Tissue Eng Part A. 2010. PMID: 20214453 Free PMC article.
-
Involvement of laminin binding integrins and laminin-5 in branching morphogenesis of the ureteric bud during kidney development.Dev Biol. 2001 Oct 15;238(2):289-302. doi: 10.1006/dbio.2001.0391. Dev Biol. 2001. PMID: 11784011
-
The effect of hyaluronic acid size and concentration on branching morphogenesis and tubule differentiation in developing kidney culture systems: potential applications to engineering of renal tissues.Biomaterials. 2007 Nov;28(32):4806-17. doi: 10.1016/j.biomaterials.2007.07.034. Epub 2007 Aug 15. Biomaterials. 2007. PMID: 17706761 Free PMC article.
-
Role of fibroblast growth factor receptor signaling in kidney development.Pediatr Nephrol. 2007 Mar;22(3):343-9. doi: 10.1007/s00467-006-0239-7. Epub 2006 Aug 24. Pediatr Nephrol. 2007. PMID: 16932896 Review.
-
Organ In Vitro Culture: What Have We Learned about Early Kidney Development?Stem Cells Int. 2015;2015:959807. doi: 10.1155/2015/959807. Epub 2015 May 19. Stem Cells Int. 2015. PMID: 26078765 Free PMC article. Review.
Cited by
-
Advances in Organoid Research and Developmental Engineering.Bioengineering (Basel). 2024 Dec 15;11(12):1275. doi: 10.3390/bioengineering11121275. Bioengineering (Basel). 2024. PMID: 39768093 Free PMC article.
References
LinkOut - more resources
Full Text Sources
