

Bare Eye Detection of Bacterial Enzymes of Pseudomonas aeruginosa with Polymer Modified Nanoporous Silicon Rugate Filters
- PMID: 36551031
- PMCID: PMC9776340
- DOI: 10.3390/bios12121064
Bare Eye Detection of Bacterial Enzymes of Pseudomonas aeruginosa with Polymer Modified Nanoporous Silicon Rugate Filters
Abstract
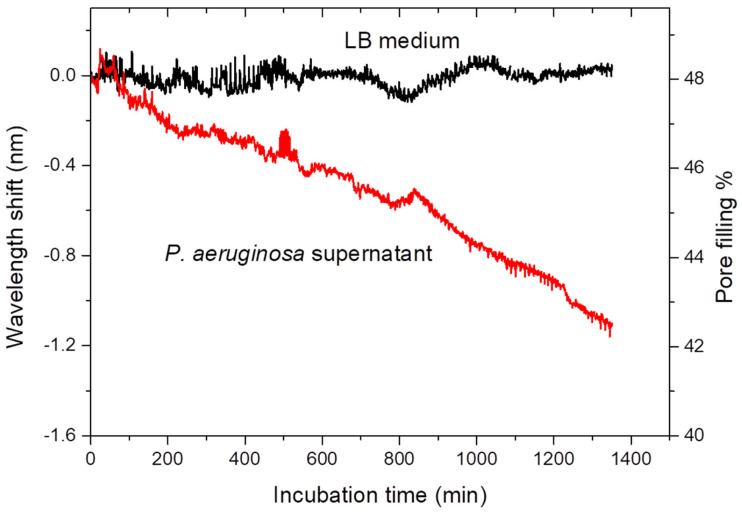
The fabrication, characterization and application of a nanoporous Silicon Rugate Filter (pSiRF) loaded with an enzymatically degradable polymer is reported as a bare eye detection optical sensor for enzymes of pathogenic bacteria, which is devoid of any dyes. The nanopores of pSiRF were filled with poly(lactic acid) (PLA), which, upon enzymatic degradation, resulted in a change in the effective refractive index of the pSiRF film, leading to a readily discernible color change of the sensor. The shifts in the characteristic fringe patterns before and after the enzymatic reaction were analyzed quantitatively by Reflectometric Interference Spectroscopy (RIfS) to estimate the apparent kinetics and its dependence on enzyme concentration. A clear color change from green to blue was observed by the bare eye after PLA degradation by proteinase K. Moreover, the color change was further confirmed in measurements in bacterial suspensions of the pathogen Pseudomonas aeruginosa (PAO1) as well as in situ in the corresponding bacterial supernatants. This study highlights the potential of the approach in point of care bacteria detection.
Keywords: Pseudomonas aeruginosa; bacteria detection; bacterial enzyme; biodegradable polymer; nanoporous silicon rugate filter; poly(lactic acid).
Conflict of interest statement
The authors declare no conflict of interest.
Figures


Similar articles
-
Reflectometric interference spectroscopy-based sensing for evaluating biodegradability of polymeric thin films.Acta Biomater. 2016 Jul 1;38:163-7. doi: 10.1016/j.actbio.2016.04.022. Epub 2016 Apr 20. Acta Biomater. 2016. PMID: 27090591
-
Dual Enzyme-Responsive Capsules of Hyaluronic Acid-block-Poly(Lactic Acid) for Sensing Bacterial Enzymes.Macromol Rapid Commun. 2015 Jul;36(13):1248-54. doi: 10.1002/marc.201500076. Epub 2015 May 3. Macromol Rapid Commun. 2015. PMID: 25940300
-
Oxidation of evaporated porous silicon rugate filters.Appl Opt. 2006 Nov 10;45(32):8298-303. doi: 10.1364/ao.45.008298. Appl Opt. 2006. PMID: 17068573
-
Nanostructural Engineering of Nanoporous Anodic Alumina for Biosensing Applications.Materials (Basel). 2014 Jul 18;7(7):5225-5253. doi: 10.3390/ma7075225. Materials (Basel). 2014. PMID: 28788127 Free PMC article. Review.
-
Comprehensive exploration of natural degradation of poly(lactic acid) blends in various degradation media: A review.Int J Biol Macromol. 2021 Sep 30;187:732-741. doi: 10.1016/j.ijbiomac.2021.07.196. Epub 2021 Aug 3. Int J Biol Macromol. 2021. PMID: 34358596 Review.
Cited by
-
Recent Advances of Macrostructural Porous Silicon for Biomedical Applications.ACS Appl Mater Interfaces. 2025 Jan 29;17(4):5609-5626. doi: 10.1021/acsami.4c18296. Epub 2025 Jan 16. ACS Appl Mater Interfaces. 2025. PMID: 39818715 Free PMC article. Review.
-
MIP-Modified Porous Silicon Optical Sensor for Interleukin-6 Label-Free Quantification.Biosensors (Basel). 2025 May 17;15(5):320. doi: 10.3390/bios15050320. Biosensors (Basel). 2025. PMID: 40422059 Free PMC article.
References
-
- CDC Antibiotic Resistance Threats in the United States. CDC Office of Infectious Diseases (OID) [(accessed on 30 December 2020)];2013 Available online: https://www.cdc.gov/drugresistance/pdf/ar-threats-2013-508.pdf.
MeSH terms
Substances
Grants and funding
LinkOut - more resources
Full Text Sources
Medical
Molecular Biology Databases
