A review of Optical Point-of-Care devices to Estimate the Technology Transfer of These Cutting-Edge Technologies
- PMID: 36551058
- PMCID: PMC9776401
- DOI: 10.3390/bios12121091
A review of Optical Point-of-Care devices to Estimate the Technology Transfer of These Cutting-Edge Technologies
Abstract
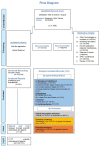
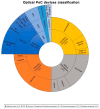
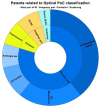
Despite the remarkable development related to Point-of-Care devices based on optical technology, their difficulties when used outside of research laboratories are notable. In this sense, it would be interesting to ask ourselves what the degree of transferability of the research work to the market is, for example, by analysing the relation between the scientific work developed and the registered one, through patent. In this work, we provide an overview of the state-of-the-art in the sector of optical Point-of-Care devices, not only in the research area but also regarding their transfer to market. To this end, we explored a methodology for searching articles and patents to obtain an indicator that relates to both. This figure of merit to estimate this transfer is based on classifying the relevant research articles in the area and the patents that have been generated from these ones. To delimit the scope of this study, we researched the results of a large enough number of publications in the period from 2015 to 2020, by using keywords "biosensor", "optic", and "device" to obtain the most representative articles from Web of Science and Scopus. Then, we classified them according to a particular classification of the optical PoC devices. Once we had this sampling frame, we defined a patent search strategy to cross-link the article with a registered patent (by surfing Google Patents) and classified them accordingly to the categories described. Finally, we proposed a relative figure called Index of Technology Transference (IoTT), which estimates to what extent our findings in science materialized in published articles are protected by patent.
Keywords: biosensor; medical device; optic; optical Point-of-Care (PoC); patent.
Conflict of interest statement
The authors declare that they have no known competing financial interests or personal relationships that could have appeared to influence the work reported in this paper.
Figures


Similar articles
-
Analysing patent landscapes in plant biotechnology and new plant breeding techniques.Transgenic Res. 2013 Feb;22(1):15-29. doi: 10.1007/s11248-012-9641-z. Epub 2012 Aug 17. Transgenic Res. 2013. PMID: 22899309
-
[Biotechnology research and generation of patents of interest to the health system].Med Clin (Barc). 2008 Dec;131 Suppl 5:55-9. doi: 10.1016/S0025-7753(08)76408-X. Med Clin (Barc). 2008. PMID: 19631824 Spanish.
-
Patent first, ask questions later: morality and biotechnology in patent law.William Mary Law Rev. 2003 Dec;45(2):469-547. William Mary Law Rev. 2003. PMID: 15570677
-
Trends in in ovo sexing technologies: insights and interpretation from papers and patents.J Anim Sci Biotechnol. 2023 Jul 14;14(1):102. doi: 10.1186/s40104-023-00898-1. J Anim Sci Biotechnol. 2023. PMID: 37452378 Free PMC article. Review.
-
Smartphone-Based Biosensor Devices for Healthcare: Technologies, Trends, and Adoption by End-Users.Bioengineering (Basel). 2022 Mar 1;9(3):101. doi: 10.3390/bioengineering9030101. Bioengineering (Basel). 2022. PMID: 35324790 Free PMC article. Review.
Cited by
-
Recent advances in microfluidic-based spectroscopic approaches for pathogen detection.Biomicrofluidics. 2024 Jun 7;18(3):031505. doi: 10.1063/5.0204987. eCollection 2024 May. Biomicrofluidics. 2024. PMID: 38855476 Free PMC article. Review.
References
-
- Perez-Molina E., Loizides F. Novel Data Structure and Visualization Tool for Studying Technology Evolution Based on Patent Information: The DTFootprint and the TechSpectrogram. World Pat. Inf. 2021;64:102009. doi: 10.1016/j.wpi.2020.102009. - DOI
-
- Dziallas M., Blind K. Innovation Indicators throughout the Innovation Process: An Extensive Literature Analysis. Technovation. 2019;80–81:3–29. doi: 10.1016/j.technovation.2018.05.005. - DOI
-
- Martino J.P. A Review of Selected Recent Advances in Technological Forecasting. Technol. Forecast. Soc. Change. 2003;70:719–733. doi: 10.1016/S0040-1625(02)00375-X. - DOI
Publication types
MeSH terms
Grants and funding
LinkOut - more resources
Full Text Sources

