. 2022 Nov 29;12(12):1092.
doi: 10.3390/bios12121092.

Motion Compensation for 3D Multispectral Handheld Photoacoustic Imaging

Affiliations

Motion Compensation for 3D Multispectral Handheld Photoacoustic Imaging

Chiho Yoon et al. Biosensors (Basel). .

Abstract

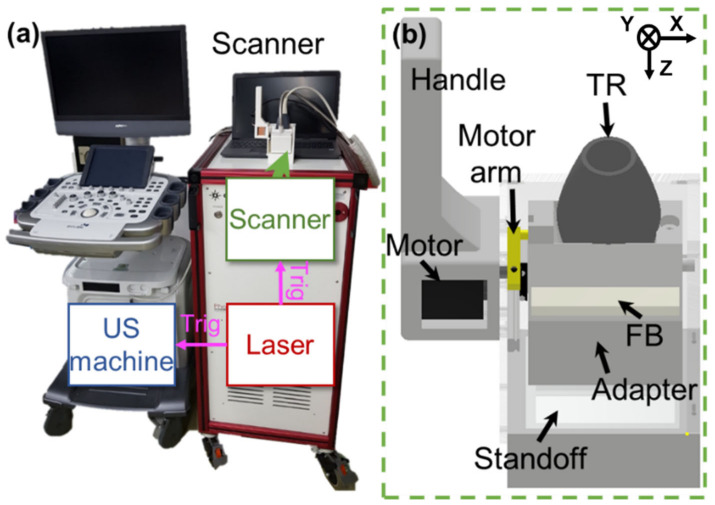
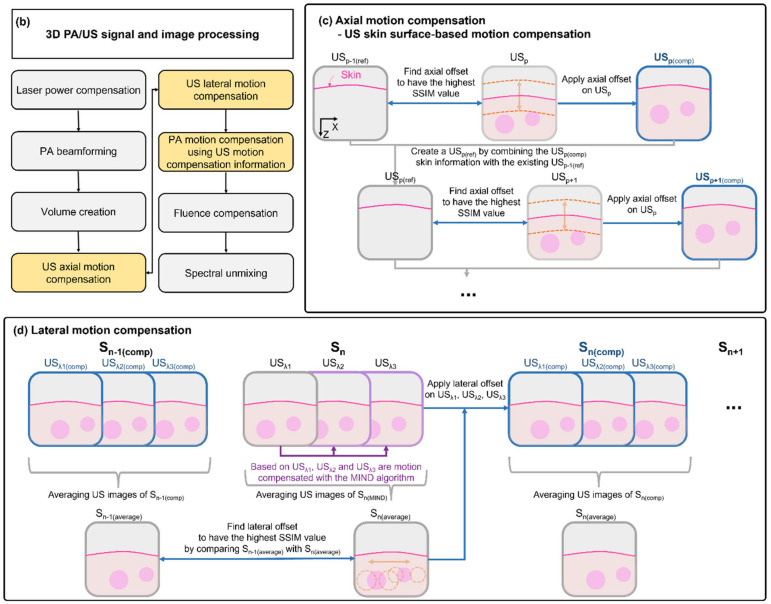
Three-dimensional (3D) handheld photoacoustic (PA) and ultrasound (US) imaging performed using mechanical scanning are more useful than conventional 2D PA/US imaging for obtaining local volumetric information and reducing operator dependence. In particular, 3D multispectral PA imaging can capture vital functional information, such as hemoglobin concentrations and hemoglobin oxygen saturation (sO2), of epidermal, hemorrhagic, ischemic, and cancerous diseases. However, the accuracy of PA morphology and physiological parameters is hampered by motion artifacts during image acquisition. The aim of this paper is to apply appropriate correction to remove the effect of such motion artifacts. We propose a new motion compensation method that corrects PA images in both axial and lateral directions based on structural US information. 3D PA/US imaging experiments are performed on a tissue-mimicking phantom and a human wrist to verify the effects of the proposed motion compensation mechanism and the consequent spectral unmixing results. The structural motions and sO2 values are confirmed to be successfully corrected by comparing the motion-compensated images with the original images. The proposed method is expected to be useful in various clinical PA imaging applications (e.g., breast cancer, thyroid cancer, and carotid artery disease) that are susceptible to motion contamination during multispectral PA image analysis.

Keywords: motion compensation; multi-wavelength imaging; photoacoustic; spectral unmixing; ultrasound.


Conflict of interest statement

Chulhong Kim has financial interests in OPTICHO, which, however, did not support this.

Figures

Figure 1
Figure 1
(a) Photograph of a clinical handheld PA/US imaging system and a 3D handheld imaging scanner. (b) Schematics of the 3D handheld scanner. PA: photoacoustic; US: ultrasound; TR: ultrasound transducer; and FB: fiber bundles.
Figure 2
Figure 2
Schematics of (a) acquisition of 3D multi-wavelength PA/US images, (b) 3D PA/US signal and image processing, (c) axial motion compensation, and (d) lateral motion compensation. USp, USp(ref), and USp(comp) represent the pth acquired US image, the reference image for the following axial motion compensation of US image, and the axial-motion-compensated US image, respectively. Sn, Sn(MIND), Sn(average), and Sn(comp) represent the US images included in the nth scanning period, the MIND-corrected US images of the nth scanning period, the average US image of the nth scanning period, and the lateral-motion-compensated US images of the nth scanning period, respectively. USλ1, USλ2, and USλ3 represent the US images obtained at three optical wavelengths (756, 797, and 866 nm, respectively). Note that the US images are not affected by the optical wavelengths. PA: photoacoustic; US: ultrasound; ROI: region of interest; SSIM: the structural similarity index measure; and MIND: modality independent neighbourhood descriptor.
Figure 2
Figure 2
Schematics of (a) acquisition of 3D multi-wavelength PA/US images, (b) 3D PA/US signal and image processing, (c) axial motion compensation, and (d) lateral motion compensation. USp, USp(ref), and USp(comp) represent the pth acquired US image, the reference image for the following axial motion compensation of US image, and the axial-motion-compensated US image, respectively. Sn, Sn(MIND), Sn(average), and Sn(comp) represent the US images included in the nth scanning period, the MIND-corrected US images of the nth scanning period, the average US image of the nth scanning period, and the lateral-motion-compensated US images of the nth scanning period, respectively. USλ1, USλ2, and USλ3 represent the US images obtained at three optical wavelengths (756, 797, and 866 nm, respectively). Note that the US images are not affected by the optical wavelengths. PA: photoacoustic; US: ultrasound; ROI: region of interest; SSIM: the structural similarity index measure; and MIND: modality independent neighbourhood descriptor.
Figure 3
Figure 3
(a) Photograph of the 3D handheld scanner placed on the phantom and the phantom schematics. #1-#3 represent three black threads at different depths of 9, 14, and 21 mm, respectively. Yellow and green boxes represent signal and noise areas, respectively. (b) Original and (c) artificially motion-disrupted photoacoustic (PA) images: the average B-mode PA images along the Y axis, and the PA maximum amplitude projection (MAP) images along the YZ and XY planes, respectively. The average B-mode PA images and PA MAP images along the YZ and XY planes after (d) axial and (e) lateral motion correction. The X, Y, and Z directions represent lateral, elevational, and axial directions, respectively. The boxes are selected to calculate peak signal-to-noise ratios (pSNRs). (f) The pSNRs of the black threads at the different depths calculated at each step of process. (g) The FWHMs of the black thread at 9 mm depth calculated at each step of process. (h) The cross-correlations (CCs) between the original PA images and others. The original images are used as references to calculate CCs. TR: ultrasound transducer; FB: fiber bundles.
Figure 3
Figure 3
(a) Photograph of the 3D handheld scanner placed on the phantom and the phantom schematics. #1-#3 represent three black threads at different depths of 9, 14, and 21 mm, respectively. Yellow and green boxes represent signal and noise areas, respectively. (b) Original and (c) artificially motion-disrupted photoacoustic (PA) images: the average B-mode PA images along the Y axis, and the PA maximum amplitude projection (MAP) images along the YZ and XY planes, respectively. The average B-mode PA images and PA MAP images along the YZ and XY planes after (d) axial and (e) lateral motion correction. The X, Y, and Z directions represent lateral, elevational, and axial directions, respectively. The boxes are selected to calculate peak signal-to-noise ratios (pSNRs). (f) The pSNRs of the black threads at the different depths calculated at each step of process. (g) The FWHMs of the black thread at 9 mm depth calculated at each step of process. (h) The cross-correlations (CCs) between the original PA images and others. The original images are used as references to calculate CCs. TR: ultrasound transducer; FB: fiber bundles.
Figure 4
Figure 4
In vivo 3D multispectral PA/US imaging of a human wrist. (a) Photograph of the human wrist. The red dashed boxes represent the imaged regions. (b) Original and (c) artificially motion-disrupted photoacoustic (PA) maximum amplitude projection (MAP) images on the YZ and XY planes of the human wrist. The PA MAP images on the YZ and XY planes after (d) axial and (e) lateral motion correction. The X, Y, and Z directions represent lateral, elevational, and axial directions, respectively. B-mode US/PA and B-mode US/PA sO2 images of the human wrist are presented. The PA and PA sO2 images of the upper boundaries of radial arteries (RAs) are overlaid on the corresponding US images. White dashed lines in the MAP images correspond to B-mode US/PA and B-mode US/PA sO2 image positions. (f) The cross-correlations (CCs) between the original PA images and others. (g) The average PA sO2 values in the RAs. sO2: haemoglobin oxygen saturation.
Figure 4
Figure 4
In vivo 3D multispectral PA/US imaging of a human wrist. (a) Photograph of the human wrist. The red dashed boxes represent the imaged regions. (b) Original and (c) artificially motion-disrupted photoacoustic (PA) maximum amplitude projection (MAP) images on the YZ and XY planes of the human wrist. The PA MAP images on the YZ and XY planes after (d) axial and (e) lateral motion correction. The X, Y, and Z directions represent lateral, elevational, and axial directions, respectively. B-mode US/PA and B-mode US/PA sO2 images of the human wrist are presented. The PA and PA sO2 images of the upper boundaries of radial arteries (RAs) are overlaid on the corresponding US images. White dashed lines in the MAP images correspond to B-mode US/PA and B-mode US/PA sO2 image positions. (f) The cross-correlations (CCs) between the original PA images and others. (g) The average PA sO2 values in the RAs. sO2: haemoglobin oxygen saturation.

Similar articles

Cited by

References

    1. Choi W., Park E.-Y., Jeon S., Kim C. Clinical Photoacoustic Imaging Platforms. Biomed. Eng. Lett. 2018;8:139–155. doi: 10.1007/s13534-018-0062-7. - DOI - PMC - PubMed
    1. Wang L.V., Wu H.-I. Biomedical Optics: Principles and Imaging. John Wiley & Sons; Hoboken, NJ, USA: 2012.
    1. Lutzweiler C., Razansky D. Optoacoustic Imaging and Tomography: Reconstruction Approaches and Outstanding Challenges in Image Performance and Quantification. Sensors. 2013;13:7345–7384. doi: 10.3390/s130607345. - DOI - PMC - PubMed
    1. Ntziachristos V., Razansky D. Molecular Imaging by Means of Multispectral Optoacoustic Tomography (MSOT) Chem. Rev. 2010;110:2783–2794. doi: 10.1021/cr9002566. - DOI - PubMed
    1. Kim J., Park E.-Y., Park B., Choi W., Lee K.J., Kim C. Towards Clinical Photoacoustic and Ultrasound Imaging: Probe Improvement and Real-Time Graphical User Interface. Exp. Biol. Med. 2020;245:321–329. doi: 10.1177/1535370219889968. - DOI - PMC - PubMed

LinkOut - more resources