. 2022 Dec 1;12(12):1102.
doi: 10.3390/bios12121102.

Correlative Raman-Electron-Light (CREL) Microscopy Analysis of Lipid Droplets in Melanoma Cancer Stem Cells

Affiliations

Correlative Raman-Electron-Light (CREL) Microscopy Analysis of Lipid Droplets in Melanoma Cancer Stem Cells

Francesca Pagliari et al. Biosensors (Basel). .

Abstract

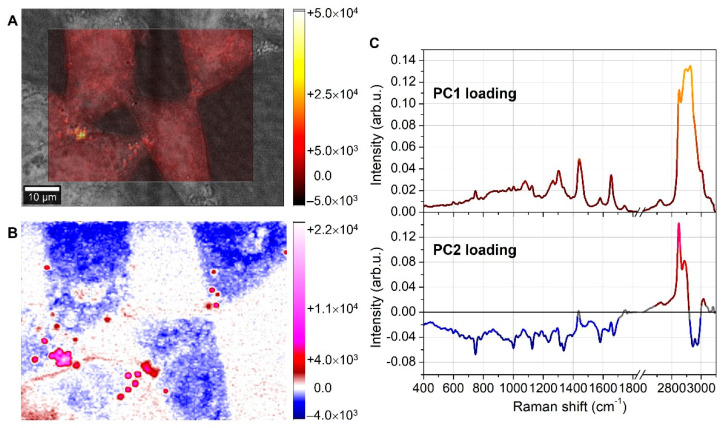
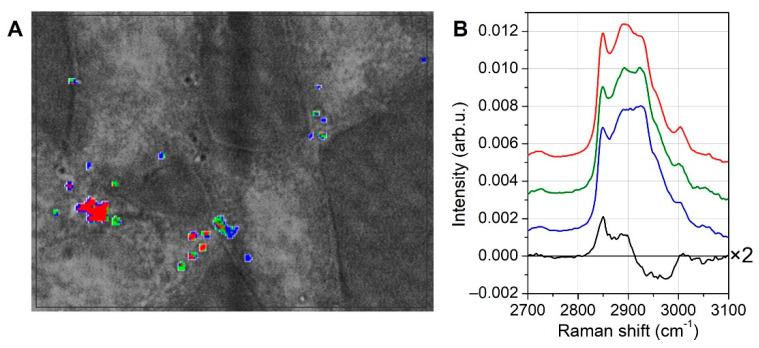
Among all neoplasms, melanoma is characterized by a very high percentage of cancer stem cells (CSCs). Several markers have been proposed for their identification, and lipid droplets (LDs) are among them. Different techniques are used for their characterization such as mass spectrometry, imaging techniques, and vibrational spectroscopies. Some emerging experimental approaches for the study of LDs are represented by correlative light-electron microscopy and by correlative Raman imaging-scanning electron microscopy (SEM). Based on these scientific approaches, we developed a novel methodology (CREL) by combining Raman micro-spectroscopy, confocal fluorescence microscopy, and SEM coupled with an energy-dispersive X-ray spectroscopy module. This procedure correlated cellular morphology, chemical properties, and spatial distribution from the same region of interest, and in this work, we presented the application of CREL for the analysis of LDs within patient-derived melanoma CSCs (MCSCs).

Keywords: Raman micro-imaging; correlative microscopy; electron microscopy; lipid droplets; melanoma cancer stem cells.


Conflict of interest statement

The authors declare no conflict of interest.

Figures

Figure 1
Figure 1
Representative scheme of the experimental design. Patient-derived MCSCs seeded on micro-patterned CaF2 substrates and analyzed by Raman spectroscopy in live conditions. After Raman measurements, MCSCs were fixed in 3% PFA and stained with LD540 and Hoechst33342 for LDs and nuclei, respectively. Lastly, PFA-fixed MCSCs were fixed again in 1% glutaraldehyde and OsO4 for SEM analysis.
Figure 2
Figure 2
PC1 and PC2 score maps. Principal components PC1 and PC2 score maps, respectively, as shown in (A,B). Image (C) shows the PC1 and PC2 loading curves. PC1 loading curve (top of (C)) resembles the average spectrum recorded on the cells, and for this reason, PC1 score map (A) mainly accounted for topographical information. Instead, the PC2 loading curve (bottom (C)) exhibited strong positive lipid features at 2850 and 2885 cm−1, thus marking the lipid content. The corresponding PC2 score map (B) clearly showed the lipid droplet locations as bright-red-to-magenta regions. The colors of the loading curves in (C) reflected the color bars of the corresponding score maps in (A,B).
Figure 3
Figure 3
KCA map and average spectra. Resulting clusters obtained by KCA (A) and corresponding average spectra (B) (for clarity’s sake, the curves were shifted along the vertical axis). In (A), the blue areas were characterized by nucleotide features in the average spectrum, thus marking the nuclear regions along with ribosome spots in the cytoplasm; the yellow curve exhibits spectral features strongly related to Cyt C, and the corresponding regions in the map were classified as mitochondria areas; the red localized spots show strong Raman markers for lipids and were assigned to lipid droplets because of their spatial confinement.
Figure 4
Figure 4
Analysis of lipid droplets. Only the spectra corresponding to lipid droplets were extracted from the full map dataset, and KCA was performed on this smaller lipid dataset. KCA clusters are shown in (A) and superimposed to the optical picture of the cells, while the corresponding average curves are shown in (B) (for clarity’s sake, the curves were shifted along the vertical axis). Since the fingerprint region was very similar for all the curves, in (B) we only showed the high-frequency region, where some small differences are observable. The black curve is the difference spectrum of red minus blue curve, indicating that lipid markers at 2850 and 2885 cm−1 were more pronounced in red regions.
Figure 5
Figure 5
Confocal image of MCSCs stained for LDs and nuclei. Three-dimensional reconstruction of LDs (yellow) stained with LD540 and nuclei (blue) stained with Hoechst33342 overlapped with bright field max intensity projection of the relative z-stack images used for the reconstruction (scale bar, 10 μm). In the right panel, LD details are reported.
Figure 6
Figure 6
Scanning electron microscopy images of MCSCs. (A) SE image of the same ROI investigated by Raman and confocal microscopy; (B) detail of an MCSC area in which some LDs are identified and measured; (C) tilted image of part of MCSC with LDs; (DI) BSE images of cells rich in LDs in the ROI. The areas of panels B and C are indicated in panel A, and the positions of panels (DI) are also indicated in panel A by the corresponding symbols. Scale bars for panel (DI) are all 5.0 um.

Similar articles

Cited by

References

    1. Brinckerhoff C.E. Cancer Stem Cells (CSCs) in melanoma: There’s smoke, but is there fire? J. Cell. Physiol. 2017;232:2674–2678. doi: 10.1002/jcp.25796. - DOI - PMC - PubMed
    1. Quintana E., Shackleton M., Sabel M.S., Fullen D.R., Johnson T.M., Morrison S.J. Efficient tumour formation by single human melanoma cells. Nature. 2008;456:593–598. doi: 10.1038/nature07567. - DOI - PMC - PubMed
    1. Fang D., Nguyen T.K., Leishear K., Finko R., Kulp A.N., Hotz S., Van Belle P.A., Xu X., Elder D.E., Herlyn M. A tumorigenic subpopulation with stem cell properties in melanomas. Cancer Res. 2005;65:9328–9337. doi: 10.1158/0008-5472.CAN-05-1343. - DOI - PubMed
    1. Marzagalli M., Raimondi M., Fontana F., Marelli M.M., Moretti R.M., Limonta P. Cellular and molecular biology of cancer stem cells in melanoma: Possible therapeutic implications. Semin. Cancer Biol. 2019;59:221–235. doi: 10.1016/j.semcancer.2019.06.019. - DOI - PubMed
    1. Giampietri C., Petrungaro S., Cordella M., Tabolacci C., Tomaipitinca L., Facchiano A., Eramo A., Filippini A., Facchiano F., Ziparo E. Lipid storage and autophagy in melanoma cancer cells. Int. J. Mol. Sci. 2017;18:1271. doi: 10.3390/ijms18061271. - DOI - PMC - PubMed