Review
. 2022 Dec 1;12(12):1104.
doi: 10.3390/bios12121104.

Ir(III) Complexes with AIE Characteristics for Biological Applications

Affiliations
Review

Ir(III) Complexes with AIE Characteristics for Biological Applications

Yu Pei et al. Biosensors (Basel). .

Abstract

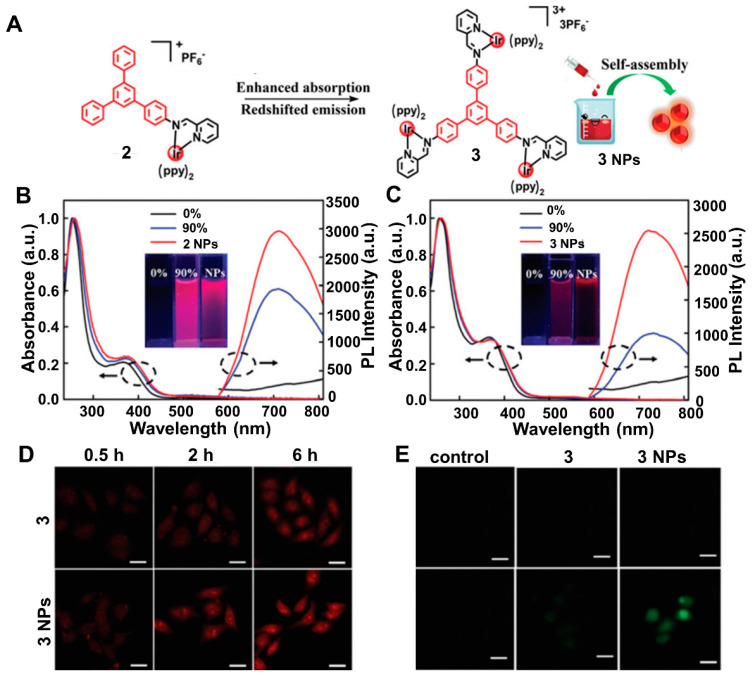
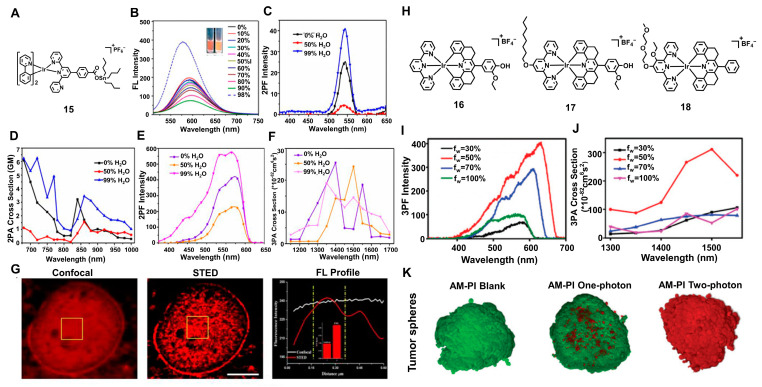
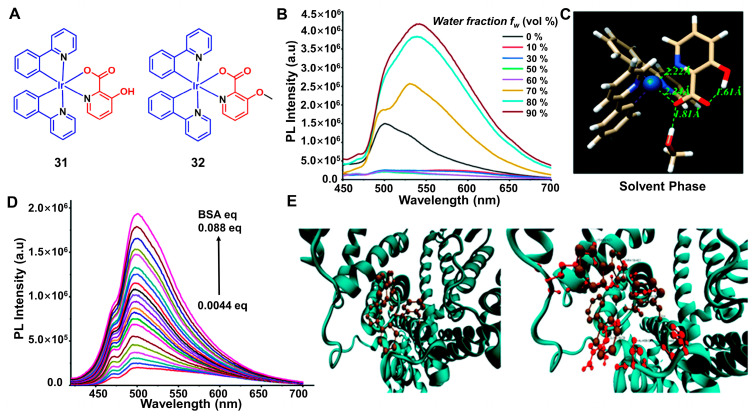
Both biological process detection and disease diagnosis on the basis of luminescence technology can provide comprehensive insights into the mechanisms of life and disease pathogenesis and also accurately guide therapeutics. As a family of prominent luminescent materials, Ir(III) complexes with aggregation-induced emission (AIE) tendency have been recently explored at a tremendous pace for biological applications, by virtue of their various distinct advantages, such as great stability in biological media, excellent fluorescence properties and distinctive photosensitizing features. Significant breakthroughs of AIE-active Ir(III) complexes have been achieved in the past few years and great progress has been witnessed in the construction of novel AIE-active Ir(III) complexes and their applications in organelle-specific targeting imaging, multiphoton imaging, biomarker-responsive bioimaging, as well as theranostics. This review systematically summarizes the basic concepts, seminal studies, recent trends and perspectives in this area.

Keywords: Ir(III) complexes; PDT; aggregation-induced emission (AIE); specific responsive; targeting.


Conflict of interest statement

The authors declare no conflict of interest.

Figures

Scheme 1
Scheme 1
Chemical structures of Ir(III) complexes with AIE properties in biological field.
Figure 1
Figure 1
(A) The molecular structure of 1. (B) Solution UV-vis absorbance spectra of 1 in EtOH/water (fractions of EtOH 1%, 10% and 100%). (C) Phosphorescence spectra of 1 in EtOH/water (fractions of water ranged from 0 to 99%). (D) Variation in PL intensity in EtOH/water mixtures with fw. (E) The phosphorescence spectrum of 1O2. (F) The cytotoxicity and phototoxicity of 1, Ce6 and RB to Hela cells. (G) CLSM images of Hela cells in the (a) presence (the red arrows: blebs were emerged around the cytomembrane) and (b) absence of 1 and their laser irradiation time-dependent bright-field images. Reprinted with permission from [44], copyright 2021, Wiley-VCH.
Figure 2
Figure 2
(A) Molecular structure of 2 and 3. (B) UV–vis absorption spectra and emission spectra of 2, 3 (DMSO, DMSO/water = 1/9) and corresponding NPs in water. (The arrows indicate the corresponding ordinate, The circles represent the absorption or emission curve of the materials). (C) CLSM images of Hela cells in the presence of 3 and 3 NPs. (D) Cellular uptake of 3 and 3 NPs detected by CLSM. (E) Confocal fluorescence images for the detection of 1O2 generation in HeLa cells treated with 3 and 3 NPs under light. Reprinted with permission from [47], copyright 2020, Royal Society of Chemistry.
Figure 3
Figure 3
(A) Molecular structure of 4, 5 and 6. (B) UV–vis absorption spectra and emission spectra of 4, 5, 6 and corresponding NPs. (C) CLSM images of Hela cells in the presence of 6 and 6 NPs. (D) Confocal fluorescence images for the detection of 1O2 generation in Hela cells treated with 6 and 6 NPs. Reprinted with permission from [49], copyright 2019, Wiley-VCH.
Figure 4
Figure 4
(A) Chemical structures of UCNPs@8 and the application PDT. (B) Absorption and emission spectra of 7 and 8. (C) PL spectra of 8 in CH3CN:H2O = 1:9 v/v. (D) The UV-vis absorption spectra of 8 (black line) and the PL spectra of UCNPs (red line). (E) The UV-vis absorption spectra of 8, UCNPs, UCNPs@TPGS and UCNPs@8. (F) Cell viability of 4T1 cells treated with UCNPs@8. (G) Confocal fluorescence images of 4T1 cells co-stained with calcein-AM (live cells, green fluorescence) and propidium iodide (dead cells, red fluorescence) after treatment with UCNPs@8. (H) Cellular uptake of UCNPs@8 detected by CLSM. (I) Confocal fluorescence images for detecting 1O2 generation in 4T1 cells treated with UCNPs@8. Reprinted with permission from [52], copyright 2022, Royal Society of Chemistry.
Figure 5
Figure 5
(A) Chemical structures of 9–11. (B) PL spectra of 9 in DMSO/water mixed solvents with different water fraction. (C) TPA cross-sections of 9. (D) 1O2 emission spectra in the presence of 9 and irradiation (405 nm) in varying fractions of water–DMSO mixture. (E) Confocal images of HeLa before and after TPA–PDT. (F) Annexin V-FITC/PI co-staining on HeLa cells before and after TPA–PDT. (G) Annexin V-FITC/PI co-staining on HeLa cells before and after TPA–PDT. Reprinted with permission from [60], copyright 2017, Royal Society of Chemistry.
Figure 6
Figure 6
(A) Schematic illustration of the fabrication of 12@BSA NPs. (B) Plots of the relative emission intensity (I/I0) versus water fraction. (C) Two-photon absorption cross-section of 12@BSA NPs. (D) ROS detection in the presence of samples under laser illumination. (E) Two-photon images of 3D tumor cells incubated with 12@BSA NPs. (F) Confocal images of MCF-7 cells after co-culture with 12@BSA NPs. Reprinted with permission from [62], copyright 2022, Elsevier. (G) Chemical structures of 13 and 14. (H) Phosphorescence spectra of 13 in H2O/DMSO mixtures. (I) The absorption and PL spectra of 13 and 13 NPs. (J) The one-photon excitation (OPE)/two-photon excitation (TPE) confocal images of 13 NPs. Reprinted with permission from [63], copyright 2021, Springer Nature.
Figure 7
Figure 7
(A) The chemical structure of 15. (B) PL spectra of 15 in different H2O fractions. (C) Two-photon fluorescence spectra of 15. (D) Two-photon cross-section of 15. (E) Three-photon fluorescence spectra of 15. (F) Three-photon fluorescence spectra of 15. (G) Two-photon fluorescence confocal imaging and stimulated emission depletion (STED) microscopy of 15 nuclear staining in A549 cells. Reprinted with permission from [64], copyright 2020, American Chemical Society. (H) The chemical structure of 16, 17 and 18. (I) Three-photon fluorescence spectra and (J) three-photon absorption cross-section of 16. (K) 3D fluorescence images of 3D multicellular tumor spheroids under one-photon and two-photon laser irradiation. Reprinted with permission from [65], copyright 2022, Royal Society of Chemistry.
Figure 8
Figure 8
(A) Molecular structures of 19–23 complexes. (B) Emission spectra of 19 in DMSO-PBS mixtures with different water fractions. (C) Viability of HeLa cells incubated with 500 nM of 19–23. (D) Confocal images of living HeLa cells incubated with 19 and their images. (E) Quantitative photobleaching results of 19–23 in HeLa cells. (F) Emission intensity of 10 μM of 19–23 at 590 nm under different pH. (G) Confocal luminescence image and bright-field images of living HeLa cells incubated with 500 nM 19 in DMSO-PBS under different conditions. (H) Confocal images of HeLa cells stained with 19 (500 nM, orange) and LTG (100 nM, green) in the presence of CCCP (10 μM). The regions (right) indicated in white boxes are enlarged from the shown area of this cell (left). The location that the white arrow pointed out indicated the occurrence of mitophagy. Reprinted with permission from [69], copyright 2016, Springer Nature.
Figure 9
Figure 9
(A) Synthetic routes for complexes 24 and 25. (B) Absorption and photoluminescence spectra of 24 and 25. (The arrows indicate the corresponding ordinate, The circles represent the absorption or emission curve of the materials). (C) PL spectra of 24 and 25 in MeOH/water mixed solvents with different water fractions. (D) Intracellular compound localization of 25 in HOS cells. (E) Luminescent images of 24 and 25 in solutions with different water fractions and solid sample of 24 and 25 under irradiation with a 365 nm UV lamp. (F) Cytotoxicity assay for 25 in HOS cells. Reprinted with permission from [70], copyright 2017, Royal Society of Chemistry.
Figure 10
Figure 10
(A) Chemical structure of 26. (B) THF–water mixtures with different water fractions (0 to 90%). (C) PL spectra of 26 (10 μM) upon addition of RNA, ctDNA, ssDNA, BSA and G-quadruplex DNA (4-fold) in CH3CN/PBS buffer. (D) PL titration of 26 with RNA (0 to 4-fold) in CH3CN/PBS buffer. (E) DLS profile of 26. (F) Fluorescence and (G) SEM images of 26 (10 μM). (H) View of the interactions of 26 with nearby pyrimidine and purine bases of rRNA in docked structure. (I) Fluorescence microscopy images of HeLa cells stained with different concentrations of 26. Reprinted with permission from [71], copyright 2018, Royal Society of Chemistry.
Figure 11
Figure 11
(A) Chemical structures of complexes 27 and 28. (B) Left: MCF-7 cells treated with 1 mM 27. Right: U87 cells treated with 0.75 mM 28. (C) IC50 (μM) of 27–28, BODIPY and cisplatin in different cell lines. Reprinted with permission from [72], copyright 2016, Royal Society of Chemistry.
Figure 12
Figure 12
(A) Synthetic route of 29. (B) The emission spectrum of 29 in solid state. Inset: emission image of 29 in solid state under 365 nm UV illumination. (C) Emission spectrum of 29 upon addition of NaClO4 in HEPES buffer solution, λex = 388 nm. (D) PL spectrum of 29 towards other ions in HEPES buffer solution at room temperature. (E) The mechanics of 29 in presence of Hg(ClO4)2 in THF and in H2O. Reprinted with permission from [75], copyright 2016, Elsevier.
Figure 13
Figure 13
(A) The chemical structure of 30. (B) Proposed possible processes of ClO4 with 30 in H2O. (C) Corresponding images of ClO4 and other anions under 365 nm UV illumination. (D) CLSM photographs of HeLa cells. Reprinted with permission from [77], copyright 2017, Elsevier.
Figure 14
Figure 14
(A) The chemical structures of complexes 31 and 32. (B) PL spectrum of 31 in MeOH with different water concentration. (C) DFT optimized structure of 31 in MeOH. (D) PL intensity of 31 (1 × 10⁻⁵ M) with gradually increasing BSA. (E) Alpha helices are binding partners of the ligand in the binding pocket and hydrogen bonding interactions of 31 with the residues of the proteins. Reprinted with permission from [80], copyright 2020, Royal Society of Chemistry.
Figure 15
Figure 15
(A) The chemical structures of complexes 33–35. (B) Emission spectrum of 34 in H2O–THF mixtures with different THF fractions. (C) Limit of detection (LOD) of LPS and LTA by the 33–35 confirmed from the linear fit curve of emission titration using fluorescence spectroscopy. (D) Kinetics of bacterial detection and growth inhibition. (E) Kinetics of growth inhibition for CRAB treated with 34 (15 μg/mL) in water. Reprinted with permission from [84], copyright 2020, American Chemical Society.

Similar articles

  • Theranostics based on AIEgens.
    Wang D, Lee MMS, Xu W, Kwok RTK, Lam JWY, Tang BZ. Wang D, et al. Theranostics. 2018 Sep 9;8(18):4925-4956. doi: 10.7150/thno.27787. eCollection 2018. Theranostics. 2018. PMID: 30429878 Free PMC article. Review.
  • Bioinspired AIE Nanomedicine: A Burgeoning Technology for Fluorescence Bioimaging and Phototheranostics.
    Li Z, Tang BZ, Wang D. Li Z, et al. Adv Mater. 2024 Aug;36(32):e2406047. doi: 10.1002/adma.202406047. Epub 2024 Jun 19. Adv Mater. 2024. PMID: 38874364 Review.
  • Recent Advances in Aggregation-Induced Emission Materials and Their Biomedical and Healthcare Applications.
    He W, Zhang T, Bai H, Kwok RTK, Lam JWY, Tang BZ. He W, et al. Adv Healthc Mater. 2021 Dec;10(24):e2101055. doi: 10.1002/adhm.202101055. Epub 2021 Aug 21. Adv Healthc Mater. 2021. PMID: 34418306 Review.
  • Leading edge biosensing applications based on AIE technology.
    Zhu W, Wang J, Lei K, Yan X, Xu J, Liu S, Li C. Zhu W, et al. Biosens Bioelectron. 2025 Mar 1;271:116953. doi: 10.1016/j.bios.2024.116953. Epub 2024 Nov 19. Biosens Bioelectron. 2025. PMID: 39622156 Review.
  • Aggregation-Induced Emission (AIE), Life and Health.
    Wang H, Li Q, Alam P, Bai H, Bhalla V, Bryce MR, Cao M, Chen C, Chen S, Chen X, Chen Y, Chen Z, Dang D, Ding D, Ding S, Duo Y, Gao M, He W, He X, Hong X, Hong Y, Hu JJ, Hu R, Huang X, James TD, Jiang X, Konishi GI, Kwok RTK, Lam JWY, Li C, Li H, Li K, Li N, Li WJ, Li Y, Liang XJ, Liang Y, Liu B, Liu G, Liu X, Lou X, Lou XY, Luo L, McGonigal PR, Mao ZW, Niu G, Owyong TC, Pucci A, Qian J, Qin A, Qiu Z, Rogach AL, Situ B, Tanaka K, Tang Y, Wang B, Wang D, Wang J, Wang W, Wang WX, Wang WJ, Wang X, Wang YF, Wu S, Wu Y, Xiong Y, Xu R, Yan C, Yan S, Yang HB, Yang LL, Yang M, Yang YW, Yoon J, Zang SQ, Zhang J, Zhang P, Zhang T, Zhang X, Zhang X, Zhao N, Zhao Z, Zheng J, Zheng L, Zheng Z, Zhu MQ, Zhu WH, Zou H, Tang BZ. Wang H, et al. ACS Nano. 2023 Aug 8;17(15):14347-14405. doi: 10.1021/acsnano.3c03925. Epub 2023 Jul 24. ACS Nano. 2023. PMID: 37486125 Free PMC article. Review.

Cited by

References

    1. Kober E.M., Meyer T.J. Concerning the absorption spectra of the ions M(bpy)32+ (M = Fe, Ru, Os; bpy = 2,2′-bipyridine) Inorg. Chem. 1982;21:3967–3977. doi: 10.1021/ic00141a021. - DOI
    1. You Y., Nam W. Photofunctional triplet excited states of cyclometalated Ir(III) complexes: Beyond electroluminescence. Chem. Soc. Rev. 2012;41:7061–7084. doi: 10.1039/c2cs35171d. - DOI - PubMed
    1. Flamigni L., Barbieri A., Sabatini C., Ventura B., Barigelletti F. Photochemistry and photophysics of coordination compounds: Iridium. Top. Curr. Chem. 2007;281:143–203. doi: 10.1007/128_2007_131. - DOI
    1. Zhao Q., Li F., Huang C. Phosphorescent chemosensors based on heavy-metal complexes. Chem. Soc. Rev. 2010;39:3007–3030. doi: 10.1039/b915340c. - DOI - PubMed
    1. Alam P., Climent C., Alemany P., Laskar I.R. “Aggregation-induced emission” of transition metal compounds: Design, mechanistic insights, and applications. J. Photoch. Photobio. C Photoch. Rev. 2019;41 doi: 10.1016/j.jphotochemrev.2019.100317. - DOI