

Electrochemical Ultrasensitive Sensing of Uric Acid on Non-Enzymatic Porous Cobalt Oxide Nanosheets-Based Sensor
- PMID: 36551107
- PMCID: PMC9775216
- DOI: 10.3390/bios12121140
Electrochemical Ultrasensitive Sensing of Uric Acid on Non-Enzymatic Porous Cobalt Oxide Nanosheets-Based Sensor
Abstract
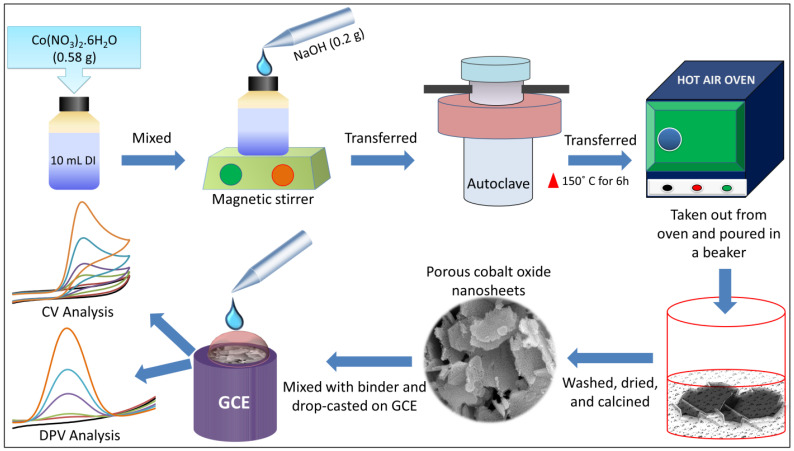
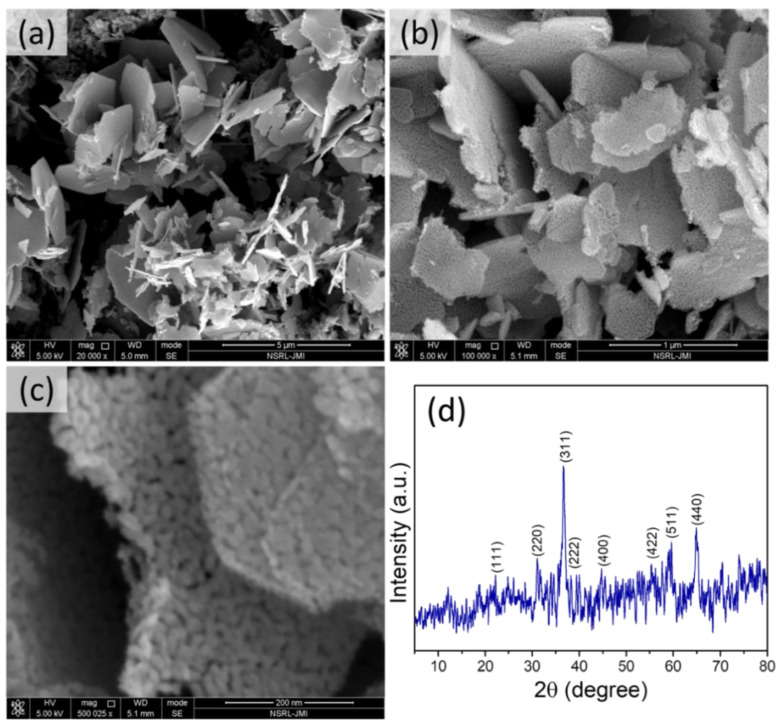
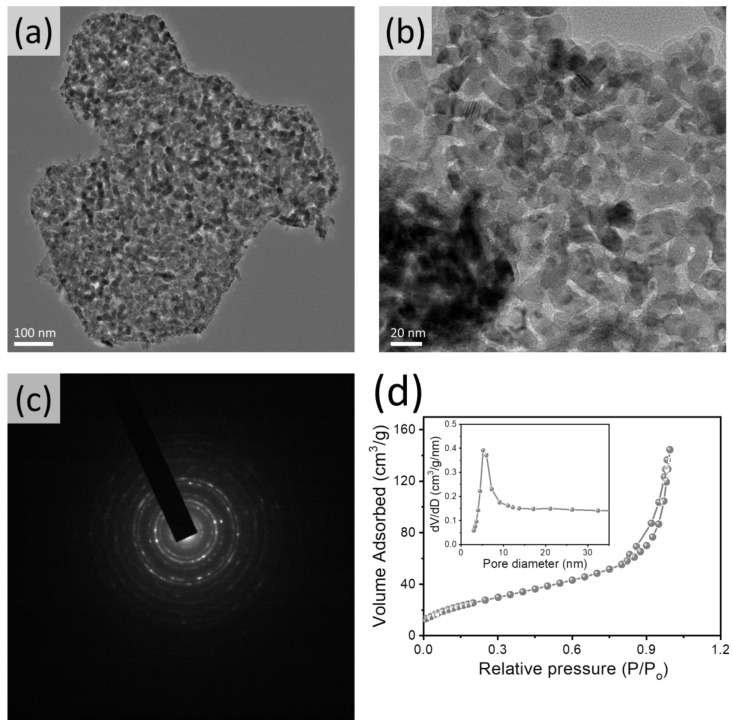
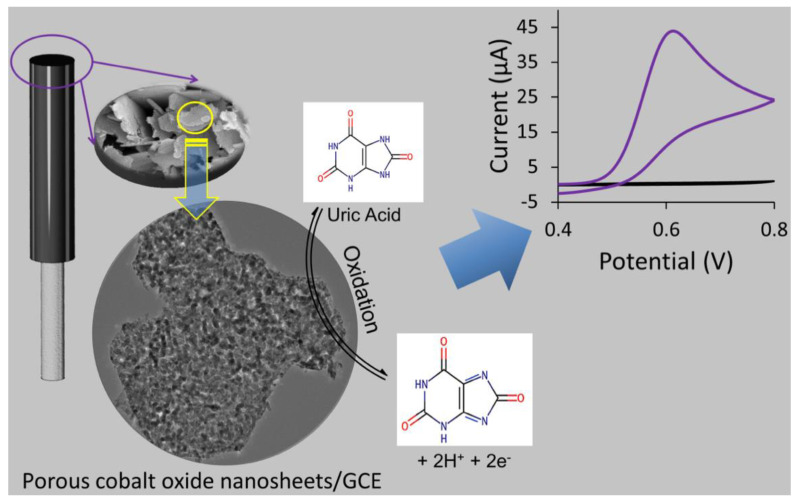
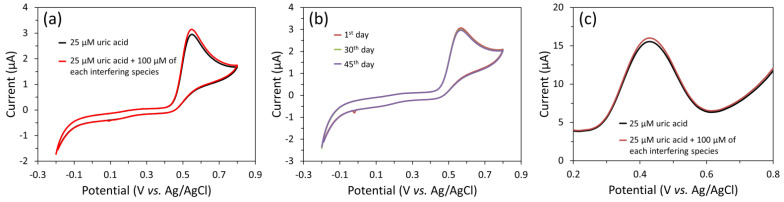
Transition metal oxide (TMO)-based nanomaterials are effectively utilized to fabricate clinically useful ultra-sensitive sensors. Different nanostructured nanomaterials of TMO have attracted a lot of interest from researchers for diverse applications. Herein, we utilized a hydrothermal method to develop porous nanosheets of cobalt oxide. This synthesis method is simple and low temperature-based. The morphology of the porous nanosheets like cobalt oxide was investigated in detail using FESEM and TEM. The morphological investigation confirmed the successful formation of the porous nanosheet-like nanostructure. The crystal characteristic of porous cobalt oxide nanosheets was evaluated by XRD analysis, which confirmed the crystallinity of as-synthesized cobalt oxide nanosheets. The uric acid sensor fabrication involves the fixing of porous cobalt oxide nanosheets onto the GCE (glassy carbon electrode). The non-enzymatic electrochemical sensing was measured using CV and DPV analysis. The application of DPV technique during electrochemical testing for uric acid resulted in ultra-high sensitivity (3566.5 µAmM-1cm-2), which is ~7.58 times better than CV-based sensitivity (470.4 µAmM-1cm-2). Additionally, uric acid sensors were tested for their selectivity and storage ability. The applicability of the uric acid sensors was tested in the serum sample through standard addition and recovery of known uric acid concentration. This ultrasensitive nature of porous cobalt oxide nanosheets could be utilized to realize the sensing of other biomolecules.
Keywords: cobalt oxide; electrochemical; nanosheets; non-enzymatic; porous; sensor; ultra-sensitive; uric acid.
Conflict of interest statement
The authors declare no conflict of interest.
Figures
Similar articles
-
Highly Sensitive Electrochemical Non-Enzymatic Uric Acid Sensor Based on Cobalt Oxide Puffy Balls-like Nanostructure.Biosensors (Basel). 2023 Mar 12;13(3):375. doi: 10.3390/bios13030375. Biosensors (Basel). 2023. PMID: 36979587 Free PMC article.
-
Non-enzymatic electrochemical dopamine sensing probe based on hexagonal shape zinc-doped cobalt oxide (Zn-Co2O4) nanostructure.Mikrochim Acta. 2021 Dec 27;189(1):37. doi: 10.1007/s00604-021-05142-z. Mikrochim Acta. 2021. PMID: 34958414
-
Electrochemical sensor based on an electrode modified with porous graphitic carbon nitride nanosheets (C3N4) embedded in graphene oxide for simultaneous determination of ascorbic acid, dopamine and uric acid.Mikrochim Acta. 2020 Jan 27;187(2):149. doi: 10.1007/s00604-019-4081-6. Mikrochim Acta. 2020. PMID: 31989275
-
Metal oxide nanostructures and their gas sensing properties: a review.Sensors (Basel). 2012;12(3):2610-31. doi: 10.3390/s120302610. Epub 2012 Feb 27. Sensors (Basel). 2012. PMID: 22736968 Free PMC article. Review.
-
Mo-Based Layered Nanostructures for the Electrochemical Sensing of Biomolecules.Sensors (Basel). 2020 Sep 21;20(18):5404. doi: 10.3390/s20185404. Sensors (Basel). 2020. PMID: 32967188 Free PMC article. Review.
Cited by
-
Highly Sensitive Electrochemical Non-Enzymatic Uric Acid Sensor Based on Cobalt Oxide Puffy Balls-like Nanostructure.Biosensors (Basel). 2023 Mar 12;13(3):375. doi: 10.3390/bios13030375. Biosensors (Basel). 2023. PMID: 36979587 Free PMC article.
-
Sustainable uric acid sensor based on a lab-fabricated electrode modified with rice straw-derived carbon materials.Sci Rep. 2025 May 26;15(1):18380. doi: 10.1038/s41598-025-03405-w. Sci Rep. 2025. PMID: 40419700 Free PMC article.
References
-
- King C., Lanaspa M.A., Jensen T., Tolan D.R., Sanchez-Lozada L.G., Johnson R.J. Uric Acid in Chronic Kidney Disease. Contrib. Nephrol. 2018;192:88–102. - PubMed
-
- Virdis A., Masi S., Casiglia E., Tikhonoff V., Cicero A.F., Ungar A., Rivasi G., Salvetti M., Barbagallo C.M., Bombelli M., et al. Identification of the Uric Acid Thresholds Predicting an Increased Total and Cardiovascular Mortality Over 20 Years. Hypertension. 2020;75:302–308. doi: 10.1161/HYPERTENSIONAHA.119.13643. - DOI - PubMed
MeSH terms
Substances
Grants and funding
LinkOut - more resources
Full Text Sources
