Review
. 2022 Dec 10;12(12):1154.
doi: 10.3390/bios12121154.

Optical Light Sources and Wavelengths within the Visible and Near-Infrared Range Using Photoacoustic Effects for Biomedical Applications

Affiliations
Review

Optical Light Sources and Wavelengths within the Visible and Near-Infrared Range Using Photoacoustic Effects for Biomedical Applications

Unsang Jung et al. Biosensors (Basel). .

Abstract

The photoacoustic (PA) effect occurs when sound waves are generated by light according to the thermodynamic and optical properties of the materials; they are absorption spectroscopic techniques that can be applied to characterize materials that absorb pulse or continuous wave (CW)-modulated electromagnetic radiation. In addition, the wavelengths and properties of the incident light significantly impact the signal-to-ratio and contrast with photoacoustic signals. In this paper, we reviewed how absorption spectroscopic research results have been used in applying actual photoacoustic effects, focusing on light sources of each wavelength. In addition, the characteristics and compositions of the light sources used for the applications were investigated and organized based on the absorption spectrum of the target materials. Therefore, we expect that this study will help researchers (who desire to study photoacoustic effects) to more efficiently approach the appropriate conditions or environments for selecting the target materials and light sources.

Keywords: optical source; photoacoustic effect; photoacoustic material; wavelength.


Conflict of interest statement

The authors declare no conflict of interest.

Figures

Figure 1
Figure 1
NO2 absorption cross section (red) including the photochemical dissociation area (green) and emission spectrum (blue). Reprinted from Li et al., Photoacoustics, 2022, 100325 [21], with permission of Elsevier.
Figure 2
Figure 2
UV–Vis spectrum of the LMCT electronic transition mechanism. Koushik et al., J. Photochem. Photobiol. Chem., 2022, 427: 113811 [7], with permission of Elsevier.
Figure 3
Figure 3
Experimental setup for pulsed photoacoustic Doppler flow measurement. Reprinted from Brunker et al., Sci. Rep., 2016, 6, 1: 20902 [23], with permission of Springer Nature.
Figure 4
Figure 4
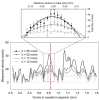
Profiles of velocity measurements corresponding to signal segments. Reprinted from Brunker et al., Sci. Rep., 2016, 6, 1: 20902 [23], with permission of Springer Nature.
Figure 5
Figure 5
OR-PAM monitored the dynamic changes of tumor vasculature in response to DC101 therapy. (A) Depth-encoded maximum amplitude projection (MAP) of tumor vascularity, (B) schematic of therapy response monitoring, and (C) quantification of tumor vasculature. Reprinted from Zhou et al., Photoacoustics, 2019, 15: 100143 [22], with permission of Elsevier.
Figure 6
Figure 6
(A) Cross-sectional PA B-mode image of a human finger. Quantifications of (A) vascular movement. (C,D) Frequency responses of (B) and their dominant frequencies of 1.35 Hz. (E) Comparison of the heart rates. Reprinted from J.Ahn et al., Photoacoustics, 2022, 27: 100374 [24], with permission of Elsevier.
Figure 7
Figure 7
(A) Schematic of the Vevo LAZR system setup. (B) Photoacoustic and (D) ultrasound images of scAuNP-PFH-NEs. (C) Photoacoustic and (E) ultrasound signals. Reprinted from Fernandes et al., Langmuir, 2016, 32,42: 10870–10880 [25], with permission of the American Chemical Society.
Figure 8
Figure 8
Schematic of tunable-color OR-PAM system. Reprinted from Bui et al., Sci. Rep., 2016, 8,1: 018-20139-0 [26], with permission of Spring Nature.
Figure 9
Figure 9
(A) TEM image of fabricated PB NPs. (B) Measured absorption spectra of PB NPs (blue) and optical absorption coefficients of blood with 90% (red) and 10% (black) oxygen saturation adapted from Prahl 37 and Kollias et al. Reprinted from Bui et al., Sci. Rep., 2016, 8,1: 018-20139-0 [26], with permission of Spring Nature.
Figure 10
Figure 10
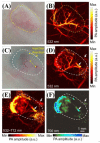
(A,B) Photograph and corresponding PA MAP image of blood vessels in the mouse tumor model (CF). The wavelength and the corresponding pulse energy were as follows; (B,D) 532 nm, 0.8 μJ; (E) 532–712 nm (full spectrum), 1.5 μJ; (F) 700 ± 12.5 nm, 0.2 μJ. Reprinted from Bui et al., Sci. Rep., 2016, 8,1:018-20139-0 [26], with permission of Spring Nature.
Figure 11
Figure 11
Schematic of the photoacoustic microscope for nanoshell imaging: Ti:Sa, Ti:sapphire. Reprinted from Li et al., J. Biomed. Opt., 2009, 14: 010507 [27], with permission from the Optical Society of America.
Figure 12
Figure 12
In vivo non-invasive photoacoustic images of nanoshell extravasation from solid tumor vasculature; (A,C,E,G) show in vivo maximum-amplitude-projected (MAP) images acquired prior to nanoshell administration; (B,D,F,H) show in vivo B-scan images that correspond to the scanning position. Reprinted from Li et al., J. Biomed. Opt., 2009, 14: 010507 [27], with permission from the Optical Society of America.
Figure 13
Figure 13
Optical characteristics of DNDs suspended in DI water as functions of the wavelength. (A) Absorption spectrum measured with an integrating sphere, and (B) PA spectrum. Reprinted from Zhang et al., J. Biomed. Opt., 2013, 18, 2: 026018 [28], with permission from the Optical Society of America.
Figure 14
Figure 14
Photoacoustic images taken after injecting DNDs subcutaneously at (A) the back (MAP image) and (B) the ventral side of the thigh of the mouse (B-scan image). Reprinted from Zhang et al., J. Biomed. Opt., 2013, 18, 2: 026018 [28], with permission from the Optical Society of America.
Figure 15
Figure 15
Extinction coefficient spectra of 0.5 mM CuS NP aqueous solution (solid line) and pure water (dotted line). The vertical line is positioned at 1064 nm. Reprinted from Ku et al., ACS Nano 2012, 6, 8: 7489–7496 [35], with permission of the Optical Society of America.
Figure 16
Figure 16
Comparison of deep embedded objects and their photoacoustic images. Photograph of (A) chicken breast muscle blocks stacked, (B) cross-section of chicken breast muscle with copper sulfide nanoparticles; two-dimensional photoacoustic image at a depth of (C) ∼2.5 cm and (D) ∼5 cm. Reprinted from Ku et al., ACS Nano. 2012; 6, 8: 7489–7496 [35], with permission of the Optical Society of America.
Figure 17
Figure 17
(A) Measured energy and width of the output pulse. (B) Temporal trace of the output pulse at 100 kHz. (C) Schematic of the Q-switched EDFL system. Reprinted from Piao et al., Appl. Phys. Lett., 2016, 108, 14: 143701 [37], with permission of the American Institute of Physics.
Figure 18
Figure 18
(A) Acoustic microscope. (B) An optical view of a stained blood smear with the transducer. (C) A neutrophil is visible within the crosshairs. Reprinted from Strohm et al., Photoacoustics, 2016, 4, 1: 36-42 [38], with permission of Elsevier.
Figure 19
Figure 19
(A) Optical wavelengths emitted from the 532 nm fiber-coupled laser. (B) The absorption spectrum of the Wright–Giemsa stain. Reprinted from Strohm et al., Photoacoustics, 2016, 4, 1: 36–42 [38], with permission of Elsevier.
Figure 20
Figure 20
Composite photoacoustic images of the neutrophils, lymphocytes, and monocytes created by merging 532 and 600 nm photoacoustic images. Reprinted from Strohm et al., Photoacoustics, 2016, 4, 1: 36–42 [38], with permission of Elsevier.
Figure 21
Figure 21
Multi-parametric PAM platform. (A) System schematic (DAQ: data acquisition). (B) Blow-up of the scan head boxed in (A). (C) Scanning mechanism for simultaneous acquisition of vascular anatomy, oxygen saturation, and blood flow. Reprinted from Ning et al., Opt. Lett., 2015, 40, 6: 910–913 [39], with permission of the Optical Society of America.
Figure 22
Figure 22
Simultaneous PAM of (A) vascular anatomy, (B) oxygen saturation of hemoglobin (SO2), and (C) blood flow speed in a nude mouse ear in vivo. Vessel segmentation reveals dynamic changes in (D) vessel diameter, (E) SO2, and (F) flow speed. (G) Conservation of the volumetric inflow and outflow rates at each bifurcation. Reprinted from Ning et al., Opt. Lett., 2015, 40, 6: 910–913 [39], with permission of the Optical Society of America.
Figure 23
Figure 23
(A) In vivo IR (570) images registered and fused with the rat atlas at the positions of bregma +1, −1.5, and −2.5 mm for stimulation-OFF (upper panels) and stimulation-ON (lower panels). (B) Quantitative analysis of the IR (570) signal changes in the bilateral ROIs between the stimulation-ON and -OFF conditions. Reprinted from Liao et al., Neuroimage, 2010, 52, 2: 562–570 [40], with permission of Elsevier.
Figure 24
Figure 24
(A) In vivo functional ΔIF(560) (upper panels) and ΔIF(600) (lower panels) images registered and fused with the rat atlas at bregma +1, −1.5, and −2.5 mm. (B) Quantitative analysis of the IF(560) signal changes in the bilateral ROIs between the stimulation-ON and -OFF conditions. (C) Quantitative analysis of the IF(600) in the bilateral ROIs between the stimulation-ON and -OFF conditions. Reprinted from Liao et al., Neuroimage, 2010, 52, 2: 562–570 [40], with permission from Elsevier.
Figure 25
Figure 25
Scheme of the hybrid imaging system. Reprinted from Tservelakis et al., J. Microsc., 2016, 263, 3; 300–306 [44], with permission of Wiley Online Library.
Figure 26
Figure 26
Bimodal photoacoustic and fluorescence imaging of a young rose leaf. (A) OR-PAM MAP image depicting the anthocyanin accumulation. (B) Chlorophylls autofluorescence image of the same region. (C) Combined image of the two contrast modes. Reprinted from Tservelakis et al., J. Microsc., 2016, 263, 3; 300–306 [44], with permission of Wiley Online Library.
Figure 27
Figure 27
The image reconstruction process of proposed hybrid multi-wavelength PA imaging (hPAI) system. (A) Transmitted signal pattern, including two excitation pulses before and after CW laser illumination. (B) Received PA signals. (C) Image reconstruction process, including PA imaging before and after CW laser heating and hPAI obtained by applying differential imaging. Reprinted from Duan et al., Opt. Lett., 2018, 43, 22; 5611–5614 [45], with permission from the Optical Society of America.
Figure 28
Figure 28
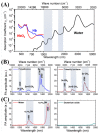
PA spectra of various chemical bond vibrations. (A) Absorption spectra of whole blood and pure water. (B) PA spectra of polyethylene and trimethylpentane. (C) PA spectra of water and deuterium oxide. Adapted from Wang et al., J. Biophotonics, 2012. Reprinted from Wang et al., J. Phys. Chem. Lett., 2013, 4, 13; 2177–2185 [46], with permission of the American Chemical Society.
Figure 29
Figure 29
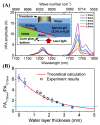
A phantom study that evaluates the effect of water on PA imaging in the near-infrared region. (A) PA spectra of PE at different water layer thicknesses. The inset shows a schematic of the constructed phantom. PE: polyethylene. (B) PA amplitude ratio between the first and second overtone excitation as a function of the water layer thickness. Adapted from Wang et al., J. Biophotonics, 2012. Reprinted from Wang et al., J. Phys. Chem. Lett., 2013, 4, 13; 2177–2185 [46], with permission of the American Chemical Society.

Similar articles

Cited by

References

    1. Bell A.G. Upon the Production and Reproduction of Sound by Light. J. Soc. Telegr. Eng. 1880;9:404–426. doi: 10.1049/jste-1.1880.0046. - DOI
    1. Maslov K., Wang L.V. Photoacoustic Imaging of Biological Tissue with Intensity-Modulated Continuous-Wave Laser. J. Biomed. Opt. 2008;13:024006. doi: 10.1117/1.2904965. - DOI - PubMed
    1. Murray T.W., Balogun O. High-Sensitivity Laser-Based Acoustic Microscopy Using a Modulated Excitation Source. Appl. Phys. Lett. 2004;85:2974–2976. doi: 10.1063/1.1802387. - DOI
    1. Erfanzadeh M., Zhu Q. Photoacoustic Imaging with Low-Cost Sources; A Review. Photoacoustics. 2019;14:1–11. doi: 10.1016/j.pacs.2019.01.004. - DOI - PMC - PubMed
    1. Zhong H., Duan T., Lan H., Zhou M., Gao F. Review of Low-Cost Photoacoustic Sensing and Imaging Based on Laser Diode and Light-Emitting Diode. Sensors. 2018;18:2264. doi: 10.3390/s18072264. - DOI - PMC - PubMed

MeSH terms

LinkOut - more resources