Review
. 2022 Nov 27;12(12):1764.
doi: 10.3390/biom12121764.

Boosting the Full Potential of PyMOL with Structural Biology Plugins

Affiliations
Review

Boosting the Full Potential of PyMOL with Structural Biology Plugins

Serena Rosignoli et al. Biomolecules. .

Abstract

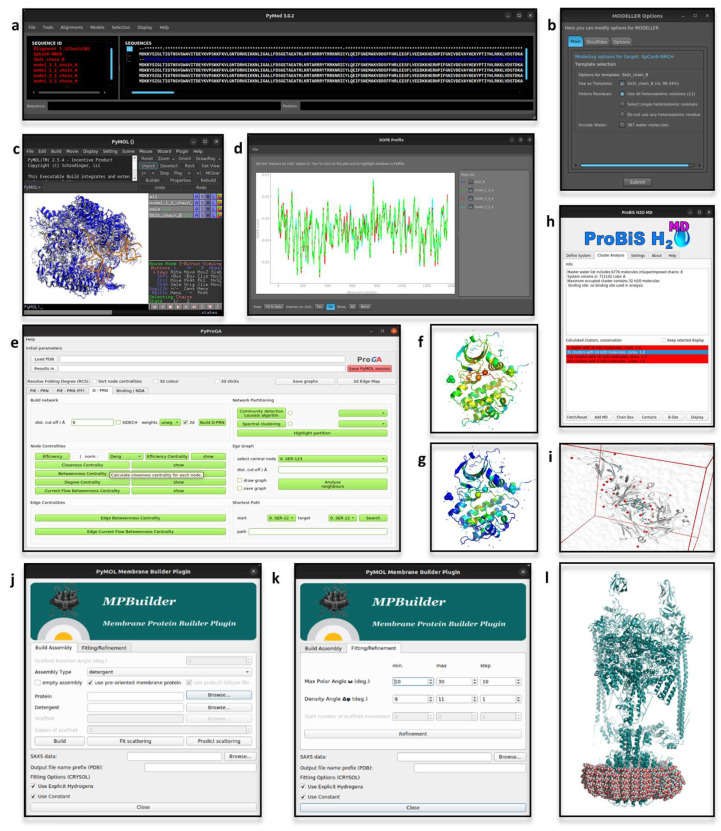
Over the past few decades, the number of available structural bioinformatics pipelines, libraries, plugins, web resources and software has increased exponentially and become accessible to the broad realm of life scientists. This expansion has shaped the field as a tangled network of methods, algorithms and user interfaces. In recent years PyMOL, widely used software for biomolecules visualization and analysis, has started to play a key role in providing an open platform for the successful implementation of expert knowledge into an easy-to-use molecular graphics tool. This review outlines the plugins and features that make PyMOL an eligible environment for supporting structural bioinformatics analyses.

Keywords: PyMOL; bioinformatics; molecular docking; molecular dynamics; molecular viewer; plugin; protein structure prediction; sequence analysis; structural biology; structure-function analysis; virtual screening.


Conflict of interest statement

The authors declare no conflict of interest.

Figures

Figure 3
Figure 3
(a) DockingPie GUI (Windows OS) to set up an ‘all vs all’ MDo analysis with ADFR. (b) Appearance of the DockingPie windows (Ubuntu Linux OS) to run a consensus scoring analysis (c) and to inspect the results. In the latter, the re-scoring results are displayed in an interactive-table that can be clicked to directly visualize the molecules of interest in PyMOL (d). In this example, the re-scored poses were the results of two MDo runs carried out with Vina and Smina, from within DockingPie on a homo-tetrameric protein (PDB-ID: 5KMH [91]). (e) PoseFilter GUI to carry out either RMSD or interaction fingerprint comparison when a directory storing the objects to be analyzed as separated files (i.e., the protein and each conformation of the ligand) is provided. PoseFilter was used to analyze the MDo results obtained with DockingPie. (f) Heatmap of RMS values reporting the results of PoseFilter. (g) Visualization of the DRUGpy plugin and PyMOL workspace. The output data of a FTMap analysis on Aurora-A protein (PDB-ID: 1OL5 [36]) were loaded in DRUGpy for the analysis. DRUGpy automatically shows the identified hot-spots of interaction in PyMOL and, when a protein-ligand complex is analyzed, computes the fractional overlap analysis (shown as a heatmap (h)).
Figure 4
Figure 4
(a) Geo-Measures GUI (Ubuntu Linux OS) to run a Root Mean Square Fluctuations (RMSF) analysis on the MD-trajectory loaded in PyMOL. (bf) Plots of the results of the analyses carried out from within Geo-Measures. In this example, the analyzed data were MD simulations of the multiple endocrine neoplasia type 1 (MEN1) [106]. On such trajectories, PCA (b), RMSF (c), RMSD (d), Rg (e) and PDF between RMSD and Rg values (f), were computed. (g) Enlighten2 GUI (Windows OS) to set-up the parameters for molecule preparation. (h) Enlighten2 GUI (Ubuntu Linux OS) to run the MD simulation. (i) Enlighten2 rendering of the solvent cap in PyMOL. In this example, the tutorial provided on the Enlighten2 website for beta-lactamase TEM-1 (PDB-ID: 1BTL; [107]) was followed. (j,k) Appearance of pyMODE-TASK (Ubuntu Linux OS) tabs for the setup of PCA, MDS and t-SNE analyses. (ln) Plots provided by pyMODE-TASK to show the results of the PCA, MDS and t-SNE analyses carried out on MEN1 MD simulations data.
Figure 1
Figure 1
(ad) Appearance of PyMod and PyMOL when running a template-based protein structure prediction. In this example, the ‘fasta’ file of the sequence to be modeled was directly opened in PyMod, while the template structure (PDB-ID: 5B2T [35]) was imported from PyMOL. The sequences of interest are visualized in the dedicated interactive window of PyMod, within which the analyses can be run (a). (b) PyMod window to set-up the parameters to run MODELLER [26] (e.g., how to consider heteroatoms, water molecules or disulfide bridges during calculations). (c) Visualization of the modeled structures in PyMOL workspace. (d) PyMod window for visualizing plots of the quality assessment [28]. (e) Appearance of the pyProGA window, from which the parameters for D-PRN analyses can be set-up. In this example, pyProGA was used to compute two different measurements on a protein (PDB-ID: 1OL5 [36]), which was directly loaded from PyMOL. (f,g) pyProGA processing of the proteins loaded in PyMOL according to the computed measures, which in this example were the ’Degree Centrality’ (f) and ’Betweenness Centrality’ (g). (h) Appearance of ProBiS H20 MD window for analyzing the results. Each identified cluster of conserved water molecules is identified in PyMOL as a red sphere (i). In this example the plugin was used to identify the conserved water molecules from molecular dynamics (MD) trajectories of a globular protein in water (the input files, a topology and a trajectory file, are provided by the ProBiS web-site (http://insilab.org/probis-h2o-md; accessed on 14 October 2022)). (j,k) Appearance of ‘Build Assembly’ and ‘Fitting/Refinement’ tabs of MPBuilder (Ubuntu Linux OS). (l) Visualization in PyMOL of MPBuilder output. The analysis reported here was carried out on the example files provided in MPBuilder development web-resource (https://github.com/emblsaxs/MPBuilder/tree/main/test_cases; accessed on 22 November 2022).
Figure 2
Figure 2
Waterdock 2.0 GUI (mac OS version) for the analysis of the position of water binding sites on holo-(a) or apo-(b) protein structures. Waterdock was tested with inputs available on the plugin development web-resource (https://github.com/bigginlab/WaterDock_pymol; accessed on 22 November 2022). (c) Waterdock rendering of the identified water molecules positions in PyMOL. (d) Example of PyMOL rendering of the pairwise structural alignment of two protein structures (i.e., Aurora-A kinase in two different conformations; PDB-ID: 1OL5 and 1OL6 [36]) obtained by iPBAvizu. (e) Starting window of DCA-MOL, from which alignments and DI-scores can be imported. (f) Example of a contact map obtained from DCA-MOL. Input files available on the plugin development web-resource.

Similar articles

Cited by

References

    1. DeLano W.L. The PyMOL Molecular Graphics System. DeLano Scientific; San Carlos, CA, USA: 2002.
    1. PyMOL. [(accessed on 14 October 2022)]. Available online: http://www.pymol.org/pymol.
    1. Summerfield M. Rapid GUI Programming with Python and Qt: The Definitive Guide to PyQt Programming. Prentice Hall; Upper Saddle River, NJ, USA: 2008.
    1. An Introduction to Tkinter. [(accessed on 14 October 2022)]. Available online: www.Pythonware.Com/Library/Tkinter/Introduction/Index.Htm.
    1. Anaconda Software Distribution Anaconda Documentation. [(accessed on 14 October 2022)]. Available online: https://docs.anaconda.com/

Publication types

LinkOut - more resources