. 2022 Nov 29;12(12):1777.
doi: 10.3390/biom12121777.

Overexpressed c-Myc Sensitizes Cells to TH1579, a Mitotic Arrest and Oxidative DNA Damage Inducer

Affiliations

Overexpressed c-Myc Sensitizes Cells to TH1579, a Mitotic Arrest and Oxidative DNA Damage Inducer

Sofia Henriksson et al. Biomolecules. .

Abstract

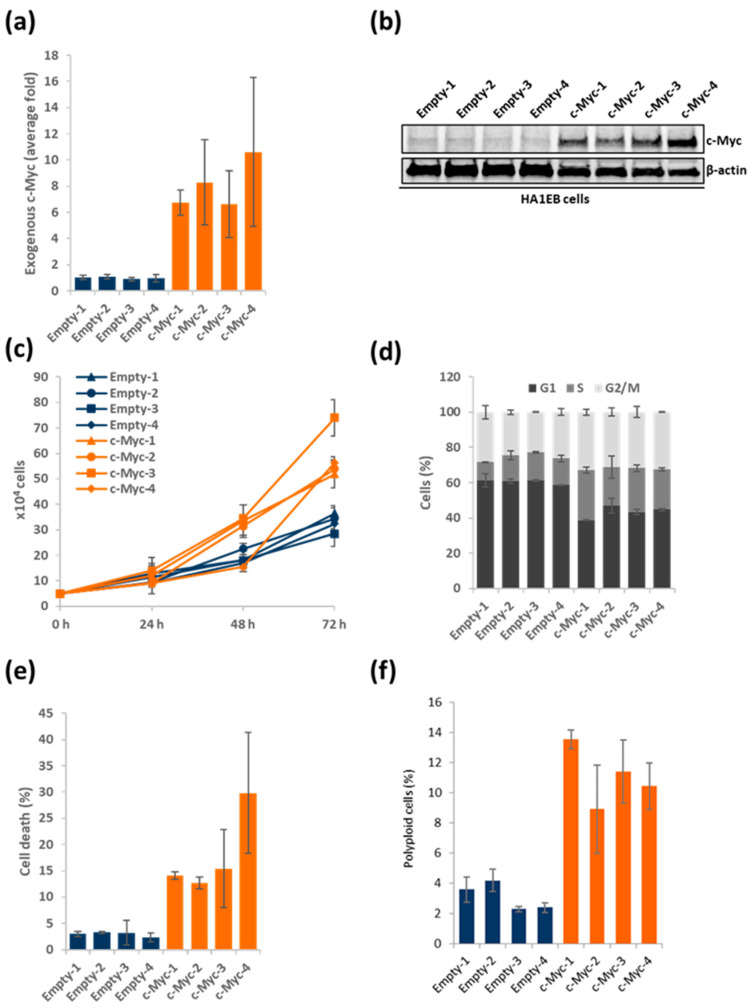
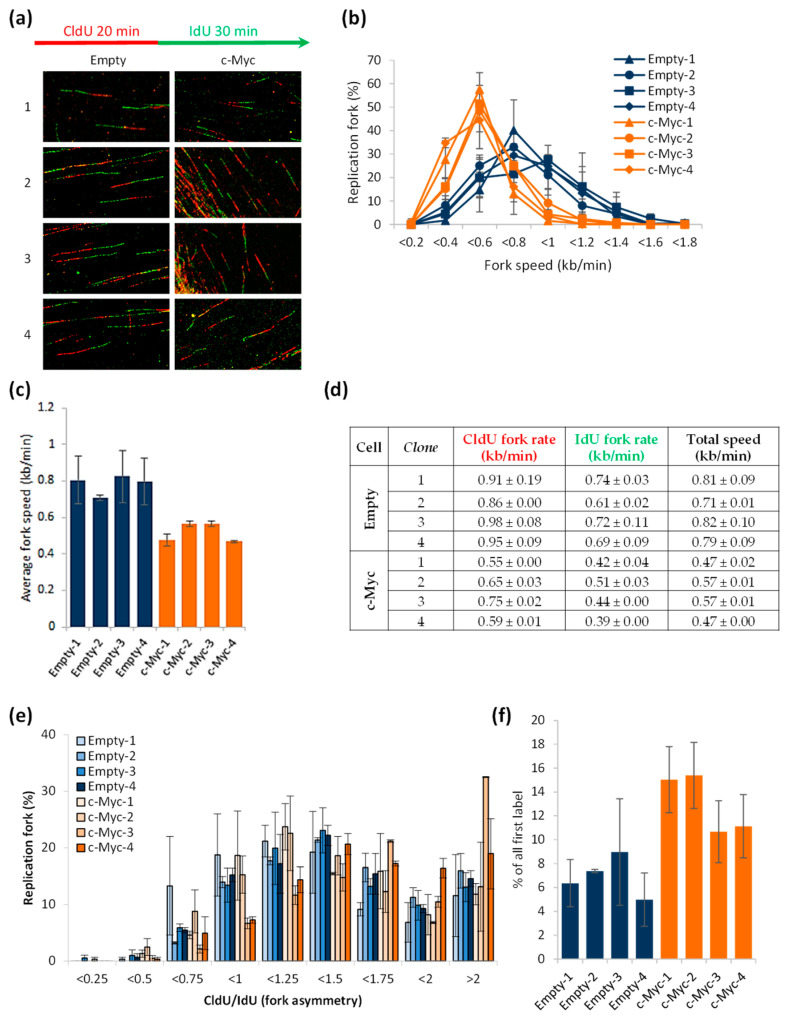
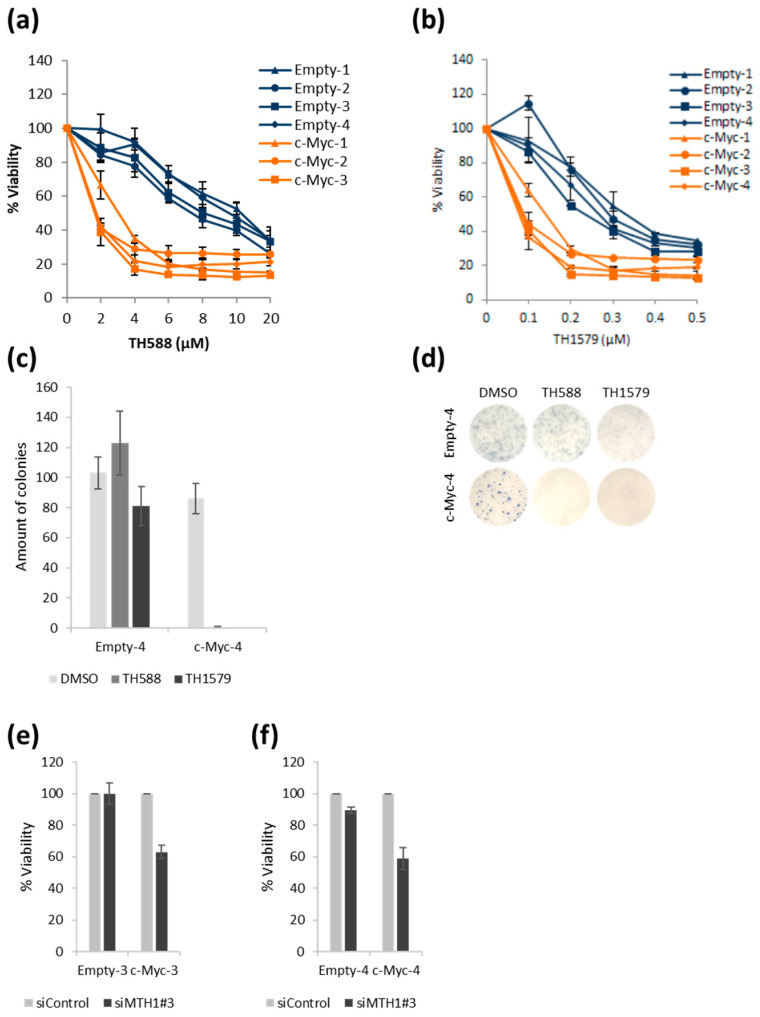
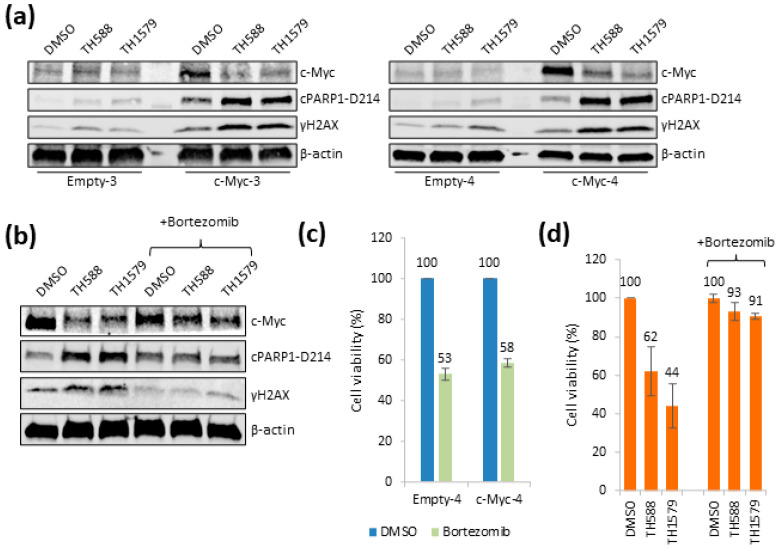
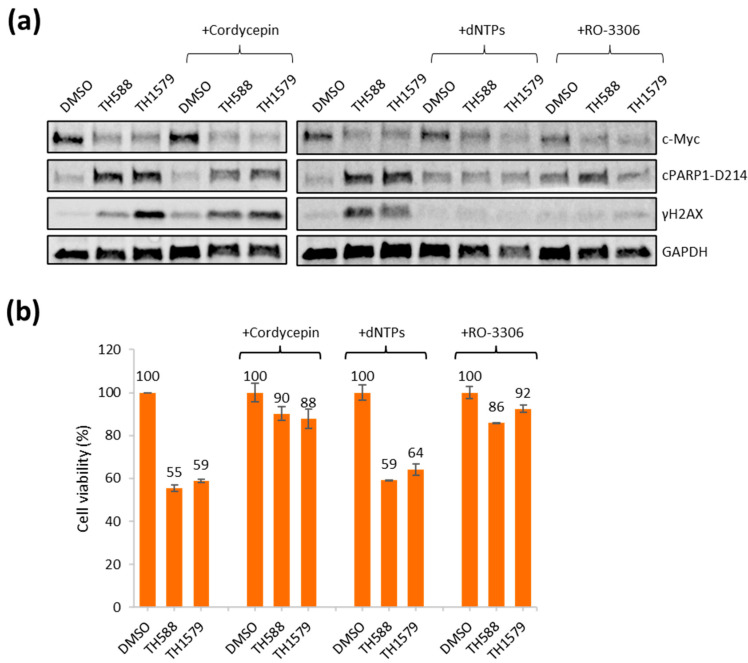
Previously, we reported that MTH1 inhibitors TH588 and TH1579 selectively induce oxidative damage and kill Ras-expressing or -transforming cancer cells, as compared to non-transforming immortalized or primary cells. While this explains the impressive anti-cancer properties of the compounds, the molecular mechanism remains elusive. Several oncogenes induce replication stress, resulting in under replicated DNA and replication continuing into mitosis, where TH588 and TH1579 treatment causes toxicity and incorporation of oxidative damage. Hence, we hypothesized that oncogene-induced replication stress explains the cancer selectivity. To test this, we overexpressed c-Myc in human epithelial kidney cells (HA1EB), resulting in increased proliferation, polyploidy and replication stress. TH588 and TH1579 selectively kill c-Myc overexpressing clones, enforcing the cancer cell selective killing of these compounds. Moreover, the toxicity of TH588 and TH1579 in c-Myc overexpressing cells is rescued by transcription, proteasome or CDK1 inhibitors, but not by nucleoside supplementation. We conclude that the molecular toxicological mechanisms of how TH588 and TH1579 kill c-Myc overexpressing cells have several components and involve MTH1-independent proteasomal degradation of c-Myc itself, c-Myc-driven transcription and CDK activation.

Keywords: DNA damage; MTH1; TH1579; TH588; c-Myc; cancer; cell death; replication stress.


Conflict of interest statement

A patent has been filed with MTH1 inhibitors where T.H. is listed as the inventor. The Intellectual Property Right is owned by the non-profit Thomas Helleday Foundation for Medical Research (THF). T.H. and U.W.B. are board members of the THF. U.W.B is CEO of Oxcia AB. T.H., U.W.B., S.H. and J.M.C.-M., have shares in Oxcia AB. THF is the sponsor for an on-going clinical phase 1 trial with TH1579. The other authors declare that there are no conflicts of interest.

Figures

Figure 1
Figure 1
HA1EB cells overexpressing c-Myc proliferate faster. (a) Exogenous c-Myc mRNA levels in HA1EB cells, n = 3 ± S.E.M. (b) Exogenous c-Myc protein expression in HA1EB cells. (c) HA1EB cells were seeded and counted daily, n = 2 ± S.E.M. (d) Cell cycle profiles of HA1EB cells, n = 2 ± S.E.M. (e,f) HA1EB cells were seeded and left to grow for 72 h. Then, cells were harvested, stained with 7-AAD and analyzed using FACS. Dead cells (e), <2N DNA content and polyploid cells (f), >4N DNA content, n = 2 ± S.E.M.
Figure 2
Figure 2
Increased EdU incorporation and RPA32 foci in c-Myc overexpressing HA1EB cells. (a,b) HA1EB cells were labeled with EdU for 15 min and stained with EdU Click-iT (according to the manufacturer’s instructions) and anti-RPA32 antibody. DNA was stained using DAPI. Images were taken using a Zeiss LSM-780 confocal microscope and analyzed using Image J software. A total of 150 cells/sample was counted, n = 3 ± S.E.M. (c) Quantification of EdU incorporation. Mean intensity ≥5 AU was considered as positive. (d) Percentage of cells with ≥5 RPA32 foci. (e) Percentage of cells with ≥5 RPA32/EdU co-localized foci.
Figure 3
Figure 3
c-Myc overexpression induces replication stress. (af) Cells were seeded and left to grow for 48 h. After that, cells were labeled for 20 min with CldU, washed and labeled with IdU for 30 min. Finally, cells were harvested, and the DNA fibers were obtained. DNA containing CldU was stained in red and DNA containing IdU was stained in green. The length of individual, well-spread labeled fibers was measured and converted into kb/min. Quantitative data presented as means, n = 2 ± S.E.M. (a) Schematic illustration of CldU (red) and IdU (green) labeling during the assay and representative images of replicative fork tracks for control cells (HA1EB empty) and c-Myc overexpressing cells (HA1EB c-Myc). (b) Graph shows the distribution of fork progression speed (kb/min) of the first and second pulses. (c) Average of the replication fork extension rates during the first and the second pulses. (d) Quantification of the mean replication fork speed (kb/min) during the first (CldU, 20 min), the second (IdU, 30 min) and both pulses. (e) Distribution of CldU/IdU ratio of replication fork progression. The value equal to 1 means the extension speed was similar during both pulses (perfect symmetry). (f) First-label origins (green–red–green) are shown as percentage of all red (CldU) labeled tracks.
Figure 4
Figure 4
Viability of c-Myc overexpressing cells is decreased upon TH588 or TH1579 treatment or MTH1 silencing. (a,b) Empty and c-Myc overexpressing cells were plated and treated with the indicated concentrations of TH588 or TH1579 (or DMSO). After 72 h, 10 μg/mL resazurin was added for 4 h and viability was determined (values are normalized to DMSO), n = 3 (a), n = 2 (b) ± S.E.M. (c) Empty-4 and c-Myc-4 cells were seeded, immediately treated with 5 µM TH588 or 0.5 µM TH1579 for 48 h, new media were added every 2–3 days until colony staining (9–10 days after seeding). The values were normalized to DMSO control, n = 2 ± S.E.M. (d) Representative clonogenic survival assay images of Empty-4/c-Myc-4 cells. (e,f) Cells were seeded and transfected with 10 nM siRNA. After 72 h, 10 μg/mL resazurin was added for 4 h and viability was determined (values are normalized to siControl), (e) n = 3, (f) n = 2 ± S.E.M.
Figure 5
Figure 5
TH588 and TH1579 trigger cell death by degradation of c-Myc protein. (a) Empty-3/c-Myc-3 or Empty-4/c-Myc-4 were treated with 5 µM TH588 or 0.5 µM TH1579 for 24 h. Following cell lysis, the indicated proteins were blotted. (b) c-Myc-4 cells were treated with 5 µM TH588 or 0.5 µM TH1579 for 24 h ± co-addition of bortezomib (10 nM). The indicated proteins were blotted. (c,d) c-Myc-4 cells were seeded and following 24 h, the cells were treated with 5 µM TH588 or 0.5 µM TH1579 for 24 h ± co-addition of bortezomib (10 nM). Then, 10 μg/mL resazurin was added for 4 h and viability was determined (values are normalized to internal DMSO control), n = 2 ± S.E.M.
Figure 6
Figure 6
Inhibition of transcription and CDK activity reverse DNA damage and toxicity of mitotic MTH1 inhibitors TH588 and TH1579 in c-Myc overexpressing cells. (a) c-Myc-4 cells were treated with 5 µM TH588 or 0.5 µM TH1579 for 24 h ± co-addition of cordycepin (50 µM), nucleosides (dNTPs) (50 µM) or RO-3306 (5 µM). The indicated proteins were blotted. (b) c-Myc-4 cells were seeded and following 24 h, the cells were treated with 5 µM TH588 or 0.5 µM TH1579 for 24 h ± co-addition of cordycepin (50 µM), nucleosides (dN) (50 µM) or RO-3306 (5 µM). Then, 10 μg/mL resazurin was added for 4 h and viability was determined (values are normalized to internal DMSO control), n = 2 ± S.E.M.

Similar articles

References

    1. Gad H., Koolmeister T., Jemth A.-S., Eshtad S., Jacques S.A., Ström C.E., Svensson L.M., Schultz N., Lundbäck T., Einarsdottir B.O., et al. MTH1 inhibition eradicates cancer by preventing sanitation of the dNTP pool. Nature. 2014;508:215–221. doi: 10.1038/nature13181. - DOI - PubMed
    1. Berglund U.W., Sanjiv K., Gad H., Kalderén C., Koolmeister T., Pham T., Gokturk C., Jafari R., Maddalo G., Seashore-Ludlow B., et al. Validation and development of MTH1 inhibitors for treatment of cancer. Ann. Oncol. 2016;27:2275–2283. doi: 10.1093/annonc/mdw429. - DOI - PubMed
    1. Kawamura T., Kawatani M., Muroi M., Kondoh Y., Futamura Y., Aono H., Tanaka M., Honda K., Osada H. Proteomic profiling of small-molecule inhibitors reveals dispensability of MTH1 for cancer cell survival. Sci. Rep. 2016;6:26521. doi: 10.1038/srep26521. - DOI - PMC - PubMed
    1. Gad H., Mortusewicz O., Rudd S.G., Stolz A., Amaral N., Brautigham L. MTH1 promotes mitotic progression to avoid oxidative DNA damage in cancer cells. bioRxiv. 2019:575290. doi: 10.1101/575290. - DOI
    1. Rudd S.G., Gad H., Sanjiv K., Amaral N., Hagenkort A., Groth P., Ström C.E., Mortusewicz O., Berglund U.W., Helleday T. MTH1 Inhibitor TH588 Disturbs Mitotic Progression and Induces Mitosis-Dependent Accumulation of Genomic 8-oxodG. Cancer Res. 2020;80:3530–3541. doi: 10.1158/0008-5472.CAN-19-0883. - DOI - PubMed

Publication types

LinkOut - more resources