. 2022 Dec 7;12(12):1828.
doi: 10.3390/biom12121828.

Development of a Vascularized Human Skin Equivalent with Hypodermis for Photoaging Studies

Affiliations

Development of a Vascularized Human Skin Equivalent with Hypodermis for Photoaging Studies

Martina M Sanchez et al. Biomolecules. .

Abstract

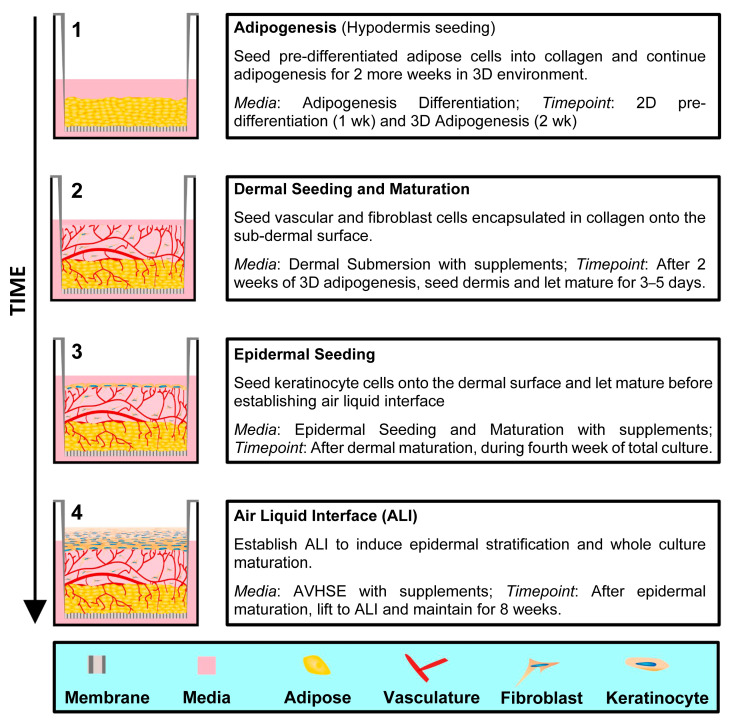
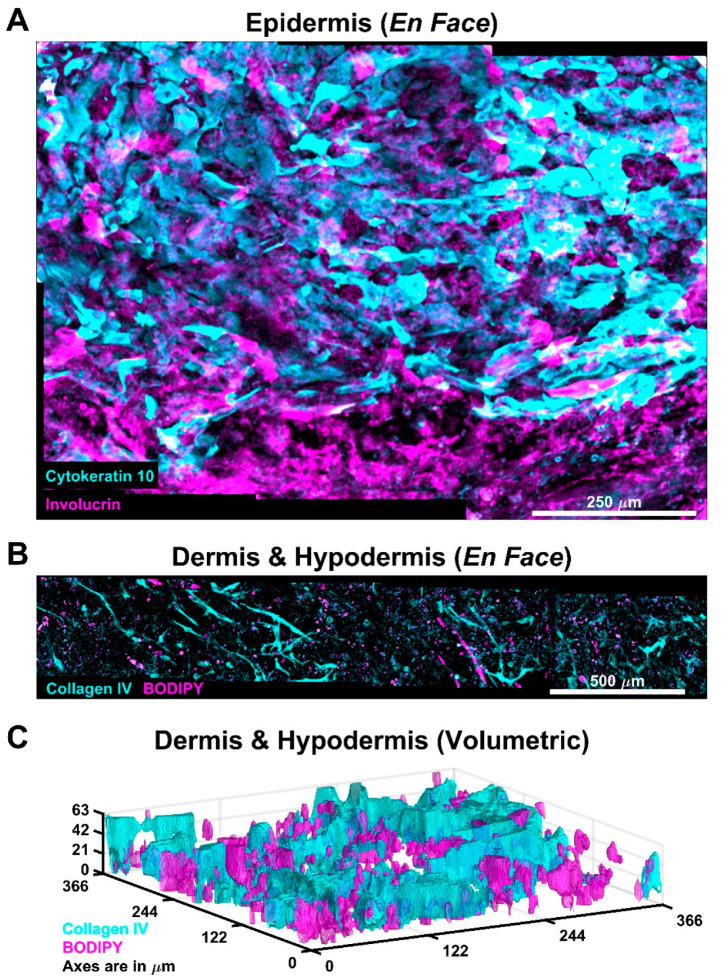
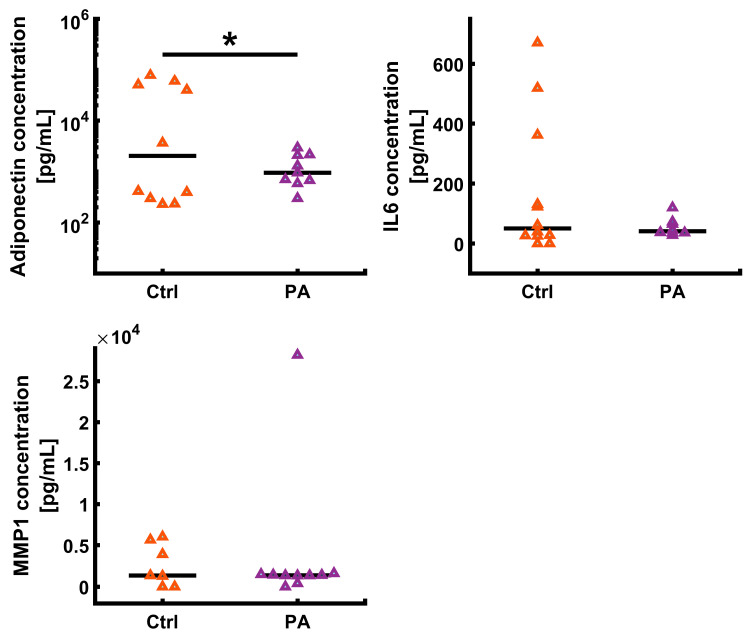
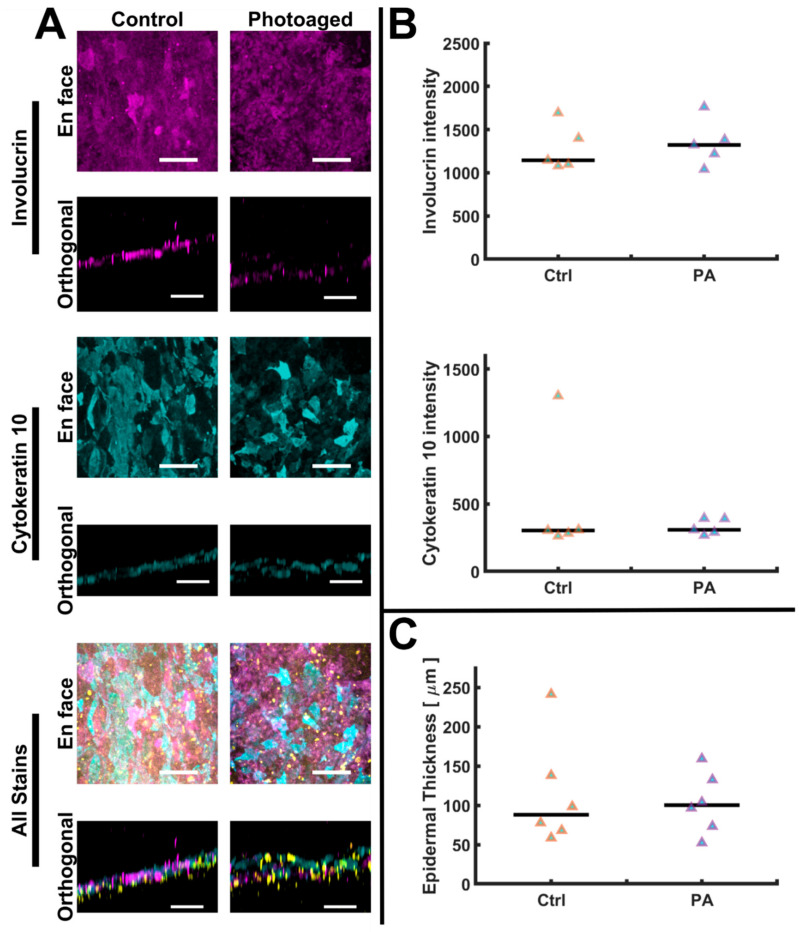
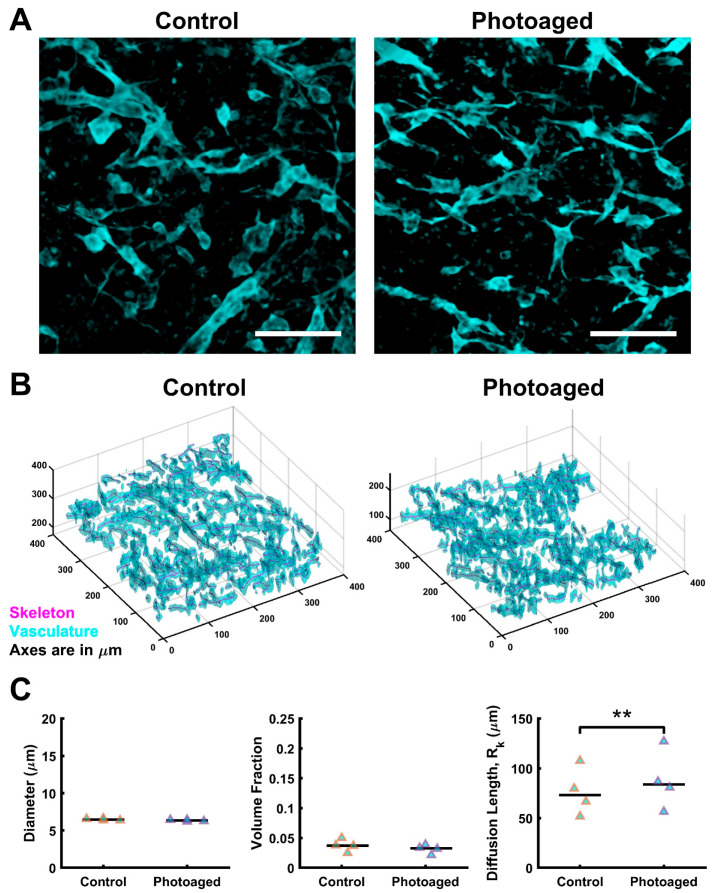
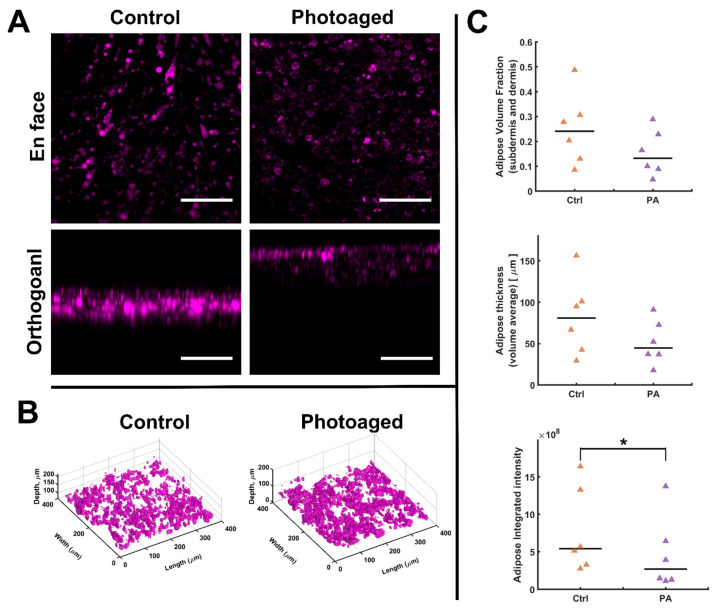
Photoaging is an important extrinsic aging factor leading to altered skin morphology and reduced function. Prior work has revealed a connection between photoaging and loss of subcutaneous fat. Currently, primary models for studying this are in vivo (human samples or animal models) or in vitro models, including human skin equivalents (HSEs). In vivo models are limited by accessibility and cost, while HSEs typically do not include a subcutaneous adipose component. To address this, we developed an "adipose-vascular" HSE (AVHSE) culture method, which includes both hypodermal adipose and vascular cells. Furthermore, we tested AVHSE as a potential model for hypodermal adipose aging via exposure to 0.45 ± 0.15 mW/cm2 385 nm light (UVA). One week of 2 h daily UVA exposure had limited impact on epidermal and vascular components of the AVHSE, but significantly reduced adiposity by approximately 50%. Overall, we have developed a novel method for generating HSE that include vascular and adipose components and demonstrated potential as an aging model using photoaging as an example.

Keywords: HSE; aging; human skin equivalent; photoaging; scaffold; self-assembly; tissue engineering.


Conflict of interest statement

The authors declare no conflict of interest. The funders had no role in the design of the study; in the collection, analyses, or interpretation of data; in the writing of the manuscript; or in the decision to publish the results.

Figures

Figure 1
Figure 1
AVHSE generation. There are four main steps in creating an AVHSE: (1) Adipogenesis, (2) Dermal seeding and maturation, (3) Epidermal seeding, and (4) Air liquid interface. Cartoons on the left show cross-sectional representations of AVHSE during each step.
Figure 2
Figure 2
AVHSE allow for large-scale assessment of cultures. (A) Demonstration of scale of epidermal analysis. Cytokeratin 10 (cyan) is a suprabasal epidermal marker and Involucrin (magenta) is a stratum corneal marker. Image is an en face max projection of ~0.7 × 1 × 0.2 mm volume. (B) Adipose and vasculature morphology can be assessed at scales that span 3.6 mm (approximately half of this representative AVHSE), presented as an en face max projection. Collagen IV (cyan) marks the vasculature and BODIPY (magenta) marks lipid droplets secreted from mature fat cells (magenta). (C) Volumetric rendering of segmented Collagen IV (cyan) and BODIPY (magenta), demonstrating vascular infiltration into the hypodermis. Images were acquired pre-clearing and are median filtered for clarity.
Figure 3
Figure 3
Cytokine evaluation from cell media was completed via ELISA. Cell media was collected after week 8 of culture. All values were corrected by a zero standard and values below detection limit were set to zero. All values were determined from four-parametric logistic curve fits. Data is shown as medians (black bars) and individual data points (triangles). Sample numbers varied for each assay due to limited culture volumes. Adiponectin: for each condition n = 10. IL-6: control n = 12 and photoaged n = 8; MMP1: control n = 7; and photoaged n = 10. A two-tailed t-test showed a significant decline in the adiponectin secreted into media after photoaging AVHSEs (p < 0.05; indicated with *).
Figure 4
Figure 4
Epidermal characterization and quantification. (A) The epidermal differentiation markers, Involucrin (magenta) and Cytokeratin 10 (cyan), localize to epidermis. Nuclei are marked with a DRAQ7 counterstain and shown in yellow. No apparent qualitative changes in the experimental groups were observed, as shown in these representative images. Scalebars are 100 µm. (B) Quantification of epidermal intensities was completed from z-axis maximum projections; no indication of intensity changes was found in either epidermal stain when comparing control (Ctrl) to photoaged (PA) samples. For both control and photoaged groups n = 5. (C) Epidermal thickness was volumetrically quantified and no differences were indicated (n = 6 for both control and photoaged groups). Data is shown as medians (black bars) and individual data points (triangles). Images were acquired pre-clearing and are median filtered for clarity.
Figure 5
Figure 5
Vascular staining and quantification. (A) A comparison of maximum projections of confocal images of control v. photoaged AVHSE sub-dermis and dermis; Collagen IV marks vasculature in cyan. Scalebars are 100 µm. (B) Segmentation of the vascular fraction (cyan) was completed on 6 cleared sub-volumes per sample. Skeletonization was completed using segmentation data (magenta line). Shown is a representative 3D rendering of one confocal sub-volume. (C) Segmentation and skeletonization of vascular networks enable quantitative assessment of the morphology (n = 4 for each condition). Vessel diameter and volume fractions remain stable when AVHSEs are photoaged and there is an increase in diffusion length for photoaged (p < 0.01; indicated with **). Data is shown as medians (black bars) and individual data points (triangles). Images are median filtered for clarity.
Figure 6
Figure 6
Adipose staining and quantification. (A) A comparison of confocal images of control vs. photoaged AVHSE sub-dermis; BODIPY marks lipid accumulation at mature adipocytes in magenta. Scalebars are 100 µm. (B) Representative 3D rendering of adipose volume fraction for control and photoaged samples. (C) Top-Volume Fraction was calculated based on segmentation of the BODIPY stain as seen in B. Middle-Thickness quantification based on morphological closing of BODIPY segmentation. Bottom-Integrated Intensity of BODIPY across the volume shows a significant (p < 0.05; indicated with *) drop in photoaged samples (n = 6 for each condition). Data is shown as medians (black bars) and individual data points (triangles). Images were acquired pre-clearing and are median filtered for clarity.

Similar articles

Cited by

References

    1. Mathes S.H., Ruffner H., Graf-Hausner U. The use of skin models in drug development. Adv. Drug Deliv. Rev. 2014;69–70:81–102. doi: 10.1016/j.addr.2013.12.006. - DOI - PubMed
    1. Fenske N.A., Lober C.W. Structural and functional changes of normal aging skin. (Pt 1)J. Am. Acad. Dermatol. 1986;15:571–585. doi: 10.1016/S0190-9622(86)70208-9. - DOI - PubMed
    1. Chung J.H., Eun H.C. Angiogenesis in skin aging and photoaging. J. Dermatol. 2007;34:593–600. doi: 10.1111/j.1346-8138.2007.00341.x. - DOI - PubMed
    1. Ali N., Hosseini M., Vainio S., Taïeb A., Cario-André M., Rezvani H. Skin equivalents: Skin from reconstructions as models to study skin development and diseases. Br. J. Dermatol. 2015;173:391–403. doi: 10.1111/bjd.13886. - DOI - PubMed
    1. Farage M.A., Miller K.W., Zouboulis C.C., Piérard G.E., Maibach H.I. Gender differences in skin aging and the changing profile of the sex hormones with age. J. Steroids Horm. Sci. 2012;3:109. doi: 10.4172/2157-7536.1000109. - DOI

Publication types